Attached files
| file | filename |
|---|---|
| 8-K - FORM 8-K - W. P. Carey Inc. | d413609d8k.htm |
Exhibit 99.1

W. P. Carey & Co. LLC
Supplemental Unaudited Operating and Financial Data
As of June 30, 2012

Important Disclosures About this Supplemental Package
As used in this supplemental package, the terms “W. P. Carey,” “WPC LLC,” “we,” “us” and “our” include W. P. Carey & Co. LLC, its consolidated subsidiaries and predecessors, unless otherwise indicated. “W. P. Carey Inc.” and “WPC INC” means the combined successor company following our proposed merger (the “Merger”) with Corporate Property Associates 15 Incorporated (“CPA®:15”). “GAAP” means generally accepted accounting principles in the United States. “CPA® REITs” means CPA®:15, Corporate Property Associates 16 – Global Incorporated (“CPA®:16 – Global”) and Corporate Property Associates 17 – Global Incorporated (“CPA®:17 – Global”). The “REITs” means the CPA® REITs and Carey Watermark Investors Incorporated (“CWI”). Corporate Property Associates 14 Incorporated (“CPA®:14”) was part of the CPA® REITs until its merger with a subsidiary of CPA®:16 – Global on May 2, 2011 (the “CPA®:14/16 Merger”).
Important Note Regarding Non-GAAP Financial Measures
This supplemental package includes non-GAAP financial measures, including earnings before interest, taxes, depreciation and amortization (“EBITDA”), adjusted EBITDA, funds from operations - as adjusted (“AFFO”) and total adjusted revenue. A description of these non-GAAP financial measures and reconciliations to the most directly comparable GAAP measures are provided in this supplemental package.
Cautionary Statement Concerning Forward-Looking Statements:
Certain of the matters discussed in this communication contain forward-looking statements within the meaning of the Federal securities laws. The forward-looking statements include, among other things, statements regarding the intent, belief or expectations of W. P. Carey and can be identified by the use of words such as “may,”“ “will,” “should,” “would,” “assume,” “outlook,” “seek,” “plan,” “believe,” “expect,” “anticipate,” “intend,” “estimate,” “forecast,” and other comparable terms. These statements are based on the current expectations of the management of W. P. Carey and W. P. Carey Inc. (the “Company”). A number of factors could cause the Company’s actual results, performance or achievement to differ materially from those anticipated. Among those risks, trends and uncertainties are the risks associated with the merger of W.P. Carey with and into W.P. Carey Inc. and simultaneous conversion to a REIT and the merger of W. P. Carey and CPA®:15; general economic climate; the supply of and demand for office and industrial properties; interest rate levels; the availability of financing; and other risks associated with the acquisition and ownership of properties, including risks that the tenants will not pay rent, or that costs may be greater than anticipated. For further information on factors that could impact W. P. Carey and the Company, reference is made to W. P. Carey’s and the Company’s filings with the Securities and Exchange Commission (the “SEC”). Readers are cautioned not to place undue reliance on these forward-looking statements, which speak only as of the date of this communication. Except as required under the federal securities laws and the rules and regulations of the SEC, W. P. Carey and the Company do not undertake any obligation to release publicly any revisions to the forward-looking statements to reflect events or circumstances after the date of this communication or to reflect the occurrence of unanticipated events.
W. P. CAREY & CO. LLC
Supplemental Unaudited Operating and Financial Data
As of June 30, 2012
| Contents |
Page No. | |||
| Highlights |
||||
| Company Overview |
1 | |||
| Key Operational Metrics |
2 | |||
| Financial Information |
||||
| Unaudited Pro Forma Consolidated Balance Sheet |
3-6 | |||
| Unaudited Combined Income Statement |
7 | |||
| Reconciliation of Net Income to Funds from Operations - as Adjusted (AFFO) |
8-10 | |||
| WPC Inc Reconciliation of Net Income to Funds from Operations - as Adjusted (AFFO) |
11-12 | |||
| Reconciliation of Net Income to EBITDA |
13-14 | |||
| WPC Inc Reconciliation of Net Income to Adjusted EBITDA |
15 | |||
| Adjusted Revenue |
17-19 | |||
| Capitalization |
||||
| Financial and Operational Statistics |
20 | |||
| Portfolio Debt Overview |
21 | |||
| Detailed Debt Summary |
22-24 | |||
| CPA REITs |
25 | |||
| Joint Venture Information |
26 | |||
| WPC INC Portfolio Information |
||||
| Portfolio Analysis - Rent Contribution and Historical Occupancy |
27 | |||
| Portfolio and Diversification Analysis by Property Type |
28 | |||
| Portfolio and Diversification Analysis by Tenant Industry |
29 | |||
| Portfolio and Diversification Analysis by Geography |
30 | |||
| Portfolio Lease Maturity Analysis |
31 | |||
| W. P. Carey 2012 Investment Activity |
||||
| Acquisitions |
32 | |||
| Dispositions |
33 | |||
| APPENDIX A |
34 | |||
W. P. CAREY & CO. LLC
Company Overview
June 30, 2012
| Key Company Contacts | ||
| Trevor P. Bond | President, Chief Executive Officer and a Director | |
| Mark J. DeCesaris | Managing Director, Chief Financial Officer and a Director | |
| Thomas E. Zacharias | Managing Director, Chief Operating Officer | |
| Susan C. Hyde | Managing Director, Director of Investor Relations | |
| Executive Offices | ||
| 50 Rockefeller Plaza | ||
| New York, NY 10020 | ||
| Tel: 1-800-WPCAREY or (212) 492-1100 | ||
| Fax: (212) 492-8922 | ||
| Web Site Address: www.wpcarey.com | ||
| Trading Symbol | ||
| NYSE: WPC | ||
| Analyst Coverage | ||
| Daniel P. Donlan | Janney Montgomery Scott LLC | |
| 215-665-6476 | ||
| ddonlan@janney.com | ||
Investing for the Long RunTM | 1
W. P. CAREY & CO. LLC
Key Operational Metrics (UNAUDITED)
As of June 30, 2012
| WPC LLC | CPA 15 | WPC INC | ||||||
|
AFFO/MFFO(b) ($m)(a) |
$135.8 |
$115.1 |

|
$256.7 | ||||
| Per share |
$3.33 | $0.88 | $3.72 | |||||
| Pro Rata Adjusted EBITDA ($m)(a) |
$219.2 | $187.0 | $391.4 | |||||
| Per share |
$5.37 | $1.42 | $5.67 | |||||
| Annualized Contractual Minimum Base Rent ($m) |
$84.7 | $219.4 | $304.1 | |||||
| Weighted Avg. Lease Term |
6.4 | 9.9 | 8.9 | |||||
| Number of Properties |
148 | 305 | 429 | |||||
| Square Footage (m) |
11.6 | 27.5 | 39.1 | |||||
| Weighted Avg. Occupancy |
94.4% | 99.1% | 97.6% | |||||
| Top 10 Tenant Concentration |
54.8% | 48.3% | 38.5% | |||||
| % of Investment Grade Tenants |
47.0% | 24.0% | 30.4% |
(a) Based on annualized YTD June 2012 results.
(b) Modified Funds from Operations (“MFFO”) is a non-GAAP measure used by CPA®:15 to evaluate its performance against other non-listed REITs.
Basis of Presentation
| • | “WPC LLC” and “CPA 15” represent the actual results for the six months ended June 30, 2012 or the current position as of June 30, 2012. |
| • | “WPC INC” represents the combined results for the six months ended June 30, 2012 or the pro forma position as of June 30, 2012, had the merger occurred on January 1, 2012. |
| • | All portfolio information contained herein is based on pro rata annualized contractual minimum based rent and pro rata square footage. |
Investing for the Long RunTM | 2
W. P. CAREY & CO. LLC
UNAUDITED PRO FORMA CONSOLIDATED BALANCE SHEET
This unaudited pro forma consolidated balance sheet should be read in conjunction with the unaudited balance sheet of W. P. Carey and CPA®:15 as of the six months ended June 30, 2012 and the audited balance sheet of W. P. Carey and CPA®:15 as of the year ended December 31, 2011, including the notes thereto.
The unaudited pro forma consolidated balance sheet (i) is based on available information and assumptions that management deems reasonable; (ii) is presented for informational purposes only; (iii) does not purport to be indicative of W. P. Carey Inc.’s future financial position; and (iv) does not purport to represent the financial position that would actually have occurred assuming completion of the activities and transactions described below had occurred on June 30, 2012, for the pro forma consolidated balance sheet.
The unaudited pro forma balance sheet as of June 30, 2012 reflects W. P. Carey Inc.’s results as if the following activities and transactions have been assumed to have occurred simultaneously as of such date:
| 1) | W. P. Carey will be converted to a REIT through a series of steps including the merger of W. P. Carey with and into W. P. Carey Inc., a wholly-owned subsidiary of W. P. Carey, with W. P. Carey Inc. surviving the merger. These transactions have no impact on the unaudited pro forma consolidated balance sheet. |
| 2) | W. P. Carey Inc. will merge with CPA®:15 and acquire the 92.1% equity interest in CPA®:15 it does not already own in exchange for cash and rights to newly issuable W. P. Carey Inc. shares in accordance with the exchange agreement. Under the terms of the proposed merger, CPA®:15 stockholders will receive $1.25 in cash and 0.2326 of W. P. Carey Inc.’s common stock for each CPA®:15 share at closing. The pro forma purchase price consideration of $1,449.2 million ($151.5 million of cash and $1,297.7 million in stock) is based on W. P. Carey’s share price at July 23, 2012 of $46.08. W. P. Carey’s share price is subject to change, which would impact the total consideration required to be paid by W. P. Carey in the Merger. A one cent variance in W. P. Carey’s stock price would change the stock consideration by approximately $0.3 million. |
| 3) | W. P. Carey Inc., as the acquirer, will account for the Merger as a business combination and the assets acquired and liabilities assumed of CPA®:15 will be recorded at their estimated fair values. |
| 4) | Simultaneous with the REIT Conversion, W. P. Carey is expected to draw down on a term loan of $175.0 million. This loan is expected to be used for the cash consideration to acquire the remaining equity interests of CPA®:15 and repay a portion of W. P. Carey’s pre-existing line of credit. The term loan is expected to have an effective interest rate of approximately 2.418% after consideration of the amortization of approximately $1.9 million in loan closing costs. In the event that W. P. Carey is not able to draw down on the term loan, it will draw on its existing line of credit to pay the cash component of the Merger Consideration. The interest rate under the existing line of credit is not materially different than the interest rate under the contemplated term loan. |
Investing for the Long RunTM | 3
W. P. CAREY & CO. LLC
W. P. CAREY INC. UNAUDITED PRO FORMA CONSOLIDATED BALANCE SHEET
As of June 30, 2012
($ in thousands)
| WP Carey & Co, LLC (A) |
Corporate Property Associates 15 Incorporated (A) |
Pro Forma Adjustments | W. P. Carey Inc. |
|||||||||||||||||||
| (Notes) | ||||||||||||||||||||||
| Assets |
||||||||||||||||||||||
| Investments in real estate: |
||||||||||||||||||||||
| Real estate, at cost |
$ 595,920 | $ 1,776,222 | $ (153,395) | B | $ 2,218,747 | |||||||||||||||||
| Operating real estate, at cost |
110,028 | - | - | 110,028 | ||||||||||||||||||
| Accumulated depreciation |
(127,139) | (311,711) | 311,711 | B | (127,139) | |||||||||||||||||
|
|
|
|
|
|
|
|
|
|||||||||||||||
| Net investments in properties |
578,809 | 1,464,511 | 158,316 | 2,201,636 | ||||||||||||||||||
| Net investments in direct financing leases |
57,872 | 278,876 | 77,406 | B | 414,154 | |||||||||||||||||
| Equity investments in real estate and CPA REITs |
552,552 | 191,297 | 48,785 | B | 651,403 | |||||||||||||||||
| (93,638) | B(viii) | |||||||||||||||||||||
| (47,593) | B(ix) | |||||||||||||||||||||
|
|
|
|
|
|
|
|
|
|||||||||||||||
| Net investments in real estate |
1,189,233 | 1,934,684 | 143,276 | 3,267,193 | ||||||||||||||||||
| Cash and cash equivalents |
39,800 | 190,515 | - | B | 138,946 | |||||||||||||||||
| 173,138 | E | |||||||||||||||||||||
| (151,507) | E | |||||||||||||||||||||
| (113,000) | E | |||||||||||||||||||||
| Due from affiliates |
33,908 | - | (2,550) | C | 31,358 | |||||||||||||||||
| Intangible assets and goodwill, net |
121,402 | 132,445 | 559,493 | B | 910,428 | |||||||||||||||||
| 97,088 | B(iii) | |||||||||||||||||||||
| Other assets, net |
54,272 | 119,220 | (42,679) | B(v) | 132,675 | |||||||||||||||||
| 1,862 | E | |||||||||||||||||||||
|
|
|
|
|
|
|
|
|
|||||||||||||||
| Total assets |
$ 1,438,615 | $ 2,376,864 | $ 665,121 | $ 4,480,600 | ||||||||||||||||||
|
|
|
|
|
|
|
|
|
|||||||||||||||
| Liabilities and Equity |
||||||||||||||||||||||
| Liabilities: |
||||||||||||||||||||||
| Non-recourse and limited-recourse debt |
$ 346,532 | $ 1,221,169 | $ 23,210 | B | $ 1,590,911 | |||||||||||||||||
| Line of credit |
233,160 | - | 175,000 | E | 295,160 | |||||||||||||||||
| (113,000) | E | |||||||||||||||||||||
| Accounts payable, accrued expenses and other liabilities |
62,948 | 39,514 | - | B | 122,905 | |||||||||||||||||
| 20,443 | D | |||||||||||||||||||||
| Prepaid and deferred rental income and security deposits |
- | 56,043 | 39,027 | B(ii) | 91,190 | |||||||||||||||||
| (3,880) | B(v) | |||||||||||||||||||||
| Due to affiliates |
- | 14,480 | (14,480) | B(iv) | - | |||||||||||||||||
| Income taxes, net |
37,652 | - | 1,875 | G | 39,527 | |||||||||||||||||
| Distributions payable |
22,960 | 23,990 | - | B | 45,055 | |||||||||||||||||
| (1,895) | C | |||||||||||||||||||||
|
|
|
|
|
|
|
|
|
|||||||||||||||
| Total liabilities |
703,252 | 1,355,196 | 126,300 | 2,184,748 | ||||||||||||||||||
|
|
|
|
|
|
|
|||||||||||||||||
| Redeemable noncontrolling interest and common stock |
6,788 | - | 85,000 | F | 91,788 | |||||||||||||||||
|
|
|
|
|
|
|
|
|
|||||||||||||||
| Equity: |
||||||||||||||||||||||
| Common stock |
798,036 | 148 | (148) | F | 713,036 | |||||||||||||||||
| (85,000) | F | |||||||||||||||||||||
| Additional paid-in capital |
- | 1,383,197 | (1,383,197) | F | 1,297,697 | |||||||||||||||||
| 1,297,697 | A | |||||||||||||||||||||
| Distributions in excess of accumulated earnings |
(99,653) | (362,079) | 362,079 | F | (92,037) | |||||||||||||||||
| 22,315 | B(viii) | |||||||||||||||||||||
| 8,271 | B(ix) | |||||||||||||||||||||
| (20,443) | D | |||||||||||||||||||||
| (652) | C | |||||||||||||||||||||
| (1,875) | G | |||||||||||||||||||||
| Deferred compensation obligation |
7,691 | - | - | 7,691 | ||||||||||||||||||
| Accumulated other comprehensive loss |
(11,096) | (20,658) | 20,658 | F | (11,096) | |||||||||||||||||
| Less treasury stock |
- | (176,031) | 176,031 | F | - | |||||||||||||||||
|
|
|
|
|
|
|
|
|
|||||||||||||||
| Total stockholders’ equity |
694,978 | 824,577 | 395,736 | 1,915,291 | ||||||||||||||||||
|
|
|
|
|
|
|
|||||||||||||||||
| Noncontrolling interests |
33,597 | 197,091 | 58,085 | B | 288,773 | |||||||||||||||||
|
|
|
|
|
|
|
|
|
|||||||||||||||
| Total equity |
728,575 | 1,021,668 | 453,821 | 2,204,064 | ||||||||||||||||||
|
|
|
|
|
|
|
|
|
|||||||||||||||
| Total liabilities and equity |
$ 1,438,615 | $ 2,376,864 | $ 665,121 | $ 4,480,600 | ||||||||||||||||||
|
|
|
|
|
|
|
|
|
|||||||||||||||
Investing for the Long RunTM | 4
NOTES TO UNAUDITED PRO FORMA CONSOLIDATED BALANCE SHEET
| A. | Amounts derived from the unaudited consolidated financial statements of W. P. Carey and CPA®:15 as of the six months ended June 30, 2012. The combined purchase price consideration of $151.5 million in cash and $1,297.7 million in W. P. Carey Inc. common stock, excludes the pre-existing equity ownership of W. P. Carey in CPA®:15 of approximately 7.9% as of June 30, 2012. |
| B. | The allocation of the purchase price consideration shown below is based on preliminary estimates and is subject to change based on the final determination of the fair value of CPA®:15’s assets acquired and liabilities assumed and W. P. Carey’s share price on settlement date. |
| CPA®:15 Historical
(A) |
Pro
Forma Adjustments |
Fair Value of CPA®:15 Liabilities Assumed |
||||||||||
|
|
|
|||||||||||
| Assets |
||||||||||||
| Real estate (i) |
$ 1,776,222 | $ (153,395) | $ 1,622,827 | |||||||||
| Accumulated depreciation (i) |
(311,711) | 311,711 | - | |||||||||
| Net investments in direct financing leases (i) |
278,876 | 77,406 | 356,282 | |||||||||
| Equity investments in real estate and CPA REITs (i) |
191,297 | 48,785 | 240,082 | |||||||||
| Cash and cash equivalents |
190,515 | - | 190,515 | |||||||||
| Intangible assets (ii) |
132,445 | 559,493 | 691,938 | |||||||||
| Goodwill (iii) |
- | 97,088 | 97,088 | |||||||||
| Other assets (v) |
119,220 | (42,679) | 76,541 | |||||||||
|
|
|
|||||||||||
| Total assets |
$ 2,376,864 | 898,409 | $ 3,275,273 | |||||||||
| Liabilities and Equity |
||||||||||||
| Non-recourse and limited-recourse debt (vi) |
1,221,169 | 23,210 | 1,244,379 | |||||||||
| Accounts payable, accrued expenses and other Liabilities |
39,514 | - | 39,514 | |||||||||
| Prepaid and deferred rental income and security deposits (iia), (v) |
56,043 | 35,147 | 91,190 | |||||||||
| Due to affiliates (iv) |
14,480 | (14,480) | - | |||||||||
| Distributions payable |
23,990 | - | 23,990 | |||||||||
|
|
|
|||||||||||
| Total Liabilities |
1,355,196 | 43,877 | 1,399,073 | |||||||||
|
|
|
|||||||||||
| Noncontrolling interest (i) |
197,091 | 58,085 | 255,176 | |||||||||
|
|
|
|||||||||||
| Total Equity |
$ 824,577 | $ 796,447 | $ 1,621,024 | |||||||||
|
|
|
|||||||||||
| Non-controlled ownership interest at fair value (vii) |
$1,449,207 | |||||||||||
| Existing ownership interest at fair value (viii) |
115,953 | |||||||||||
| Existing jointly held interests at fair value (ix) |
55,864 | |||||||||||
|
|
|
|||||||||||
| Total Equity |
$1,621,024 | |||||||||||
|
|
|
|||||||||||
| i. | Reflects adjustments to record assets acquired and liabilities assumed at their estimated fair value. | |
| ii. | Intangible assets identified in the transaction have been allocated as follows: |
| Historical cost - net |
Fair Value | Net Adjustment | ||||||||||
| In-place lease/tenant relationships |
$103,529 | $ 418,955 | $ 315,426 | |||||||||
| Above-market leases |
28,916 | 272,983 | 244,067 | |||||||||
|
|
|
|
|
|
|
|||||||
| Total intangibles |
$ 132,445 | $ 691,938 | $ 559,493 | |||||||||
| Below-market leases (a) |
$ 11,306 | $ 50,333 | $ 39,027 | |||||||||
| (a) | Below-market lease intangibles are included in Prepaid and deferred rental income and security deposits. |
| iii. | Reflects the difference between the estimated purchase price and estimated fair value of the assets acquired and liabilities assumed. A one cent variance in W. P. Carey’s stock price would change this amount by approximately $0.3 million. |
Investing for the Long RunTM | 5
| iv. | Reflects an adjustment to eliminate the balances CPA®:15 has with W. P. Carey, as all such amounts would have been eliminated in consolidation had the merger occurred on June 30, 2012. | |
| v. | Reflects an adjustment to eliminate assets of unamortized straight-line rents ($37.1 million) and deferred financing costs ($5.5 million) within Other assets. A liability for deferred rent of $3.9 million is eliminated from Prepaid and deferred rental income and security deposits. | |
| vi. | Reflects an adjustment to record mortgage notes assumed at their estimated fair value. | |
| vii. | Reflects the cost to acquire the 92.1% equity interest in CPA®:15 that W.P. Carey does not already own. | |
| viii. | Prior to the Merger, W. P. Carey held an equity interest in CPA®:15 of approximately 7.9% which had a carrying value of $93.6 million. This adjustment reflects the acquisition of a controlling interest resulting in a gain of $22.3 million as that equity interest was fair valued at $115.9 million. | |
| ix. | Prior to the conversion of W.P. Carey to a real estate investment trust (“REIT”), W. P. Carey had non-controlling interests in four joint ventures and a tenancy-in-common property majority owned by CPA®:15. This adjustment eliminates the carrying value of W. P. Carey’s prior interests ($47.6 million). The acquisition of the controlling interest was recorded at its fair value of $55.9 million, resulting in a gain of $8.3 million. | |
| C. | Reflects the elimination of W. P. Carey’s balances with CPA®:15 as of June 30, 2012. | |
| D. | Included in Accounts payable, accrued expenses and other liabilities is a $20.4 million accrual for estimated costs to be incurred with the merger of CPA®:15 with and into one of W. P. Carey’s subsidiaries, W.P. Carey Inc. (the “Merger”) and the merger of W.P. Carey with and into W.P. Carey Inc. (the “REIT Conversion”). | |
| E. | Simultaneous with the Merger, W. P. Carey is expected to draw down on term loan of $175.0 million, net of $1.9 million in loan closing costs. The term loan is expected to be used for the cash consideration to acquire the outstanding equity interests of CPA®:15 ($151.5 million). Additionally, approximately $113.0 million of the outstanding cash of the consolidated entity will be used to repay a portion of W. P. Carey’s pre-existing line of credit. The term loan is expected to have a stated interest rate of 2.00% and an effective interest rate of approximately 2.37% after consideration of the loan closing costs. In the event that W.P. Carey is not able to draw down on the term loan, it will draw on its existing line of credit to pay the cash component of the Merger consideration. The interest rate under the existing line of credit is not materially different than the interest rate under the contemplated term loan. | |
| F. | Reflects elimination of CPA®:15’s acquired equity. In July 2012, we entered into a number of agreements with the Estate of Wm. Polk Carey (the “Estate”), our Chairman and founder who passed away on January 2, 2012, including a voting agreement (the “Voting Agreement”) pursuant to which the Estate and W. P. Carey & Co., Inc., a wholly-owned corporation of the Estate (“HoldCo” and together with the Estate, the “Estate Shareholders”) have the right but not the obligation to sell to W. P. Carey and W. P. Carey Inc. up to an aggregate amount of Eighty-Five Million Dollars ($85,000,000) of W. P. Carey listed shares and W. P. Carey Inc. common stock owned by the Estate Shareholders (“Stock Repurchase”). The acquisition of the shares and use of cash has not been reflected in the unaudited pro forma financial information. W.P. Carey has reclassified $85,000,000 of its permanent equity to redeemable non-controlling interest and common stock within the pro forma consolidated balance sheet to reflect its potential cash obligation that is outside of its control. W.P. Carey has not recognized a liability for the Stock Repurchase as the fair value was not material based upon the terms of the agreement. | |
| G. | The $1.9 million adjustment to distributions in excess of accumulated earnings reflects the tax expense related to the recognition of deferred revenue as of June 30, 2012. | |
Investing for the Long RunTM | 6
W. P. CAREY & CO. LLC
UNAUDITED COMBINED INCOME STATEMENT
(HISTORICAL BASIS)
For the Six Months Ended June 30, 2012
(in thousands)
| Historical WPC LLC(a) |
Historical CPA ®15(b) |
Adjustments | Notes | Combined Company on historical basis |
||||||||||||||
| Revenues |
||||||||||||||||||
| Asset management revenue |
31,238 | - | (12,419) | c | 18,819 | |||||||||||||
| Structuring revenue |
11,260 | - | - | 11,260 | ||||||||||||||
| Wholesaling revenue |
7,867 | - | - | 7,867 | ||||||||||||||
| Reimbursed costs from affiliates |
39,221 | - | (1,998) | c | 37,223 | |||||||||||||
| Lease revenues |
34,859 | 98,708 | 1,908 | d | 135,475 | |||||||||||||
| Other real estate income |
12,984 | - | - | 12,984 | ||||||||||||||
| Interest income from direct financing leases |
- | 14,471 | - | 14,471 | ||||||||||||||
| Other operating income |
- | 7,962 | - | 7,962 | ||||||||||||||
| Total revenues |
137,429 | 121,141 | (12,509) | 246,061 | ||||||||||||||
|
Operating Expenses |
||||||||||||||||||
| General and administrative |
(53,491) | (7,104) | 8,553 | c,e | (52,042) | |||||||||||||
| Reimbursable costs |
(39,221) | - | - | (39,221) | ||||||||||||||
| Depreciation and amortization |
(13,528) | (24,659) | (352) | d | (38,539) | |||||||||||||
| Property expenses |
(5,989) | (18,060) | 12,418 | c | (11,631) | |||||||||||||
| Other real estate expenses |
(4,930) | - | - | (4,930) | ||||||||||||||
| Impairment charges |
(3,660) | - | - | (3,660) | ||||||||||||||
| Total operating expenses |
(120,819) | (49,823) | 20,619 | (150,023) | ||||||||||||||
|
Other Income and Expenses |
||||||||||||||||||
| Other interest income |
658 | 1,483 | 20 | 2,161 | ||||||||||||||
| Income from equity investments in real estate and the REITs |
42,331 | 9,938 | (22,022) | d,f | 30,247 | |||||||||||||
| Other income and (expenses) |
1,524 | 3,754 | - | 5,278 | ||||||||||||||
| Interest expense |
(14,591) | (36,615) | (453) | (51,659) | ||||||||||||||
| Total other income and expenses |
29,922 | (21,440) | (22,455) | (13,973) | ||||||||||||||
| Income from continuing operations before income taxes |
46,532 | 49,878 | (14,345) | 82,065 | ||||||||||||||
|
Benefit from (provision for) income taxes |
187 | (1,535) | 6,354 | 5,006 | ||||||||||||||
| Income from continuing operations |
46,719 | 48,343 | (7,991) | 87,071 | ||||||||||||||
|
Income / (loss) from discontinued operations |
(3,820) | 33,713 | - | 29,893 | ||||||||||||||
| Net income |
42,899 | 82,056 | (7,991) | 116,964 | ||||||||||||||
|
Add/Less: Net loss/(income) attributable to non-controlling interests |
1,058 | (11,728) | 1,593 | g | (9,077) | |||||||||||||
| Add/Less: Net loss/(income) attributable to redeemable noncontrolling interests |
110 | - | - | 110 | ||||||||||||||
| Net income attributable to W. P. Carey Members |
44,067 | 70,328 | (6,398) | 107,997 | ||||||||||||||
| Basic earnings per share: |
||||||||||||||||||
| Income from continuing operations attributable to W. P. Carey Members |
1.19 | 0.28 | 1.14 | |||||||||||||||
| Diluted earnings per share |
||||||||||||||||||
| Income from continuing operations attributable to W. P. Carey Members |
1.17 | 0.28 | 1.13 | |||||||||||||||
| (a) | Represents WPC LLC’s income statement for the six months ended June 30, 2012 on a historical basis. |
| (b) | Represents CPA®:15’s income statement for the six months ended June 30, 2012 on a historical basis. |
| (c) | To eliminate inter-company activity between WPC LLC and CPA®:15, specifically asset management revenues and the offsetting property expenses, as well as reimbursed costs. |
| (d) | To record Hologic, formerly recorded as an equity investment by each Merger party, as a consolidated entity. |
| (e) | To reverse $6.1 million of merger costs. |
| (f) | To eliminate WPC LLC’s equity investments in CPA®:15 and properties previously consolidated by CPA®:15. |
| (g) | To reverse the income recorded in noncontrolling interest on CPA®:15’s books related to the four joint ventures that are now consolidated. |
Investing for the Long RunTM | 7
W. P. CAREY & CO. LLC (a)
Reconciliation of Net Income to Funds from Operations – as Adjusted (AFFO) (Unaudited)
(in thousands, except share and per share amounts)
| Three Months Ended | Six Months Ended June 30, | |||||||||||||||||||||||||||
| June 30, 2012 | March 31, 2012 | December 31, 2011 | September 30, 2011 | June 30, 2011 | 2012 | 2011 | ||||||||||||||||||||||
| Investment Management |
||||||||||||||||||||||||||||
| Net Income from investment management attributable to W. P. Carey members(b) |
$ | 2,153 | $ | 2,360 | $ | 3,705 | $ | 9,134 | $ | 28,601 | $ | 4,513 | $ | 39,963 | ||||||||||||||
|
|
|
|
|
|
|
|
|
|
|
|
|
|
|
|||||||||||||||
| FFO - as defined by NAREIT(c) |
2,153 | 2,360 | 3,705 | 9,134 | 28,601 | 4,513 | 39,963 | |||||||||||||||||||||
|
|
|
|
|
|
|
|
|
|
|
|
|
|
|
|||||||||||||||
| Adjustments: |
||||||||||||||||||||||||||||
| Amortization and other non-cash charges |
(3,944) | 7,561 | 3,297 | 4,953 | 17,583 | 3,617 | 25,056 | |||||||||||||||||||||
| Realized gains on foreign currency, derivatives and other |
(23) | - | - | - | - | (23) | - | |||||||||||||||||||||
| Amortization of deferred financing costs |
286 | 283 | - | - | - | 570 | - | |||||||||||||||||||||
| Merger expenses |
1,257 | 837 | - | - | - | 2,094 | - | |||||||||||||||||||||
| Proportionate share of adjustments to equity in net income of partially owned entities to arrive at AFFO: |
||||||||||||||||||||||||||||
| AFFO adjustments to equity earnings from equity investments |
- | - | - | - | - | - | - | |||||||||||||||||||||
|
|
|
|
|
|
|
|
|
|
|
|
|
|
|
|||||||||||||||
| Total adjustments |
(2,424) | 8,681 | 3,297 | 4,953 | 17,583 | 6,258 | 25,056 | |||||||||||||||||||||
|
|
|
|
|
|
|
|
|
|
|
|
|
|
|
|||||||||||||||
| AFFO - Investment Management |
$ | (271) | $ | 11,041 | $ | 7,002 | $ | 14,087 | $ | 46,184 | $ | 10,771 | $ | 65,019 | ||||||||||||||
|
|
|
|
|
|
|
|
|
|
|
|
|
|
|
|||||||||||||||
| Real Estate Ownership |
||||||||||||||||||||||||||||
| Net Income from real estate ownership attributable to W. P. Carey members(b) |
$ | 29,624 | $ | 9,930 | $ | 5,386 | $ | 16,068 | $ | 52,842 | $ | 39,554 | $ | 64,823 | ||||||||||||||
| Adjustments: |
||||||||||||||||||||||||||||
| Depreciation and amortization of real property |
5,673 | 6,147 | 8,415 | 6,194 | 6,240 | 11,820 | 10,715 | |||||||||||||||||||||
| Impairment charges |
1,003 | 5,724 | 5,498 | 4,934 | 41 | 6,728 | 41 | |||||||||||||||||||||
| (Gain) loss on sale of real estate, net |
(1,686) | 181 | 3,655 | 396 | 121 | (1,505) | (660) | |||||||||||||||||||||
| Proportionate share of adjustments to equity in net income of partially-owned entities to arrive at FFO: |
||||||||||||||||||||||||||||
| Depreciation and amortization of real property |
730 | 898 | 1,208 | 1,173 | 1,328 | 1,628 | 2,876 | |||||||||||||||||||||
| Impairment charges(c) |
- | - | - | - | - | - | 1,090 | |||||||||||||||||||||
| (Gain) loss on sale of real estate, net |
(15,557) | 142 | - | - | 34 | (15,415) | 34 | |||||||||||||||||||||
| Proportionate share of adjustments for noncontrolling interests to arrive at FFO |
(434) | (434) | (508) | (1,157) | (123) | (868) | (319) | |||||||||||||||||||||
|
|
|
|
|
|
|
|
|
|
|
|
|
|
|
|||||||||||||||
| Total adjustments |
(10,271) | 12,658 | 18,268 | 11,540 | 7,641 | 2,388 | 13,777 | |||||||||||||||||||||
|
|
|
|
|
|
|
|
|
|
|
|
|
|
|
|||||||||||||||
| FFO - as defined by NAREIT(c) |
19,353 | 22,588 | 23,654 | 27,608 | 60,483 | 41,942 | 78,600 | |||||||||||||||||||||
|
|
|
|
|
|
|
|
|
|
|
|
|
|
|
|||||||||||||||
Investing for the Long RunTM | 8
| Adjustments: |
||||||||||||||||||||||||||||
| Gain on change in control of interests (d) |
- | - | - | - | (27,859) | - | (27,859) | |||||||||||||||||||||
| Gain on deconsolidation of a subsidiary |
- | - | - | (1,008) | - | - | - | |||||||||||||||||||||
| Other (gains) losses, net |
- | - | (1,118) | 135 | - | - | - | |||||||||||||||||||||
| Other depreciation, amortization and non-cash charges |
(88) | (669) | 853 | 168 | (2,167) | (757) | (2,802) | |||||||||||||||||||||
| Realized losses on foreign currency, derivatives and other |
542 | - | - | - | - | 542 | - | |||||||||||||||||||||
| Amortization of deferred financing costs |
402 | 464 | - | - | - | 866 | - | |||||||||||||||||||||
| Straight-line and other rent adjustments |
(883) | (1,115) | (1,804) | (1,014) | (1,020) | (1,998) | (1,437) | |||||||||||||||||||||
| Above-market rent intangible lease amortization, net |
111 | - | - | - | - | 111 | - | |||||||||||||||||||||
| Merger expenses |
1,359 | 1,266 | - | - | - | 2,625 | - | |||||||||||||||||||||
| Proportionate share of adjustments to equity in net income of partially owned entities to arrive at AFFO: |
||||||||||||||||||||||||||||
| Straight-line and other rent adjustments |
(363) | (413) | (414) | (463) | (142) | (776) | (764) | |||||||||||||||||||||
| Below-market rent intangible lease amortization, net |
(3) | - | - | - | - | (3) | - | |||||||||||||||||||||
| AFFO adjustments to equity earnings from equity investments |
7,687 | 6,926 | 6,982 | 1,978 | (2,508) | 14,613 | 1,270 | |||||||||||||||||||||
| Proportionate share of adjustments for noncontrolling interests to arrive at AFFO |
(25) | (19) | 54 | 59 | 73 | (44) | 159 | |||||||||||||||||||||
|
|
|
|
|
|
|
|
|
|
|
|
|
|
|
|||||||||||||||
| Total adjustments |
8,739 | 6,440 | 4,553 | (145) | (33,623) | 15,179 | (31,433) | |||||||||||||||||||||
|
|
|
|
|
|
|
|
|
|
|
|
|
|
|
|||||||||||||||
| AFFO - Real Estate Ownership |
$ | 28,092 | $ | 29,028 | $ | 28,207 | $ | 27,463 | $ | 26,860 | $ | 57,121 | $ | 47,167 | ||||||||||||||
|
|
|
|
|
|
|
|
|
|
|
|
|
|
|
|||||||||||||||
| Total Company |
||||||||||||||||||||||||||||
| FFO - as defined by NAREIT |
$ | 21,506 | $ | 24,948 | $ | 27,359 | $ | 36,742 | $ | 89,084 | $ | 46,455 | $ | 118,563 | ||||||||||||||
|
|
|
|
|
|
|
|
|
|
|
|
|
|
|
|||||||||||||||
| FFO - as defined by NAREIT (diluted) |
$ | 0.53 | $ | 0.62 | $ | 0.68 | $ | 0.91 | $ | 2.21 | $ | 1.14 | $ | 2.95 | ||||||||||||||
|
|
|
|
|
|
|
|
|
|
|
|
|
|
|
|||||||||||||||
| AFFO |
$ | 27,821 | $ | 40,069 | $ | 35,209 | $ | 41,550 | $ | 73,044 | $ | 67,892 | $ | 112,186 | ||||||||||||||
|
|
|
|
|
|
|
|
|
|
|
|
|
|
|
|||||||||||||||
| AFFO per share (diluted) |
$ | 0.68 | $ | 0.99 | $ | 0.88 | $ | 1.03 | $ | 1.82 | $ | 1.66 | $ | 2.79 | ||||||||||||||
|
|
|
|
|
|
|
|
|
|
|
|
|
|
|
|||||||||||||||
| Diluted weighted average shares outstanding |
40,757,055 | 40,487,652 | 40,152,444 | 40,404,520 | 40,243,548 | 40,828,646 | 40,192,418 | |||||||||||||||||||||
|
|
|
|
|
|
|
|
|
|
|
|
|
|
|
|||||||||||||||
| (a) | Represents financial information of WPC LLC as filed on August 7, 2012 in its Form 8-K disclosing Supplemental Unaudited Operating and Financial Data for the six months ended June 30, 2012. |
| (b) | Effective April 1, 2012, we include cash distributions and deferred revenue received and earned from the operating partnerships of CPA®:16 – Global, CPA®:17 – Global and CWI in our Real Estate Ownership segment. Results of operations for the prior year periods have been reclassified to conform to the current period presentation. Additionally, during the third quarter of 2011, CPA®:16 – Global finalized its assessment of the fair values of the assets acquired and liabilities assumed in connection with the CPA®:14/16 merger and made certain adjustments during that quarter. Our proportionate share of the adjustments before income taxes was approximately $2.6 million. In accordance with current accounting guidance, we have retrospectively adjusted our results of operations in our Real Estate Ownership segment for the three and six months ended June 30, 2011 to include such adjustments. |
Investing for the Long RunTM | 9
| (c) | The SEC Staff has recently advised that they take no position on the inclusion or exclusion of impairment write-downs in arriving at FFO. Since 2003, the National Association of Real Estate Investment Trusts (“NAREIT”) has taken the position that the exclusion of impairment charges is consistent with its definition of FFO. Accordingly, we have revised our computation of FFO to exclude impairment charges, if any, in arriving at FFO for all periods presented. |
| (d) | Represents gain recognized on purchase of the remaining interests in two investments from CPA®:14, which we had previously accounted for under the equity method. In connection with purchasing these properties, we recognized a net gain of $27.9 million during the three and six months ended June 30, 2011 to adjust the carrying value of our existing interests in these investments to their estimated fair values. |
Non-GAAP Financial Disclosure – AFFO
FFO is a non-GAAP measure defined by NAREIT. NAREIT defines FFO as net income or loss (as computed in accordance with GAAP) excluding: depreciation and amortization expense from real estate assets, impairment charges on real estate, gains or losses from sales of depreciated real estate assets and extraordinary items; however, FFO related to assets held for sale, sold or otherwise transferred and included in the results of discontinued operations are included. These adjustments also incorporate the pro rata share of unconsolidated subsidiaries. FFO is used by management, investors and analysts to facilitate meaningful comparisons of operating performance between periods and among our peers. Although NAREIT has published this definition of FFO, companies often modify this definition as they seek to provide financial measures that meaningfully reflect their distinctive operations.
We modify the NAREIT computation of FFO to include other adjustments to GAAP net income to adjust for certain non-cash charges such as amortization of intangibles, deferred income tax benefits and expenses, straight-line rents, stock compensation, gains or losses from extinguishment of debt and deconsolidation of subsidiaries and unrealized foreign currency exchange gains and losses. We refer to our modified definition of FFO as AFFO. We exclude these items from GAAP net income as they are not the primary drivers in our decision making process. Our assessment of our operations is focused on long-term sustainability and not on such non-cash items, which may cause short-term fluctuations in net income but have no impact on cash flows, and we therefore use AFFO as one measure of our operating performance when we formulate corporate goals, evaluate the effectiveness of our strategies, and determine executive compensation. We believe that AFFO is a useful supplemental measure for investors to consider because it will help them to better assess the sustainability of our operating performance without the potentially distorting impact of these short-term fluctuations. However, there are limits on the usefulness of AFFO to investors. For example, impairment charges and unrealized foreign currency losses that we exclude may become actual realized losses upon the ultimate disposition of the properties in the form of lower cash proceeds or other considerations.
Investing for the Long RunTM | 10
W. P. CAREY & CO. LLC
W. P. Carey Inc. Consolidated Reconciliation of Net Income to Funds from Operations – as Adjusted (AFFO) (Unaudited)
(in thousands, except share and per share amounts)
| WPC INC Shares | 30-Jun-12 | |||||||||||
| WPC LLC 2012 Weighted Avg. Standalone Shares (per 10-Q)(a) |
40,828,646 | |||||||||||
|
CPA®:15 2012 Weighted Avg. Standalone Shares (per 10-Q)(b) |
131,657,978 | |||||||||||
| Exchange Ratio |
0.2326x | |||||||||||
| Shares Issued |
28,192,415 | |||||||||||
| WPC INC Shares Outstanding |
69,021,061 | |||||||||||
| YTD Jun-12 $ Amount |
$ / Share Impact |
Cumulative Acc / (Dil) |
YTD Jun-12 AFFO / |
Annualized AFFO / | ||||||||
| Combined AFFO Calculation |
||||||||||||
| WPC LLC AFFO(c) |
67,892 | 1.66 | 1.66 | 3.33 | ||||||||
| Primary Accretion / (Dilution) Drivers |
||||||||||||
| 1. Dilutive Impact of New Share Issuance |
- | (0.68) | (0.68) | 0.98 | 1.97 | |||||||
| 2. CPA®:15 Contribution to WPC INC AFFO(d) |
57,367 | 0.83 | 0.15 | 1.81 | 3.63 | |||||||
| 3. (+) Provision for income taxes(e) |
Tax Savings from foregone Asset Mgmt Revenues |
6,354 | 0.09 | 0.24 | 1.91 | 3.81 | ||||||
| 4. (+) Deferred taxes(e) |
Lost taxes deferred on CPA®:15 mgmt fees paid in shares |
2,200 | 0.03 | 0.28 | 1.94 | 3.88 | ||||||
| 5. (+) Distributions from Equity Investments in CPA® REITS (f) |
Foregone AFFO proceeds from WPC LLC’s CPA®:15 investment |
(4,540) | (0.07) | 0.21 | 1.87 | 3.75 | ||||||
| Adjustments for Primary Accretion / (Dilution) Drivers |
61,381 | 0.21 | 0.21 | 1.87 | 3.75 | |||||||
| Acquisition Debt Interest Expense Impact |
||||||||||||
| 6. (-) Interest expense(g) |
Acquisition Debt Interest Expense |
(944) | (0.01) | 0.20 | 1.86 | 3.72 | ||||||
| Adjustments for Acquisition Debt Interest Expense Impact |
(944) | (0.01) | 0.20 | 1.86 | 3.72 | |||||||
| Elimination of Asset Management Fees |
||||||||||||
| 7. (-) Asset Management Revenue(h) |
WPC LLC Fee Revenues no longer received from CPA®:15 |
(12,419) | (0.18) | 0.02 | 1.68 | 3.36 | ||||||
| 8. (+) Property expenses(h) |
CPA®:15 Mgmt Fee Expense no longer paid to WPC LLC |
12,419 | 0.18 | 0.20 | 1.86 | 3.72 | ||||||
| Adjustments for Elimination of Management Fees |
- | - | 0.20 | 1.86 | 3.72 | |||||||
| WPC INC Consolidated AFFO |
128,329 | 1.86 | 0.20 | 1.86 | 3.72 | |||||||
| (a) | Per WPC LLC’s Form 10-Q for the period ended June 30, 2012. |
| (b) | Per CPA®:15’s Form 10-Q for the period ended June 30, 2012. |
| (c) | See Pages 9 and 10 for a reconciliation of WPC LLC’s Net Income for the six months ended June 30, 2012 to AFFO, as included in its Form 8-K disclosing Supplemental Unaudited Operating and Financial Data for the period ended June 30, 2012 as filed with the SEC on August 7, 2012. |
Investing for the Long RunTM | 11
| (d) | CPA®:15’s contribution to WPC Inc’s AFFO represents MFFO of $57.5 million as filed in CPA®:15’s Form 10-Q for the period ended June 30, 2012, adjusted by $0.2 million related to acquisition expenses and accretion of discounts and amortization of premiums on debt investments. See Appendix A for a reconciliation of CPA®:15’s Net Income Attributable to CPA®:15 Stockholders for the six months ended June 30, 2012 to MFFO, as disclosed in its Form 10-Q for the period ended June 30, 2012. |
| (e) | As a result of the proposed Merger of CPA®:15 and WPC LLC, asset management and other taxable revenues have been eliminated. The adjustments of $6.4 million and $2.2 million for the six months ended June 30, 2012 reflect tax benefits related to the elimination of these transactions. |
| (f) | Reflects adjustment to eliminate the impact on AFFO of distributions from WPC LLC’s equity investment in CPA®:15 pursuant to the merger. |
| (g) | Reflects an increase in interest expense of $0.9 million for the six months ended June 30, 2012 from the $175 million new line of credit and expected repayment of $113 million of the pre-existing line of credit. In the event that WPC LLC does not draw down on the term loan, it will draw on its existing line of credit to pay the cash component of the merger consideration. The interest rate under the existing line of credit is not materially different than the interest rate under the contemplated term loan. |
| (h) | Reflects adjustments to eliminate WPC LLC’s ownership of 7.9% in CPA®:15. |
Investing for the Long RunTM | 12
W. P. CAREY & CO. LLC (a)
Reconciliation of Net Income to EBITDA (Unaudited)
(in thousands, except share and per share amounts)
| Three Months Ended | Six Months Ended June 30, | |||||||||||||||||||||||||||
| June 30, 2012 | March 31, 2012 | December 31, 2011 | September 30, 2011 | June 30, 2011 | 2012 | 2011 | ||||||||||||||||||||||
| Investment Management |
||||||||||||||||||||||||||||
| Net income from investment management attributable to W. P. Carey members(b) |
$ | 2,153 | $ | 2,360 | $ | 3,705 | $ | 9,134 | $ | 28,601 | $ | 4,513 | $ | 39,963 | ||||||||||||||
| Adjustments: |
||||||||||||||||||||||||||||
| (Benefit from) provision for income taxes |
(2,644) | 622 | (3,540) | 5,075 | 26,056 | (2,022) | 33,436 | |||||||||||||||||||||
| Depreciation and amortization |
942 | 938 | 976 | 819 | 867 | 1,880 | 1,669 | |||||||||||||||||||||
|
|
|
|
|
|
|
|
|
|
|
|
|
|
|
|||||||||||||||
| EBITDA — investment management |
$ | 451 | $ | 3,920 | $ | 1,141 | $ | 15,028 | $ | 55,524 | $ | 4,371 | $ | 75,068 | ||||||||||||||
|
|
|
|
|
|
|
|
|
|
|
|
|
|
|
|||||||||||||||
| EBITDA per share (diluted) |
$ | 0.01 | $ | 0.10 | $ | 0.03 | $ | 0.37 | $ | 1.38 | $ | 0.11 | $ | 1.87 | ||||||||||||||
|
|
|
|
|
|
|
|
|
|
|
|
|
|
|
|||||||||||||||
| Real Estate Ownership |
||||||||||||||||||||||||||||
| Net income from real estate ownership attributable to W. P. Carey members(b) |
$ | 29,624 | $ | 9,930 | $ | 5,386 | $ | 16,068 | $ | 52,842 | $ | 39,554 | $ | 64,823 | ||||||||||||||
| Adjustments: |
||||||||||||||||||||||||||||
| Interest expense |
7,246 | 7,345 | 6,260 | 5,989 | 5,355 | 14,591 | 9,671 | |||||||||||||||||||||
| Provision for (benefit from) income taxes |
762 | 1,073 | 2,227 | 856 | (1,026) | 1,835 | (839) | |||||||||||||||||||||
| Depreciation and amortization |
5,791 | 5,857 | 8,416 | 6,361 | 5,024 | 11,648 | 8,832 | |||||||||||||||||||||
| Reconciling items attributable to discontinued operations |
101 | 515 | 199 | 346 | 1,474 | 615 | 2,510 | |||||||||||||||||||||
|
|
|
|
|
|
|
|
|
|
|
|
|
|
|
|||||||||||||||
| EBITDA — real estate ownership |
$ | 43,524 | $ | 24,720 | $ | 22,488 | $ | 29,620 | $ | 63,669 | $ | 68,243 | $ | 84,997 | ||||||||||||||
|
|
|
|
|
|
|
|
|
|
|
|
|
|
|
|||||||||||||||
| EBITDA per share (diluted) |
$ | 1.07 | $ | 0.61 | $ | 0.56 | $ | 0.74 | $ | 1.58 | $ | 1.67 | $ | 2.11 | ||||||||||||||
|
|
|
|
|
|
|
|
|
|
|
|
|
|
|
|||||||||||||||
| Total Company |
||||||||||||||||||||||||||||
| EBITDA |
$ | 43,975 | $ | 28,640 | $ | 23,629 | $ | 44,648 | $ | 119,193 | $ | 72,614 | $ | 160,065 | ||||||||||||||
|
|
|
|
|
|
|
|
|
|
|
|
|
|
|
|||||||||||||||
| EBITDA per share (diluted) |
$ | 1.08 | $ | 0.71 | $ | 0.59 | $ | 1.11 | $ | 2.96 | $ | 1.78 | $ | 3.98 | ||||||||||||||
|
|
|
|
|
|
|
|
|
|
|
|
|
|
|
|||||||||||||||
| Diluted weighted average shares outstanding |
40,757,055 | 40,487,652 | 40,152,444 | 40,404,520 | 40,243,548 | 40,828,646 | 40,192,418 | |||||||||||||||||||||
|
|
|
|
|
|
|
|
|
|
|
|
|
|
|
|||||||||||||||
| (a) | Represents financial information of WPC LLC as filed on August 7, 2012 in its Form 8-K disclosing Supplemental Unaudited Operating and Financial Data for the six months ended June 30, 2012. |
| (b) | Effective April 1, 2012, we include cash distributions and deferred revenue received and earned from the operating partnerships of CPA®:16 – Global, CPA®:17 – Global and CWI in our Real Estate Ownership segment. Results of operations for the prior year periods have been reclassified to conform to the current period presentation. Additionally, during the third quarter of 2011, CPA®:16 – Global finalized its assessment of the fair values of the assets acquired and liabilities assumed in connection with the CPA®:14/16 merger and made certain adjustments during that quarter. Our proportionate share of the adjustments before income taxes was approximately $2.6 million. In accordance with current accounting guidance, we have retrospectively adjusted our results of operations in our Real Estate Ownership segment for the three and six months ended June 30, 2011 to include such adjustments. |
Investing for the Long RunTM | 13
Non-GAAP Financial Disclosure – EBITDA
EBITDA as disclosed represents earnings before interest, taxes, depreciation and amortization. We believe that EBITDA is a useful supplemental measure to investors and analysts for assessing the performance of our business segments, although it does not represent net income that is computed in accordance with GAAP, because it removes the impact of our capital structure and asset base from our operating results and because it is helpful when comparing our operating performance to that of companies in our industry without regard to such items, which can vary substantially from company to company. Accordingly, EBITDA should not be considered as an alternative to net income as an indicator of our financial performance. EBITDA may not be comparable to similarly titled measures of other companies. Therefore, we use EBITDA as one measure of our operating performance when we formulate corporate goals, evaluate the effectiveness of our strategies and determine executive compensation.
Investing for the Long RunTM | 14
W. P. CAREY & CO. LLC
W. P. Carey Inc. Reconciliation of Net Income to Adjusted EBITDA (Unaudited)
(in thousands, except share and per share amounts)
| $’000 |
YTD Jun-12 $ Amount |
$ / Share Impact |
Cumulative Acc / (Dil) |
YTD Jun-12 EBITDA / |
Annualized EBITDA / | |||||
| WPC INC Adjusted EBITDA Calculation |
||||||||||
| WPC LLC EBITDA(a) |
72,614 | 1.78 | 1.78 | 3.56 | ||||||
| Proportionate share of adjustments for joint ventures |
||||||||||
| 1. Proportionate share of adjustments from equity method investments(b) |
34,496 | 0.84 | 2.62 | 5.25 | ||||||
| 2. Proportionate share of adjustments for non-controlling interests(b) |
(1,359) | (0.03) | 2.59 | 5.18 | ||||||
| Adjustment for joint ventures |
33,137 | 0.81 | 2.59 | 5.18 | ||||||
| Management adjustments(c) |
||||||||||
| 3. (+) Impairments |
6,727 | 0.16 | 2.75 | 5.51 | ||||||
| 4. (-) Gain on sale |
(1,505) | (0.04) | 2.72 | 5.44 | ||||||
| 5. (+) Stock Compensation |
9,755 | 0.24 | 2.96 | 5.91 | ||||||
| 6. (+) Realized and Unrealized Loss on FX and Derivatives |
542 | 0.01 | 2.97 | 5.94 | ||||||
| 7. (+) Merger Expenses |
4,719 | 0.12 | 3.09 | 6.17 | ||||||
| 8. (-) Proportionate share of adjustments from equity method investments(d) |
(16,386) | (0.40) | 2.68 | 5.37 | ||||||
| Management adjustments |
3,853 | 0.09 | 2.68 | 5.37 | ||||||
| CPA®: 15 contribution to EBITDA |
||||||||||
| 9. (+) CPA®:15 EBITDA (e) |
118,664 | 1.72 | 1.72 | 4.40 | 8.81 | |||||
| 10. Proportionate share of adjustments from equity method investments(b) |
11,746 | 0.17 | 1.89 | 4.57 | 9.15 | |||||
| 11. Proportionate share of adjustments for non-controlling interests(b) |
(15,512) | (0.22) | 1.66 | 4.35 | 8.70 | |||||
| 12. (-) Management Adjustments(c) |
(21,398) | (0.31) | 1.35 | 4.04 | 8.08 | |||||
|
CPA®:15 contribution to EBITDA |
93,500 | 1.35 | 1.35 | 4.04 | 8.08 | |||||
| Consolidation Adjustments |
||||||||||
| 13. Dilutive Impact of New Shares Issuance |
- | (1.10) | 0.26 | 2.94 | 5.89 | |||||
| 14. (-) Elimination of LLC’s ownership in CPA®:15’s Pro rata Adjusted EBITDA(f) |
(7,387) | (0.11) | 0.15 | 2.84 | 5.67 | |||||
| Consolidated Adjustments |
(7,387) | (1.20) | 0.15 | 2.84 | 5.67 | |||||
|
|
||||||||||
| WPC INC Adjusted EBITDA |
195,718 | 2.84 | 0.15 | 2.84 | 5.67 | |||||
| a) | Represents financial information of WPC LLC as filed on August 7, 2012 in its Form 8-K disclosing Supplemental Unaudited Operating and Financial Data for the six months ended June 30, 2012. |
| b) | Incorporates the pro rata share of depreciation, amortization, interest and tax provision adjustments for unconsolidated subsidiaries and joint ventures. |
| c) | Represents adjustments to EBITDA to add impairments, stock compensation, Merger expenses, and gain or losses on the sale of real estate, as well as, to add back the impact of realized and unrealized gains/losses related to foreign exchange and derivatives. |
Investing for the Long RunTM | 15
| d) | Incorporates the pro rata share of management adjustments as described above for unconsolidated subsidiaries and joint ventures. |
| e) | See Appendix A for a reconciliation of CPA®:15’s Net Income, as per its Form 10-Q for the six months ended June 30, 2012, to EBITDA. |
| f) | Reflects adjustments to eliminate WPC LLC’s ownership of 7.9% in CPA®: 15. |
Non-GAAP Financial Disclosure – Adjusted EBITDA
Adjusted EBITDA as disclosed represents EBITDA as previously described, modified to include other adjustments to GAAP net income for certain non-cash charges such as impairments and stock compensation. Additionally, we exclude Merger expenses related to the proposed merger with CPA®:15, which are considered non-recurring,and gains/losses in real estate, foreign exchange and derivatives, which are not considered fundamental attributes of our business plans and do not affect our overall long-term operating performance. We exclude these items from Adjusted EBITDA as they are not the primary drivers in our decision making process. Our assessment of our operations is focused on long-term sustainability and not on such non-cash items, which may cause short term fluctuations in net income but have no impact on cash flows. We believe that Adjusted EBITDA is a useful supplemental measure to investors and analysts for assessing the performance of our business segments, although it does not represent net income that is computed in accordance with GAAP because it will help them to better assess the sustainability of our operating performance without the potentially distorting impact of these short-term fluctuations. Accordingly, Adjusted EBITDA should not be considered as an alternative to net income as an indicator of our financial performance. Adjusted EBITDA may not be comparable to similarly titled measures of other companies. Therefore, we use Adjusted EBITDA as one measure of our operating performance when we formulate corporate goals and evaluate the effectiveness of our strategies.
Investing for the Long RunTM | 16
W. P. CAREY & CO. LLC (a)
Total Adjusted Revenue (Pro rata Basis) (Unaudited)
(in thousands, except percentages)
| Three Months Ended | Six Months Ended June 30, | |||||||||||||||||||||||||||||||||||||||||||||||||||||||
| June 30, 2012 | March 31, 2012 | December 31, 2011 | September 30, 2011 | June 30, 2011 | 2012 | 2011 | ||||||||||||||||||||||||||||||||||||||||||||||||||
| Revenue |
% |
Revenue |
% |
Revenue |
% |
Revenue |
% |
Revenue |
% |
Revenue |
% |
Revenue |
% |
|||||||||||||||||||||||||||||||||||||||||||
| Asset management revenue |
$ | 15,636 | 20% | $ | 15,602 | 20% | $ | 15,530 | 20% | $ | 14,840 | 16% | $ | 16,619 | 23% | $ | 31,238 | 20% | $ | 36,439 | 24% | |||||||||||||||||||||||||||||||||||
| Structuring revenue (b) |
3,622 | 5% | 7,638 | 9% | 3,930 | 5% | 21,221 | 23% | 5,735 | 8% | 11,260 | 7% | 21,680 | 15% | ||||||||||||||||||||||||||||||||||||||||||
|
|
|
|
|
|
|
|
|
|
|
|
|
|
|
|
|
|
|
|
|
|
|
|
|
|
|
|
|
|||||||||||||||||||||||||||||
| Investment management revenues |
19,258 | 25% | 23,240 | 29% | 19,460 | 25% | 36,061 | 39% | 22,354 | 31% | 42,498 | 27% | 58,119 | 39% | ||||||||||||||||||||||||||||||||||||||||||
| Real estate revenues |
57,205 | 75% | 57,381 | 71% | 59,616 | 75% | 57,461 | 61% | 50,078 | 69% | 114,586 | 73% | 90,872 | 61% | ||||||||||||||||||||||||||||||||||||||||||
|
|
|
|
|
|
|
|
|
|
|
|
|
|
|
|
|
|
|
|
|
|
|
|
|
|
|
|
|
|||||||||||||||||||||||||||||
| Total Adjusted Revenue |
$ | 76,463 | 100% | $ | 80,621 | 100% | $ | 79,076 | 100% | $ | 93,522 | 100% | $ | 72,432 | 100% | $ | 157,084 | 100% | $ | 148,991 | 100% | |||||||||||||||||||||||||||||||||||
|
|
|
|
|
|
|
|
|
|
|
|
|
|
|
|
|
|
|
|
|
|
|
|
|
|
|
|
|
|||||||||||||||||||||||||||||
| Reconciliation of Total Adjusted Revenue |
||||||||||||||||||||||||||||||||||||||||||||||||||||||||
| Total revenue — as reported |
$ | 68,042 | $ | 69,387 | $ | 61,975 | $ | 78,372 | $ | 116,776 | $ | 137,429 | $ | 192,695 | ||||||||||||||||||||||||||||||||||||||||||
| Less: Reimbursed costs from affiliates (c) |
(20,484) | (18,737) | (15,345) | (14,707) | (17,059) | (39,221) | (34,778) | |||||||||||||||||||||||||||||||||||||||||||||||||
| Less: Wholesaling revenue (c) |
(4,080) | (3,787) | (2,876) | (2,586) | (2,922) | (7,867) | (6,202) | |||||||||||||||||||||||||||||||||||||||||||||||||
| Less: Incentive, termination and subordinated disposition revenue (d) |
- | - | - | - | (52,515) | - | (52,515) | |||||||||||||||||||||||||||||||||||||||||||||||||
| Add: Lease revenues – discontinued operations |
45 | 748 | 1,244 | 579 | 1,622 | 793 | 3,430 | |||||||||||||||||||||||||||||||||||||||||||||||||
| Add: Pro rata share of revenues from equity investments |
5,738 | 6,412 | 6,601 | 6,689 | 7,129 | 12,150 | 14,980 | |||||||||||||||||||||||||||||||||||||||||||||||||
| Less: Pro rata share of revenues due to noncontrolling interests |
(422) | (428) | (436) | (452) | (666) | (850) | (1,741) | |||||||||||||||||||||||||||||||||||||||||||||||||
| Add: Pro rata share of revenues from CPA® REITs |
20,161 | 20,052 | 20,646 | 21,147 | 18,094 | 40,213 | 29,334 | |||||||||||||||||||||||||||||||||||||||||||||||||
| Add: Total distributions of available cash |
7,463 | 6,974 | 7,267 | 4,480 | 1,973 | 14,437 | 3,788 | |||||||||||||||||||||||||||||||||||||||||||||||||
|
|
|
|
|
|
|
|
|
|
|
|
|
|
|
|||||||||||||||||||||||||||||||||||||||||||
| Total Adjusted Revenue |
$ | 76,463 | $ | 80,621 | $ | 79,076 | $ | 93,522 | $ | 72,432 | $ | 157,084 | $ | 148,991 | ||||||||||||||||||||||||||||||||||||||||||
|
|
|
|
|
|
|
|
|
|
|
|
|
|
|
|||||||||||||||||||||||||||||||||||||||||||
| Reconciliation of Real Estate Revenues |
||||||||||||||||||||||||||||||||||||||||||||||||||||||||
| Lease revenues – as reported |
$ | 17,228 | $ | 17,631 | $ | 18,139 | $ | 18,609 | $ | 16,217 | $ | 34,859 | $ | 30,089 | ||||||||||||||||||||||||||||||||||||||||||
| Lease revenues – discontinued operations |
45 | 748 | 1,244 | 579 | 1,622 | 793 | 3,430 | |||||||||||||||||||||||||||||||||||||||||||||||||
|
|
|
|
|
|
|
|
|
|
|
|
|
|
|
|||||||||||||||||||||||||||||||||||||||||||
| Total consolidated lease revenues |
17,273 | 18,379 | 19,383 | 19,188 | 17,839 | 35,652 | 33,519 | |||||||||||||||||||||||||||||||||||||||||||||||||
| Add: Pro rata share of revenues from equity investments |
5,738 | 6,412 | 6,601 | 6,689 | 7,129 | 12,150 | 14,980 | |||||||||||||||||||||||||||||||||||||||||||||||||
| Less: Pro rata share of revenues due to noncontrolling interests |
(422) | (428) | (436) | (452) | (666) | (850) | (1,741) | |||||||||||||||||||||||||||||||||||||||||||||||||
|
|
|
|
|
|
|
|
|
|
|
|
|
|
|
|||||||||||||||||||||||||||||||||||||||||||
| Total pro rata net lease revenues |
22,589 | 24,363 | 25,548 | 25,425 | 24,302 | 46,952 | 46,758 | |||||||||||||||||||||||||||||||||||||||||||||||||
|
|
|
|
|
|
|
|
|
|
|
|
|
|
|
|||||||||||||||||||||||||||||||||||||||||||
| Add: Pro rata share of revenues from CPA® REITs |
||||||||||||||||||||||||||||||||||||||||||||||||||||||||
| CPA®:14 |
- | - | - | - | 860 | - | 4,484 | |||||||||||||||||||||||||||||||||||||||||||||||||
| CPA®:15 |
3,947 | 4,031 | 4,012 | 4,389 | 4,152 | 7,978 | 8,040 | |||||||||||||||||||||||||||||||||||||||||||||||||
| CPA®:16 – Global |
15,514 | 15,405 | 16,150 | 16,399 | 12,734 | 30,919 | 16,226 | |||||||||||||||||||||||||||||||||||||||||||||||||
| CPA®:17 – Global |
700 | 616 | 484 | 359 | 348 | 1,316 | 584 | |||||||||||||||||||||||||||||||||||||||||||||||||
|
|
|
|
|
|
|
|
|
|
|
|
|
|
|
|||||||||||||||||||||||||||||||||||||||||||
| Total pro rata share of revenues from CPA® REITs |
20,161 | 20,052 | 20,646 | 21,147 | 18,094 | 40,213 | 29,334 | |||||||||||||||||||||||||||||||||||||||||||||||||
| Add: Distributions of available cash — CPA® REITs |
||||||||||||||||||||||||||||||||||||||||||||||||||||||||
| CPA®:16 – Global |
3,598 | 4,281 | 3,658 | 2,499 | - | 7,879 | - | |||||||||||||||||||||||||||||||||||||||||||||||||
| CPA®:17 – Global |
3,865 | 2,693 | 3,609 | 1,981 | 1,973 | 6,558 | 3,788 | |||||||||||||||||||||||||||||||||||||||||||||||||
|
|
|
|
|
|
|
|
|
|
|
|
|
|
|
|||||||||||||||||||||||||||||||||||||||||||
| Total distributions of available cash — CPA® REITs |
7,463 | 6,974 | 7,267 | 4,480 | 1,973 | 14,437 | 3,788 | |||||||||||||||||||||||||||||||||||||||||||||||||
| Add: Other real estate income (e) |
6,992 | 5,992 | 6,155 | 6,409 | 5,709 | 12,984 | 10,992 | |||||||||||||||||||||||||||||||||||||||||||||||||
|
|
|
|
|
|
|
|
|
|
|
|
|
|
|
|||||||||||||||||||||||||||||||||||||||||||
| Total Real Estate Revenues |
$ | 57,205 | $ | 57,381 | $ | 59,616 | $ | 57,461 | $ | 50,078 | $ | 114,586 | $ | 90,872 | ||||||||||||||||||||||||||||||||||||||||||
|
|
|
|
|
|
|
|
|
|
|
|
|
|
|
|||||||||||||||||||||||||||||||||||||||||||
Investing for the Long RunTM | 17
| (a) | Represents financial information of WPC LLC as filed on August 7, 2012 in its Form 8-K disclosing Supplemental Unaudited Operating and Financial Data for the six months ended June 30, 2012. |
| (b) | We earn structuring revenue on acquisitions structured on behalf of the REITS we manage and expect significant period-to-period variation in such revenue based on changes in investment volume. Investments structured on behalf of the REITS totaled approximately $98 Million, $172 million, $132 million, $498 million, and $249 million for the three months ended June 30, 2012, March 31, 2012, December 31, 2011, September 30, 2011 and June 30, 2011, respectively, and approximately $270 million and $594 million for the six months ended June 30, 2012 and June 30, 2011, respectively. |
| (c) | Total adjusted revenue excludes reimbursements of costs received from the affiliated REITs as they have no impact on net income. Also excluded is wholesaling revenue earned in connection with CPA®:17 – Global’s and CWI’s public offerings, which is substantially offset by underwriting costs incurred in connection with the offering. |
| (d) | In connection with providing a liquidity event for CPA®:14 shareholders in May 2011, we earned termination revenue of $31.2 million and subordinated disposition revenue of $21.3 million, which we received in shares of CPA®:14 and cash, respectively. These CPA®:14 shares were subsequently converted to shares of CPA®:16 – Global in connection with the CPA®:14/16 merger. |
| (e) | Other real estate income generally consists of revenue from Carey Storage Management LLC “Carey Storage”), a subsidiary that invests in domestic self-storage properties and Livho, Inc., a subsidiary that operates a hotel franchise. Other real estate income also includes lease termination payments and other non-rents related revenues from real estate ownership, and as a result, we expect Other real estate income to fluctuate period to period. |
Note: Amounts presented for prior year periods do not reflect adjustments to prior period amounts for assets reclassified as held for sale or sold in the current period and reflected as discontinued operations.
Investing for the Long RunTM | 18
W. P. CAREY & CO. LLC (a)
Total Adjusted Revenue: W. P. Carey Group (Unaudited)
(in thousands, except percentages)
| Three Months Ended | Six Months Ended June 30, | |||||||||||||||||||||||||||||||||||||||||||||||||||||||
| June 30, 2012 | March 31, 2012 | December 31, 2011 | September 30, 2011 | June 30, 2011 | 2012 | 2011 | ||||||||||||||||||||||||||||||||||||||||||||||||||
| Revenue |
% |
Revenue |
% |
Revenue |
% |
Revenue |
% |
Revenue |
% |
Revenue |
% |
Revenue |
% |
|||||||||||||||||||||||||||||||||||||||||||
| W. P. Carey Pro Rata Revenues |
||||||||||||||||||||||||||||||||||||||||||||||||||||||||
|
|
||||||||||||||||||||||||||||||||||||||||||||||||||||||||
| W. P. Carey pro rata lease revenue |
$ | 22,589 | 9% | $ | 24,363 | 9% | $ | 25,548 | 10% | $ | 25,424 | 10% | $ | 24,302 | 10% | $ | 46,952 | 9% | $ | 46,758 | 10% | |||||||||||||||||||||||||||||||||||
| W. P. Carey wholesaling revenue (b) |
4,080 | 2% | 3,787 | 1% | 2,876 | 1% | 2,586 | 1% | 2,922 | 1% | 7,867 | 2% | 6,202 | 1% | ||||||||||||||||||||||||||||||||||||||||||
| Other real estate income |
6,992 | 3% | 5,992 | 2% | 6,155 | 2% | 6,409 | 3% | 5,709 | 2% | 12,984 | 3% | 10,992 | 2% | ||||||||||||||||||||||||||||||||||||||||||
| CPA®:14 and the REITs Pro Rata Revenues |
||||||||||||||||||||||||||||||||||||||||||||||||||||||||
|
|
||||||||||||||||||||||||||||||||||||||||||||||||||||||||
| CPA®:14 pro rata lease revenue |
- | 0% | - | 0% | - | 0% | - | 0% | 11,190 | 5% | - | 0% | 47,880 | 10% | ||||||||||||||||||||||||||||||||||||||||||
| CPA®:14 other income |
- | 0% | - | 0% | - | 0% | - | 0% | 808 | 0% | - | 0% | 1,228 | 0% | ||||||||||||||||||||||||||||||||||||||||||
| CPA®:15 pro rata lease revenue |
49,958 | 19% | 51,030 | 20% | 52,111 | 20% | 57,755 | 23% | 56,110 | 23% | 100,988 | 19% | 109,362 | 23% | ||||||||||||||||||||||||||||||||||||||||||
| CPA®:15 other income |
1,361 | 1% | 6,771 | 3% | 2,385 | 1% | 1,819 | 1% | 1,665 | 1% | 8,132 | 2% | 3,568 | 1% | ||||||||||||||||||||||||||||||||||||||||||
| CPA®:16 – Global pro rata lease revenue |
85,242 | 34% | 85,588 | 34% | 90,222 | 36% | 92,653 | 37% | 86,633 | 34% | 170,830 | 34% | 147,005 | 30% | ||||||||||||||||||||||||||||||||||||||||||
| CPA®:16 – Global other income |
9,916 | 4% | 11,017 | 4% | 12,093 | 5% | 9,705 | 4% | 9,399 | 4% | 20,933 | 4% | 17,623 | 4% | ||||||||||||||||||||||||||||||||||||||||||
| CPA®:17 – Global pro rata lease revenue |
58,321 | 23% | 55,975 | 22% | 53,806 | 22% | 44,860 | 18% | 43,467 | 18% | 114,296 | 21% | 82,805 | 17% | ||||||||||||||||||||||||||||||||||||||||||
| CPA®:17 – Global other income |
12,651 | 5% | 12,063 | 5% | 8,779 | 3% | 6,942 | 3% | 3,833 | 2% | 24,714 | 5% | 7,430 | 2% | ||||||||||||||||||||||||||||||||||||||||||
| CWI hotel revenue |
846 | 0% | - | 0% | - | 0% | - | 0% | - | 0% | 846 | 0% | - | 0% | ||||||||||||||||||||||||||||||||||||||||||
| CWI other income |
(398) | 0% | 417 | 0% | 546 | 0% | 535 | 0% | - | 0% | 19 | 0% | - | 0% | ||||||||||||||||||||||||||||||||||||||||||
|
|
|
|
|
|
|
|
|
|
|
|
|
|
|
|||||||||||||||||||||||||||||||||||||||||||
| Total combined revenues |
251,558 | 257,003 | 254,521 | 248,688 | 246,038 | 508,561 | 480,853 | |||||||||||||||||||||||||||||||||||||||||||||||||
| Less: Carey Financial revenues |
4,079 | 3,788 | 2,876 | 2,587 | 2,922 | 7,867 | 6,202 | |||||||||||||||||||||||||||||||||||||||||||||||||
|
|
|
|
|
|
|
|
|
|
|
|
|
|
|
|||||||||||||||||||||||||||||||||||||||||||
| Net real estate related revenues |
$ | 247,479 | $ | 253,215 | $ | 251,645 | $ | 246,101 | $ | 243,116 | $ | 500,694 | $ | 474,651 | ||||||||||||||||||||||||||||||||||||||||||
|
|
|
|
|
|
|
|
|
|
|
|
|
|
|
|||||||||||||||||||||||||||||||||||||||||||
| (a) | Represents financial information of WPC LLC as filed on August 7, 2012 in its Form 8-K disclosing Supplemental Unaudited Operating and Financial Data for the six months ended June 30, 2012. |
| (b) | Total adjusted revenue excludes reimbursements of costs received from the affiliated REITs as they have no impact on net income. Also excluded is wholesaling revenue earned in connection with CPA®:17 – Global’s and CWI’s public offerings, which is substantially offset by underwriting costs incurred in connection with the offering. |
Non-GAAP Financial Disclosure – Total Adjusted Revenue
Total adjusted revenue is a non-GAAP financial measure that represents revenues on a GAAP basis adjusted for our pro rata share of revenues from equity investments as well as the pro rata share of revenues due to noncontrolling interests. We believe that total adjusted revenue is useful to investors and analysts as a supplemental measure of revenues from our core operations, and we use it to evaluate the stability of our underlying revenue streams. Total adjusted revenue should not be considered as an alternative to revenues computed on a GAAP basis as a measure of our profitability. Total adjusted revenue may not be comparable to similarly titled measures of other companies.
Investing for the Long RunTM | 19
W. P. CAREY & CO. LLC
Financial and Operational Statistics (Unaudited)
As of June 30, 2012
|
For the Six Months Ended June 30, 2012 | ||||
| WPC LLC |
WPC INC | |||
| Debt to Total Capitalization |
23.8% | 38.6% | ||
| Net Debt to Total Capitalization |
22.2% | 33.8% | ||
| Net Debt to Enterprise Value |
22.5% | 35.5% | ||
| Annualized EBITDA ($’000)(a) |
$219,207 | $391,435 | ||
| Net Debt(b) to Annualized EBITDA(a) |
2.46 | 4.46 | ||
| Total Debt / Gross Assets |
39.9% | 43.2% | ||
| Shares Outstanding |
40,358,186 | 69,021,061 | ||
| Stock Price at end of Period |
$46.03 | $46.03 | ||
| Market Capitalization (Equity Capitalization) ($’000) |
$1,857,687 | $3,177,039 | ||
| Total Capitalization ($’000) (c) |
$2,437,379 | $5,176,111 | ||
| Enterprise Value ($’000) (d) |
$2,397,579 | $4,924,165 | ||
| High Stock Close Price |
$49.00 | N/A | ||
| Low Stock Close Price |
$41.65 | N/A | ||
| (a) | Represents pro rata annualized EBITDA |
| (b) | Represents total debt less cash and cash equivalents |
| (c) | Represents market capitalization plus Total Debt |
| (d) | Represents total capitalization less cash and cash equivalents |
Investing for the Long RunTM | 20
W. P. CAREY & CO. LLC
W. P. Carey Inc. Portfolio Debt Overview (Pro rata Basis) (Unaudited)
As of June 30, 2012
(in thousands, except percentages)
Portfolio Debt Maturity (a)
| Year of Maturity |
Debt Maturity(a) |
|||||||
| 2012 |
$ | 87,819 | ||||||
| 2013 |
96,491 | |||||||
| 2014 |
500,412(b) | |||||||
| 2015 |
156,364 | |||||||
| 2016 |
58,972 | |||||||
| 2017 |
178,173 | |||||||
| 2018 |
152,907 | |||||||
| 2019 |
36,892 | |||||||
| 2020 |
70,286 | |||||||
| 2021 |
28,801 | |||||||
| 2022 |
9,366 | |||||||
| Thereafter |
39,022 | |||||||
|
|
|
|||||||
| Total |
$ | 1,415,505 | ||||||
|
|
|
|||||||
| (a) | Represents real estate balloon payments. |
| (b) | Amount includes outstanding recourse debt on the unsecured line of credit |
Debt Maturity Analysis (b)
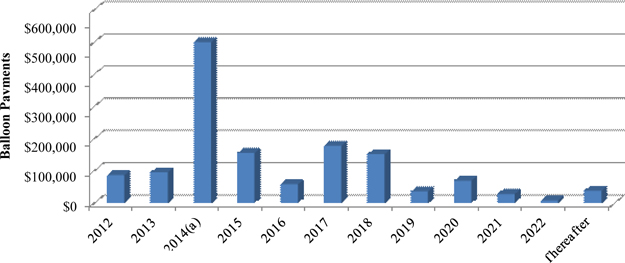
Year of Maturity
| (a) | Amount includes outstanding recourse debt on the unsecured line of credit. |
| (b) | Represents real estate balloon payments. |
Fixed and Variable Rate Debt Analysis
| Non-Recourse Debt |
Total Outstanding Balance |
Percent of Total | ||||||||
| Fixed |
$ | 1,177,276 | 67% | |||||||
| Variable – Capped |
35,312 | 2% | ||||||||
| Variable – Floating |
16,541 | 1% | ||||||||
| Variable – Future Rate Reset |
113,214 | 7% | ||||||||
| Variable – Swapped |
176,748 | 10% | ||||||||
|
|
|
|
|
|||||||
| 1,519,091 | 87% | |||||||||
| Recourse Debt |
||||||||||
| Variable - Line of Credit |
233,160 | 13% | ||||||||
|
|
|
|
|
|||||||
| Total Debt Outstanding |
$ | 1,752,251 | 100% | |||||||
|
|
|
|
|
|||||||
Investing for the Long RunTM | 21
W. P. CAREY & CO. LLC
W. P. Carey Inc. Detailed Debt Summary (Pro Rata Basis) (Unaudited)
As of June 30, 2012
(in thousands, except percentages)
| Tenant/Lease Guarantor |
Maturity Date |
Interest Rate |
Rate Type |
Percent Ownership |
Pro Rata USD Equivalent (a) |
|||||||
| PETsMART, Inc. |
Jul-12 | 6.50% | Fixed | 100% | $ | 2,597 | ||||||
| U.T.I. of Illinois, Inc. |
Jul-12 | 7.50% | Fixed | 100% | 2,641 | |||||||
| AutoZone, Inc. |
Aug-12 | 6.85% | Fixed | 100% | 39 | |||||||
| Barnes & Noble, Inc. |
Sep-12 | 6.49% | Variable - Swapped | 100% | 3,071 | |||||||
| EADS North America Defense Test & Services |
Sep-12 | 6.66% | Fixed | 100% | 8,237 | |||||||
| Foster Wheeler Realty Services |
Sep-12 | 6.67% | Fixed | 100% | 25,360 | |||||||
| B. Dalton Bookseller, Inc. |
Sep-12 | 7.50% | Fixed | 100% | 3,094 | |||||||
| Anthony’s Manufacturing Company |
Oct-12 | 5.11% | Fixed | 100% | 7,897 | |||||||
| BE Aerospace, Inc. |
Nov-12 | 6.11% | Fixed | 100% | 7,902 | |||||||
| BE Aerospace, Inc. |
Nov-12 | 6.11% | Fixed | 100% | 9,019 | |||||||
| Faurecia Exhaust Systems |
Nov-12 | 5.16% | Fixed | 100% | 2,278 | |||||||
| The United States Playing Card Company & Alstom Power |
Dec-12 | 5.18% | Fixed | 100% | 2,437 | |||||||
| The United States Playing Card Company & Alstom Power |
Dec-12 | 5.18% | Fixed | 100% | 6,746 | |||||||
| Arch Chemicals, Inc. |
Dec-12 | 5.98% | Fixed | 100% | 7,290 | |||||||
| Meadow Brook Meat |
Jan-13 | 6.08% | Fixed | 100% | 14,813 | |||||||
| TruServ Corporation |
Jan-13 | 5.83% | Fixed | 50% | 9,298 | |||||||
| TruServ Corporation |
Jan-13 | 5.83% | Fixed | 50% | 11,700 | |||||||
| TruServ Corporation |
Feb-13 | 5.83% | Fixed | 50% | 11,807 | |||||||
| C1000 Logistiek Vastgoed B.V. |
May-13 | 2.652% | Variable - Floating | 15% | 13,301 | |||||||
| Thales SA |
Jul-13 | 3.40% | Variable - Swapped | 65% | 13,056 | |||||||
| AutoZone, Inc. |
Aug-13 | 6.85% | Fixed | 100% | 522 | |||||||
| AutoZone, Inc. |
Aug-13 | 6.85% | Fixed | 100% | 60 | |||||||
| American Pad & Paper, LLC |
Oct-13 | 6.53% | Fixed | 100% | 5,247 | |||||||
| Danka Office Imaging Company |
Oct-13 | 6.71% | Fixed | 100% | 18,229 | |||||||
| LifeTime Fitness |
Jan-14 | 6.43% | Fixed | 100% | 22,392 | |||||||
| US Airways Group, Inc. |
Apr-14 | 4.24% | Variable - Capped | 79% | 13,843 | |||||||
| U-Haul Moving Partners Inc. & Mercury Partners, LP |
May-14 | 6.45% | Fixed | 58% | 88,539 | |||||||
| Actuant |
May-14 | 6.82% | Fixed | 50% | 4,943 | |||||||
| TietoEnator Plc |
Jul-14 | 5.16% | Fixed | 60% | 35,648 | |||||||
| Northrop Grumman Systems Corporation & Overland Storage Inc. |
Aug-14 | 6.18% | Fixed | 100% | 17,212 | |||||||
| Plexus Corporation |
Aug-14 | 7.25% | Fixed | 100% | 4,907 | |||||||
| Carrefour France SAS |
Dec-14 | 5.55% | Variable - Future Rate Reset |
100% | 90,329 | |||||||
| Pohjola Non-Life Insurance Company LTD |
Jan-15 | 4.59% | Fixed | 60% | 43,205 | |||||||
| Sports Wholesale, Inc. |
May-15 | 6.45% | Variable - Swapped | 100% | 4,493 | |||||||
| Hellweg Die Profi-Baumarkte GmbH Und Co. |
May-15 | 4.55% | Fixed | 75% | 63,660 | |||||||
| Garden Ridge, L.P. |
Jun-15 | 6.75% | Fixed | 100% | 5,733 | |||||||
| Custom Food Products, LLC |
Aug-15 | 10.00% | Fixed | 100% | 79 | |||||||
| Wagon Automotive Nagold GmbH & Waldaschaff Automotive |
Aug-15 | 6.64% | Fixed | 33.33% | 6,299 | |||||||
| Lowes Home Improvement Warehouse |
Sep-15 | 4.87% | Fixed | 100% | 8,402 | |||||||
| Bouygues Telecom |
Oct-15 | 3.07% | Fixed | 95% | 4,827 | |||||||
(a) Based upon exchange rates at June 30, 2012.
Investing for the Long RunTM | 22
W. P. CAREY & CO. LLC
W. P. Carey Inc. Detailed Debt Summary (Pro Rata Basis - Continued) (Unaudited)
As of June 30, 2012
(in thousands, except percentages)
| Tenant/Lease Guarantor |
Maturity Date |
Interest Rate |
Rate Type |
Percent Ownership |
Pro Rata USD Equivalent (a) |
|||||||
| The American Bottling Company |
Nov-15 | 5.13% | Fixed | 100% | 28,890 | |||||||
| Tata Steel UK Limited |
Nov-15 | 6.17% | Fixed | 100% | 10,338 | |||||||
| Humco Holding Group, Inc. |
Feb-16 | 4.75% | Fixed | 100% | 2,788 | |||||||
| World Color Printing (USA) Corp. |
May-16 | 5.30% | Fixed | 100% | 4,890 | |||||||
| CheckFree Corporation |
Jun-16 | 6.18% | Fixed | 100% | 28,553 | |||||||
| Various self-storage facilities |
Jul-16 | 6.27% | Variable - Future Rate Reset |
40% | 5,937 | |||||||
| Del Monte Corporation |
Aug-16 | 4.80% | Fixed | 50% | 5,535 | |||||||
| Sprint Spectrum Realty Company, L. P. |
Aug-16 | 4.85% | Fixed | 100% | 8,291 | |||||||
| Multi-Tenant |
Oct-16 | 5.01% | Fixed | 75% | 9,835 | |||||||
| Consolidated Systems, Inc. |
Nov-16 | 5.87% | Fixed | 60% | 6,658 | |||||||
| Hellweg Die Profi-Baumärkte GmbH & Co KG |
Jan-17 | 5.49% | Fixed | 40% | 130,464 | |||||||
| Hellweg Die Profi-Baumärkte GmbH & Co KG |
Jan-17 | 5.49% | Fixed | 38% | 6,881 | |||||||
| Hellweg Die Profi-Baumarkte GmbH Und Co. |
Jan-17 | 5.49% | Fixed | 5% | 864 | |||||||
| Hellweg Die Profi-Baumarkte GmbH Und Co. |
Jan-17 | 6.74% | Fixed | 40% | (11,600 | ) | ||||||
| SaarOTEC |
Jan-17 | 5.32% | Fixed | 50% | 4,295 | |||||||
| Rave Motion Pictures Baton Rouge LLC |
Feb-17 | 5.60% | Fixed | 100% | 10,265 | |||||||
| Qwest Communications, Inc. |
Feb-17 | 4.50% | Fixed | 100% | 1,250 | |||||||
| TSI Newton, LLC |
May-17 | 5.59% | Fixed | 44% | 3,266 | |||||||
| 24 Hour Fitness USA, Inc. |
Jun-17 | 5.50% | Variable - Floating | 100% | 3,240 | |||||||
| Amylin Pharmaceuticals, Inc. |
Jul-17 | 6.20% | Fixed | 100% | 15,536 | |||||||
| Amylin Pharmaceuticals, Inc. |
Jul-17 | 6.20% | Fixed | 100% | 19,060 | |||||||
| OBI Group |
Mar-18 | 5.10% | Variable - Swapped | 75% | 107,246 | |||||||
| MediMedia USA, Inc. |
Apr-18 | 5.90% | Fixed | 100% | 11,153 | |||||||
| The New York Times Company |
Apr-18 | 2.97% | Variable - Capped | 18% | 21,469 | |||||||
| OBI Group |
May-18 | 5.48% | Variable - Swapped | 100% | 7,958 | |||||||
| Kerr Corporation |
Oct-18 | 7.23% | Fixed | 100% | 7,032 | |||||||
| Omnicom Group, Inc. |
Oct-18 | 6.77% | Fixed | 100% | 23,933 | |||||||
| Advanced Micro Devices |
Jan-19 | 5.80% | Fixed | 33.34% | 18,542 | |||||||
| Various self-storage facilities |
Feb-19 | 7.03% | Variable - Future Rate Reset |
40% | 12,593 | |||||||
| Orbital Sciences Corporation |
Jul-19 | 7.75% | Fixed | 100% | 12,381 | |||||||
| Universal Technical Inst. of CA, Inc. |
Nov-19 | 6.27% | Fixed | 100% | 11,750 | |||||||
| 24 Hour Fitness USA, Inc. |
Jan-20 | 6.10% | Fixed | 100% | 3,231 | |||||||
| Merit Medical Systems, Inc. |
Apr-20 | 6.50% | Fixed | 100% | 12,868 | |||||||
| JPMORGAN CHASE BANK, NATIONAL ASSOC. |
Jul-20 | 5.47% | Variable - Swapped | 100% | 33,924 | |||||||
| Prefecture de Police (Paris, France) |
Aug-20 | 4.36% | Fixed | 50% | 38,579 | |||||||
| Self-Storage Facility in Pensacola, FL |
Nov-20 | 6.25% | Variable - Future Rate Reset |
100% | 1,820 | |||||||
| Federal Express Corporation |
Dec-20 | 5.48% | Fixed | 100% | 52,396 | |||||||
| Universal Technical Inst. of Penn., Inc. |
Jan-21 | 6.15% | Fixed | 100% | 13,012 | |||||||
| SymphonyIRI Group, Inc. |
Feb-21 | 5.92% | Fixed | 100% | 14,651 | |||||||
(a) Based upon exchange rates at June 30, 2012.
Investing for the Long RunTM | 23
W. P. CAREY & CO. LLC
W. P. Carey Inc. Detailed Debt Summary (Pro Rata Basis - Continued) (Unaudited)
As of June 30, 2012
(in thousands, except percentages)
| Tenant/Lease Guarantor |
Maturity Date |
Interest Rate |
Rate Type |
Percent Ownership |
Pro Rata |
|||||||
| Datalogic Scanning, Inc. |
Feb-21 | 5.80% | Fixed | 100% | 4,891 | |||||||
| PETsMART, Inc. |
Sep-21 | 6.50% | Fixed | 30% | 5,922 | |||||||
| Integracolor, Ltd. |
Mar-22 | 4.37% | Variable - Swapped | 100% | 7,000 | |||||||
| 24 Hour Fitness USA, Inc. |
Apr-22 | 6.29% | Fixed | 100% | 4,331 | |||||||
| Belgium Government |
May-22 | 6.23% | Fixed | 100% | 10,163 | |||||||
| Pactiv Corporation |
Mar-23 | 6.32% | Fixed | 100% | 6,626 | |||||||
| Benchmark Electronics Manufacturing, Inc. |
Apr-23 | 6.36% | Fixed | 100% | 5,263 | |||||||
| Hologic, Inc. |
May-23 | 6.40% | Fixed | 100% | 13,003 | |||||||
| Galyan’s Trading Company |
Sep-23 | 7.32% | Fixed | 100% | 10,628 | |||||||
| Grande Communications Networks, Inc. |
Sep-23 | 6.72% | Fixed | 100% | 5,493 | |||||||
| Rexam Consumer Plastics, Inc. |
Oct-23 | 6.30% | Fixed | 100% | 12,417 | |||||||
| EDS Customer Relationship Mgmt. Inc. |
Dec-23 | 6.20% | Fixed | 100% | 11,059 | |||||||
| World Airways, Inc. |
Jun-24 | 6.76% | Fixed | 100% | 4,172 | |||||||
| Dick’s Sporting Goods |
Oct-24 | 7.46% | Fixed | 100% | 3,943 | |||||||
| Shaklee Corporation |
Oct-24 | 5.54% | Fixed | 100% | 14,018 | |||||||
| Berry Plastics Corporation |
Nov-24 | 5.54% | Fixed | 100% | 15,877 | |||||||
| Plumbmaster, Inc. |
Nov-24 | 5.54% | Fixed | 100% | 4,718 | |||||||
| Universal Technical Institute of Arizona |
Dec-24 | 5.82% | Fixed | 100% | 14,104 | |||||||
| 24 Hour Fitness USA, Inc. |
Jan-25 | 7.63% | Variable - Future Rate Reset |
100% | 2,535 | |||||||
| The Talaria Company, LLC |
Jun-25 | 6.26% | Fixed | 30% | 8,262 | |||||||
| Google, Inc. |
Nov-25 | 5.15% | Fixed | 100% | 24,000 | |||||||
| Gestamp Alabama, LLC |
May-26 | 6.25% | Fixed | 100% | 6,606 | |||||||
| Oriental Trading Company, inc. |
Sep-26 | 6.56% | Fixed | 100% | 23,134 | |||||||
| Total Non-Recourse Debt |
1,519,091 | |||||||||||
| Unsecured Line of Credit |
Dec-14 | 2.00% | Variable - Floating | 100% | 233,160 | |||||||
| Total Debt |
$ 1,752,251 | |||||||||||
(a) Based upon exchange rates at June 30, 2012.
Investing for the Long RunTM | 24
W. P. CAREY & CO. LLC (a)
CPA REITs (Unaudited)
As of June 30, 2012
(in thousands, except percentages)
| Ownership | Current
Annualized
Distribution(c) |
Asset
Management
Revenue(d) |
Structuring
Revenue (e) |
GP
Distributions (f) |
Performance
Revenues(f) |
|||||||||||||||||||
|
|
||||||||||||||||||||||||
| CPA®:15(b) |
7.9% | 7.35% | 0.5% | 4.5% | N/A | 0.5% | ||||||||||||||||||
| CPA®:16 - Global |
18.2% | 6.69% | 0.5% | 4.5% | 10.0% | N/A | ||||||||||||||||||
| CPA®:17 - Global |
1.2% | 6.50% | 0.5% | 4.5% | 10.0% | N/A | ||||||||||||||||||
| CWI |
0.4% | 6.00% | 0.5% | 2.5% | 10.0% | N/A | ||||||||||||||||||
| Square Feet |
Inception Date |
Total Domestic AUM |
Total International AUM |
Total Assets |
Total Debt |
|||||||||||||||||||
|
|
||||||||||||||||||||||||
| CPA®:15(a) |
27,000 | 2002 | $1,593,019 | $ 856,079 | $2,376,864 | $1,221,169 | ||||||||||||||||||
| CPA®:16 - Global |
48,000 | 2003 | 2,624,062 | 1,081,131 | 3,476,427 | 1,809,396 | ||||||||||||||||||
| CPA®:17 - Global |
31,000 | 2007 | 1,805,129 | 1,453,895 | 3,484,016 | 1,276,174 | ||||||||||||||||||
| CWI |
N/A | 2010 | 109,602 | 0 | 93,162 | 18,931 | ||||||||||||||||||
|
|
||||||||||||||||||||||||
| Total |
106,000 | $6,131,812 | $3,391,105 | $9,430,469 | $4,325,670 | |||||||||||||||||||
|
|
||||||||||||||||||||||||
| (a) | Represents historical information of WPC LLC and the REITS as of June 30, 2012. |
| (b) | On September 13, 2012, WPC LLC shareholders and CPA®:15 stockholders approved the Merger pursuant to which CPA®:15 will merge with and into one of WPC LLC’s newly formed subsidiaries, W. P. Carey Inc. |
| (c) | The current annualized distribution rate is based on quarterly distribution rate for the second quarter of 2012. For CWI, approximately 83% of its second quarter distribution was paid in cash, with the remaining 17% paid in shares of its common stock. |
| (d) | We generally earn base asset management revenue of 0.5% of average invested assets. For CPA®:17 – Global, we earn asset management revenue ranging from 0.5% of average market value for long-term net leases and certain other types of real estate investments up to 1.75% of the average equity value for certain types of securities. In 2012, we elected to receive all base asset management revenue from CPA®:15 in cash, while for CPA®:16 – Global, we elected to receive 50% of base asset management revenue in shares with the remaining 50% payable in cash. For CPA®:17 – Global and CWI, we elected to receive base asset management revenue in shares of their common stock. |
| (e) | We generally receive structuring revenue of up to an average of 4.5% of the total cost of all investments made by each CPA®: REIT. For certain types of non-long term net lease investments acquired on behalf of CPA®:17 – Global, structuring revenue may range from 0% to 1.75% of the equity invested plus the related structuring revenue. For CWI, we earn structuring revenue of 2.5% of the total investment cost of the properties acquired. |
| (f) | We do not earn performance revenue from CPA®:16 – Global, CPA®:17 – Global and CWI, but we receive up to 10% of distributions of available cash from their operating partnerships, which is defined as cash generated from operations, excluding capital proceeds, as reduced by operating expenses and debt service, excluding prepayments and balloon payments. In 2012, we elected to receive performance revenue from CPA®:15 in cash. |
Investing for the Long RunTM | 25
W. P. CAREY & CO. LLC
W. P. Carey Inc. Joint Venture Information (Unaudited)
As of June 30, 2012
(in thousands, except percentages)
| Total JV | WPC INC Pro Rata Share of Total JV |
| ||||||||||||||||||||||||||||||||||||||||
| Joint Venture or JV (Principal Tenant) |
WPC INC % Interest in JV |
Remaining Interest in JV |
Assets |
Liabilities |
Equity |
Assets |
Liabilities |
Equity |
||||||||||||||||||||||||||||||||||
| Actuant |
50.05% | CPA®:16 - 49.95% |
$15,532 | $11,055 | $4,477 | $7,774 | $5,533 | $2,241 | ||||||||||||||||||||||||||||||||||
| Advanced Micro Devices |
33.34% | CPA®:16 - 67% |
80,976 | 67,019 | 13,957 | 26,997 | 22,344 | 4,653 | ||||||||||||||||||||||||||||||||||
| Builders Firstsource - Atlantic Group/Ohio Valley, Inc. |
40.00% | CPA®:16 - 60% |
13,560 | 946 | 12,615 | 5,424 | 378 | 5,046 | ||||||||||||||||||||||||||||||||||
| C1000 Logistiek Vastgoed B.V. |
15.00% | CPA®:17 - 85% |
186,535 | 92,634 | 93,901 | 27,980 | 13,895 | 14,085 | ||||||||||||||||||||||||||||||||||
| Consolidated Systems, Inc. |
60.00% | CPA®:16 - 40% |
16,571 | 11,384 | 5,187 | 9,943 | 6,830 | 3,112 | ||||||||||||||||||||||||||||||||||
| Del Monte Corporation |
50.00% | CPA®:16 - 50% |
13,150 | 11,469 | 1,681 | 6,575 | 5,735 | 840 | ||||||||||||||||||||||||||||||||||
| Eroski Sociedad Cooperativa |
70.00% | CPA®:17 - 30% |
29,600 | 106 | 29,494 | 20,720 | 74 | 20,646 | ||||||||||||||||||||||||||||||||||
| Hellweg Die Profi-Baumarkte GmbH Und Co. |
75.00% | CPA®:16 - 25% |
173,773 | 91,517 | 82,255 | 130,329 | 68,638 | 61,691 | ||||||||||||||||||||||||||||||||||
| Hellweg Die Profi-Baumärkte GmbH & Co |
40.00% | CPA®:16 - 27%; CPA®:17 -33% |
413,204 | 364,495 | 48,708 | 165,281 | 145,798 | 19,483 | ||||||||||||||||||||||||||||||||||
| LABRADOR (PETsMART, Inc ) |
30.00% | CPA®:16 - 70% |
26,844 | 19,950 | 6,894 | 8,053 | 5,985 | 2,068 | ||||||||||||||||||||||||||||||||||
| Marcourt (Courtyard by Marriott) |
47.35% | Third party - 53% |
132,209 | (158) | 132,367 | 62,601 | (75) | 62,676 | ||||||||||||||||||||||||||||||||||
| Markus Barth Logistik GmbH & Co. KG |
66.67% | CPA®:16 - 33.33% |
11,687 | 902 | 10,785 | 7,792 | 601 | 7,191 | ||||||||||||||||||||||||||||||||||
| Multi-tenant property in Conflan St Honorine, France |
65.00% | CPA®:16 - 35% |
25,402 | 22,488 | 2,914 | 16,511 | 14,617 | 1,894 | ||||||||||||||||||||||||||||||||||
| Multi-tenant property in Illkirch-Graffens, France |
75.00% | Third party - 25% |
21,161 | 14,823 | 6,338 | 15,871 | 11,118 | 4,753 | ||||||||||||||||||||||||||||||||||
| Multi-tenant property in Tours, France |
95.00% | Third party - 5% |
11,744 | 8,391 | 3,353 | 11,156 | 7,971 | 3,185 | ||||||||||||||||||||||||||||||||||
| NYT Real Estate Company LLC |
17.75% | CPA®:16 - 27.25 %; CPA®:17 -55% |
246,002 | 63,281 | 182,722 | 43,665 | 11,232 | 32,433 | ||||||||||||||||||||||||||||||||||
| OBI Group |
75.00% | CPA®:16 - 25% |
171,301 | 163,176 | 8,125 | 128,476 | 122,382 | 6,094 | ||||||||||||||||||||||||||||||||||
| Pojl Landlord (Finland) LLC, Pohjola Non-Life Insurance Company LTD |
60.00% | CPA®:16 - 40% |
84,940 | 74,127 | 10,812 | 50,964 | 44,476 | 6,487 | ||||||||||||||||||||||||||||||||||
| Prefecture de Police |
50.00% | CPA®:16 - 50% |
88,089 | 78,670 | 9,419 | 44,045 | 39,335 | 4,709 | ||||||||||||||||||||||||||||||||||
| SaarOTEC |
50.00% | CPA®:16 - 50% |
5,734 | 9,037 | (3,303) | 2,867 | 4,519 | (1,652) | ||||||||||||||||||||||||||||||||||
| Schuler AG |
66.67% | CPA®:16 - 33% |
64,159 | 4,748 | 59,411 | 42,773 | 3,166 | 39,608 | ||||||||||||||||||||||||||||||||||
| TietoEnator Plc |
60.00% | CPA®:16 - 40% |
77,620 | 59,113 | 18,506 | 46,572 | 35,468 | 11,104 | ||||||||||||||||||||||||||||||||||
| The Talaria Company, LLC |
30.00% | CPA®:16 - 70% |
50,012 | 28,158 | 21,854 | 15,004 | 8,447 | 6,556 | ||||||||||||||||||||||||||||||||||
| Town Sports International Holdings, Inc. |
44.00% | CPA®:16 - 56% |
7,227 | 7,536 | (309) | 3,180 | 3,316 | (136) | ||||||||||||||||||||||||||||||||||
| TruServ Corporation (TruValue Corporation) |
50.00% | CPA®:16 - 50% |
124,630 | 67,567 | 57,064 | 62,315 | 33,783 | 28,532 | ||||||||||||||||||||||||||||||||||
| U-Haul Moving Partners Inc. |
57.69% | CPA®:16-30.77 %; CPA®17:11.54% |
277,754 | 175,735 | 102,018 | 160,236 | 101,382 | 58,854 | ||||||||||||||||||||||||||||||||||
| US Airway |
74.58% | Third party - 25.42% |
29,177 | 19,305 | 9,872 | 21,760 | 14,398 | 7,363 | ||||||||||||||||||||||||||||||||||
| Vacant - Carlsbad, CA |
50.00% | CPA®:16 - 50% |
26,120 | 177 | 25,943 | 13,060 | 88 | 12,972 | ||||||||||||||||||||||||||||||||||
| Wagon Waldaschaff Automotive |
33.33% | CPA®:17 - 67% |
40,942 | 20,375 | 20,567 | 13,646 | 6,791 | 6,855 | ||||||||||||||||||||||||||||||||||
|
|
|
|||||||||||||||||||||||||||||||||||||||||
| $2,465,655 | $1,488,026 | $977,627 | $1,171,570 | $738,225 | $433,343 | |||||||||||||||||||||||||||||||||||||
|
|
|
|||||||||||||||||||||||||||||||||||||||||
Investing for the Long RunTM | 26
W. P. CAREY & CO. LLC
W. P. Carey Inc. Portfolio Analysis – Diversification by Rent and Historical Occupancy
(Pro Rata Basis) (Unaudited)
As of June 30, 2012
(in thousands, except percentages)
| Tenant/Lease Guarantor |
Annualized Contractual Minimum Base Rent |
Percent | ||||||||
| Hellweg Die Profi-Baumarkte GmbH & Co. KG(a) |
$ | 24,813 | 8% | |||||||
| U-Haul Moving Partners, Inc. and Mercury Partners, L.P. |
18,741 | 6% | ||||||||
| Carrefour France, SAS (a) |
15,774 | 5% | ||||||||
| OBI Group(a) |
12,743 | 4% | ||||||||
| Universal Technical Institute |
10,065 | 3% | ||||||||
| Marriott International, Inc. |
8,406 | 3% | ||||||||
| Federal Express Corporation |
7,433 | 3% | ||||||||
| True Value Company |
7,101 | 2% | ||||||||
| Foster Wheeler AG |
6,510 | 2% | ||||||||
| Fiserv, Inc. |
5,342 | 2% | ||||||||
|
|
|
|
|
|
||||||
| Total |
$ | 116,928 | 38% | |||||||
|
|
|
|
|
|||||||
Weighted-Average Lease Term for Portfolio: 8.9 years
Historical Occupancy – Combined WPC and CPA ®: 15 Portfolios
| (a) | Rent amounts are subject to fluctuations in foreign currency exchange rates. |
| (b) | Percentage of the portfolio’s total pro rata square footage that was subject to lease. |
Investing for the Long RunTM | 27
W. P. CAREY & CO. LLC
W. P. Carey Inc. Owned Portfolio Analysis – Diversification by Property Type (Pro rata Basis) (Unaudited)
As of June 30, 2012
(in thousands, except percentages)
| Property Type |
Square Footage | Percent | ||||||
| Industrial |
12,691 | 32% | ||||||
| Warehouse/Distribution |
10,381 | 27% | ||||||
| Office |
5,528 | 14% | ||||||
| Retail |
4,970 | 13% | ||||||
| Self-Storage |
3,406 | 9% | ||||||
| Other Properties |
2,114 | 5% | ||||||
|
|
|
|
|
|||||
| Total (b) |
39,090 | 100% | ||||||
|
|
|
|||||||
| Property Type |
Annualized Contractual Minimum Base Rent (a) |
Percent | ||||||
| Office |
$ | 83,537 | 27% | |||||
| Industrial |
71,931 | 24% | ||||||
| Warehouse/Distribution |
50,109 | 16% | ||||||
| Retail |
48,348 | 16% | ||||||
| Self-Storage |
18,930 | 6% | ||||||
| Other Properties |
31,241 | 11% | ||||||
|
|
|
|
|
|||||
| Total (b) |
$ | 304,096 | 100% | |||||
|
|
|
|
|
|||||
| (a) | Includes hospitality and self storage where the rent provided is net operating income for these operating properties and not an annualized contractual minimum base rent. |
| (b) | Excludes 20 domestic self-storage properties in our Carey Storage subsidiary, totaling approximately 0.5 million square feet (on a pro rata basis). |
Investing for the Long RunTM | 28
W. P. CAREY & CO. LLC
W. P. Carey Inc. Owned Portfolio Analysis – Diversification by Tenant Industry (Pro rata Basis) (Unaudited)
As of June 30, 2012
(in thousands, except percentages)
| Square Footage | Annualized Contractual Minimum Base Rent |
|||||||||||||||||
| Industry Type (a) |
WPC INC | Percent | WPC INC | Percent | ||||||||||||||
| Retail Trade |
8,574 | 21.9% | 66,736 | 21.9% | ||||||||||||||
| Business and Commercial Services |
1,565 | 4.0% | 27,601 | 9.1% | ||||||||||||||
| Electronics |
2,292 | 5.9% | 26,502 | 8.7% | ||||||||||||||
| Healthcare, Education and Childcare |
1,662 | 4.3% | 20,269 | 6.7% | ||||||||||||||
| Chemicals, Plastics, Rubber, and Glass |
3,110 | 8.0% | 14,148 | 4.7% | ||||||||||||||
| Buildings and Real Estate |
2,232 | 5.7% | 12,370 | 4.1% | ||||||||||||||
| Media: Printing and Publishing |
1,511 | 3.9% | 11,951 | 3.9% | ||||||||||||||
| Telecommunications |
922 | 2.4% | 11,311 | 3.7% | ||||||||||||||
| Beverages, Food, and Tobacco |
1,715 | 4.4% | 10,876 | 3.6% | ||||||||||||||
| Leisure, Amusement, Entertainment |
564 | 1.4% | 10,732 | 3.5% | ||||||||||||||
| Transportation - Personal |
1,367 | 3.5% | 10,064 | 3.3% | ||||||||||||||
| Transportation - Cargo |
620 | 1.6% | 9,864 | 3.2% | ||||||||||||||
| Construction and Building |
2,191 | 5.6% | 8,830 | 2.9% | ||||||||||||||
| Automobile |
2,101 | 5.4% | 8,565 | 2.8% | ||||||||||||||
| Hotels and Gaming |
650 | 1.7% | 8,416 | 2.8% | ||||||||||||||
| Aerospace and Defense |
970 | 2.5% | 6,604 | 2.2% | ||||||||||||||
| Federal, State and Local Government |
294 | 0.7% | 6,199 | 2.0% | ||||||||||||||
| Machinery |
1,012 | 2.6% | 5,952 | 2.0% | ||||||||||||||
| Insurance |
511 | 1.3% | 5,203 | 1.7% | ||||||||||||||
| Consumer and Durable Goods |
1,040 | 2.6% | 5,119 | 1.7% | ||||||||||||||
| Forest Products and Paper |
1,236 | 3.1% | 3,970 | 1.3% | ||||||||||||||
| Banking |
384 | 1.0% | 3,939 | 1.3% | ||||||||||||||
| Grocery |
553 | 1.4% | 3,811 | 1.2% | ||||||||||||||
| Mining, Metals, and Primary Metal Industries |
552 | 1.4% | 2,444 | 0.8% | ||||||||||||||
| Other (b) |
1,462 | 3.7% | 2,620 | 0.9% | ||||||||||||||
|
|
|
|
|
|
|
|
|
|
||||||||||
| Total (c) |
39,090 | 100.0% | 304,096 | 100.0% | ||||||||||||||
|
|
|
|
|
|
|
|
|
|
||||||||||
| (a) | Based on the Moody’s Classification System and information provided by the tenant. |
| (b) | Includes rent from tenants in the following industries: consumer non-durable goods; textiles, leather and apparel; and multi-tenant properties. |
| (c) | Excludes 20 domestic self-storage properties in our Carey Storage subsidiary, totaling approximately 0.5 million square feet (on a pro rata basis). |
WPC INC Portfolio Revenues – Contractual Increases(a)
(based on annualized contractual minimum base rent)
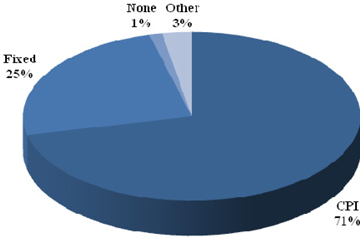
| (a) | Pro rata rents and exchange rate as of June 30, 2012. |
Investing for the Long RunTM | 29
W. P. CAREY & CO. LLC
W. P. Carey Inc. Owned Portfolio Analysis – Diversification by Geography (Pro rata basis) (Unaudited)
As of June 30, 2012
(in thousands, except percentages)
| Region |
Square Footage | Percent | ||||||||
| U.S. |
||||||||||
| South |
11,192 | 29% | ||||||||
| West |
6,735 | 17% | ||||||||
| Midwest |
5,759 | 15% | ||||||||
| East |
5,587 | 14% | ||||||||
|
|
|
|
|
|||||||
| U.S. Total |
29,273 | 75% | ||||||||
|
|
|
|
|
|||||||
| International |
||||||||||
| Germany |
3,452 | 9% | ||||||||
| France |
3,452 | 9% | ||||||||
| Poland |
1,399 | 3% | ||||||||
| Other |
1,514 | 4% | ||||||||
|
|
|
|
|
|||||||
| International Total |
9,817 | 25% | ||||||||
|
|
|
|
|
|||||||
| Total (a) |
39,090 | 100% | ||||||||
|
|
|
|
|
|||||||
| Region |
Annualized Contractual Minimum Base Rent (b) |
Percent | ||||||||
| U.S. |
||||||||||
| South |
$ | 73,115 | 24% | |||||||
| West |
64,104 | 21% | ||||||||
| East |
46,394 | 15% | ||||||||
| Midwest |
34,954 | 12% | ||||||||
|
|
|
|
|
|||||||
| U.S. Total |
218,567 | 72% | ||||||||
|
|
|
|
|
|||||||
| International |
||||||||||
| Germany |
32,319 | 11% | ||||||||
| France |
23,617 | 8% | ||||||||
| Poland |
12,743 | 4% | ||||||||
|
Other(a) |
16,850 | 5% | ||||||||
|
|
|
|
|
|||||||
| International Total |
85,529 | 28% | ||||||||
|
|
|
|
|
|||||||
|
Total(b) |
$ | 304,096 | 100% | |||||||
|
|
|
|
|
|||||||
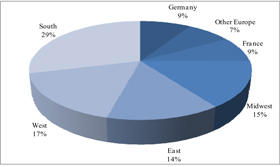
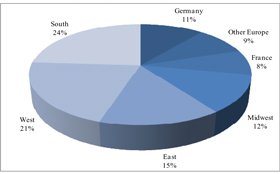
| (a) | Includes assets in Belgium, Finland, the Netherlands, Spain, and the United Kingdom. |
| (b) | Excludes 20 domestic self-storage properties in our Carey Storage subsidiary, totaling approximately 0.5 million square feet (on a pro rata basis). |
Investing for the Long RunTM | 30
W. P. CAREY & CO. LLC
W. P. Carey Inc. Owned Portfolio Analysis – Lease Maturities (Pro rata Basis) (Unaudited)
As of June 30, 2012
(in thousands, except percentages)
| Year of Lease Expiration (a) | Square Footage | Percent | Annualized Contractual Minimum Base Rent (b) |
Percent | ||||||||
|
| ||||||||||||
| 2012 (c) |
118 | 0% | $ | 1,184 | 0% | |||||||
| 2013 |
624 | 2% | 7,969 | 3% | ||||||||
| 2014 |
2,324 | 6% | 19,841 | 7% | ||||||||
| 2015 |
3,821 | 10% | 27,410 | 9% | ||||||||
| 2016 |
2,148 | 5% | 17,826 | 6% | ||||||||
| 2017 |
2,403 | 6% | 12,081 | 4% | ||||||||
| 2018 |
2,566 | 7% | 22,307 | 7% | ||||||||
| 2019 |
1,572 | 4% | 24,479 | 8% | ||||||||
| 2020 |
2,093 | 5% | 12,334 | 4% | ||||||||
| 2021 |
1,254 | 3% | 8,422 | 3% | ||||||||
| 2022 |
3,683 | 9% | 26,929 | 9% | ||||||||
| 2023 |
3,850 | 10% | 28,817 | 10% | ||||||||
| 2024 |
6,116 | 16% | 45,353 | 15% | ||||||||
| 2025 |
461 | 1% | 3,728 | 1% | ||||||||
| 2026 |
646 | 2% | 3,217 | 1% | ||||||||
| 2027 |
1,369 | 4% | 9,079 | 3% | ||||||||
| 2030 |
2,959 | 8% | 31,775 | 10% | ||||||||
| 2033 |
156 | 0% | 1,345 | 0% | ||||||||
| Vacant |
927 | 2% | N/A | N/A | ||||||||
|
| ||||||||||||
| Total (d) |
39,090 | 100% | $ | 304,096 | 100% | |||||||
|
| ||||||||||||
Owned Portfolio Analysis – Lease Maturities
(Based on Annualized Contractual Minimum Base Rent)
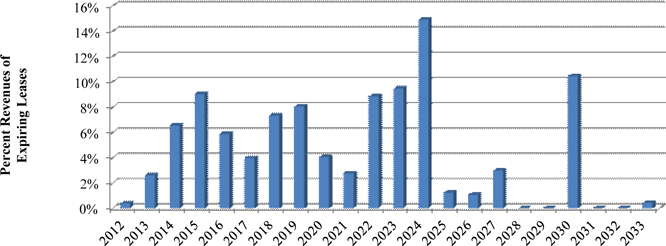
Year of Lease Expiration
| (a) | Assumes tenant does not exercise renewal option. |
| (b) | Includes hospitality and self storage where the rent provided is net operating income for these operating properties and not an annualized contractual minimum base rent. |
| (c) | Month-to-month properties are counted in 2012 revenue stream. |
| (d) | Excludes 20 domestic self-storage properties in our Carey Storage subsidiary, totaling approximately 0.5 million square feet (on a pro rata basis). |
Investing for the Long RunTM | 31
W. P. CAREY & CO. LLC (a)
Investment Activity (Unaudited)
For the Six Months Ended June 30, 2012
(in thousands, except square footage)
Investment Activity
| Acquisitions - REITs (b) | ||||||||||||||||
| Portfolio(s) |
Tenant/Lease Guarantor |
Property Location(s) |
Purchase Price (c) | Closing Date | Property Type | Gross Square Footage |
||||||||||
|
CPA®:17 – Global |
Blue Cross and Blue Shield of Minnesota, Inc. |
Aurora, Eagan & Virginia, MN |
$ | 169,011 | January-12 | Office | 1,131,469 | |||||||||
|
CPA®:17 – Global |
Sabre Communications Corporation and Cellxion, LLC |
Alvarado, TX |
4,964 | March-12 & June-12 | Industrial | 44,250 | ||||||||||
| CPA®:17 – Global |
Nippon Sheet Glass Co., Ltd. (d) (e)
|
Tarnobrzeg, Poland |
26,579 | April-12 | Warehouse/Distribution | BTS | ||||||||||
|
CPA®:17 – Global |
Sabre Communications Corporation and Cellxion, LLC (d) |
Sioux City, IA |
17,801 | June-12 | Industrial | BTS | ||||||||||
|
|
|
|
|
|||||||||||||
| Total Acquisitions - Leased Properties |
218,355 | 1,175,719 | ||||||||||||||
|
|
|
|
|
|||||||||||||
| Portfolio(s) |
Property Type |
Property Location(s) |
Purchase Price (c) | Closing Date | ||||||||||||
| CWI |
Hospitality |
Braintree, MA |
12,500 | May-12 | ||||||||||||
| CWI |
Hospitality |
New Orleans, LA |
14,947 | June-12 | ||||||||||||
| CPA®:17 – Global |
Self-Storage Facilities |
Various locations in Alabama, Louisiana, & Mississippi |
16,800 | June-12 | ||||||||||||
|
|
|
|||||||||||||||
| Total Acquisitions - Hospitality/Self-Storage Properties |
44,247 | |||||||||||||||
|
|
|
|||||||||||||||
| Portfolio(s) |
Security Type |
Company |
Purchase Price (c) | Closing Date | ||||||||||||
| CPA®:17 – Global |
Equity Securities | Lineage Logistics Holdings LLC | 7,070 | June-12 | ||||||||||||
|
|
|
|||||||||||||||
| Total Acquisitions - Equity Securities |
7,070 | |||||||||||||||
|
|
|
|||||||||||||||
| Total Acquisitions |
$ | 269,672 | ||||||||||||||
|
|
|
|||||||||||||||
| (a) | Represents operational data for WPC LLC as filed on August 7, 2012 in its Form 8-K disclosing Supplemental Unaudited Operating and Financial Data for the six months ended June 30, 2012. |
| (b) | There were no acquisitions in our owned portfolio during the period presented. |
| (c) | Includes capitalized transaction costs, where applicable. |
| (d) | Acquisition includes a build-to-suit (“BTS”) transaction. Gross square footage cannot be determined at this time. |
| (e) | Acquisition price reflects applicable foreign exchange rate. |
Investing for the Long RunTM | 32
W. P. CAREY & CO. LLC (a)
Investment Activity (Unaudited)
For the Six Months Ended June 30, 2012
(in thousands, except square footage)
Disposition Activity
| Dispositions - CPA® REITs |
||||||||||||||||
| Portfolio(s) |
Tenant/Lease Guarantor |
Property Location(s) |
Gross Sale Price | Disposition Date |
Property Type | Gross Square Footage |
||||||||||
| CPA®:16 – Global |
Sovereign Bank |
Bourne, Sandwich, & Wareham, MA | $ | 3,173 | January-12 | Retail | 19,693 | |||||||||
| CPA®:15 (54%) |
Médica – France, S.A. (b) |
Chatou, France | 146 | January-12 | Land | 10,200 | ||||||||||
| CPA®:16 – Global |
American Tire Distributors |
Charlotte, NC | 1,500 | February-12 | Warehouse/Distribution | 120,200 | ||||||||||
| CPA®:17 – Global |
Dolgencorp, LLC |
Choudrant, Gardner, Mangham, Mount Hermon & Richwood, LA; Vass, NC; & Chesterfield, Hopewell, & Hot Springs, VA |
12,922 | February-12 & March-12 |
Retail | 99,363 | ||||||||||
| CPA®:15 (67%), CPA®:16 – Global (33%) |
Lindenmaier AG (b) |
Laupheim, Germany | 3,961 | February-12 | Industrial | 67,358 | ||||||||||
| CPA®:15 |
Vacant |
Virginia Beach, VA | 18,200 | February-12 | Warehouse/Distribution | 774,473 | ||||||||||
| CPA®:16 – Global |
McLane Foodservice, Inc. |
Manassas, VA | 7,500 | March-12 | Warehouse/Distribution | 100,337 | ||||||||||
| CPA®:15 |
Vacant (a) |
Little Germany, United Kingdom | 3,387 | April-12 | Office | 41,432 | ||||||||||
| CPA®:15 (54%) |
Médica – France, S.A. (b) |
Chatou, Paris, Poissy, Rosny sous Bois, Rueil Malmaison, & Sarcelles, France |
52,787 | April-12 | Nursing Home | 182,594 | ||||||||||
| CPA®:16 – Global |
Rome Die Casting, LLC |
Rome, GA | 450 | April-12 | Industrial | 117,500 | ||||||||||
| CPA®:16 – Global |
PolyPipe, Inc. |
Fernley, NV | 2,700 | May-12 | Industrial | 31,648 | ||||||||||
| CPA®:16 – Global |
Hydro Systems Company |
Milford, OH | 4,127 | June-12 | Industrial | 437,000 | ||||||||||
| CPA®:15 |
Shaklee Corporation |
Pleasanton, CA | 11,100 | June-12 | Land | N/A | ||||||||||
|
|
|
|
|
|||||||||||||
| Total REIT Dispositions |
121,953 | 2,001,798 | ||||||||||||||
|
|
|
|
|
|||||||||||||
| Dispositions - Owned Portfolio |
||||||||||||||||
| WPC LLC (46%) |
Médica – France, S.A. (b) |
Chatou, France | 124 | January-12 | Land | 8,619 | ||||||||||
| WPC LLC |
Cleo, Inc. |
Memphis, TN | 2,600 | March-12 | Warehouse/Distribution | 1,006,170 | ||||||||||
| WPC LLC |
L-3 Communications Titan Corp. |
San Diego, CA | 13,685 | April-12 | Office | 166,403 | ||||||||||
| WPC LLC (46%) |
Médica – France, S.A. (b) |
Chatou, Paris, Poissy, Rosny sous Bois, Rueil Malmaison, & Sarcelles, France |
40,854 | April-12 | Nursing Home | 154,295 | ||||||||||
| WPC LLC |
Vacant |
Brewton, AL | 75 | May-12 | Retail | 30,625 | ||||||||||
| WPC LLC |
Vacant |
Charlotte, NC | 9,625 | June-12 | Industrial | 437,000 | ||||||||||
|
|
|
|
|
|||||||||||||
| Total Owned Portfolio Dispositions |
66,963 | 1,803,112 | ||||||||||||||
|
|
|
|
|
|||||||||||||
| Total Dispositions |
$ | 188,916 | 3,804,910 | |||||||||||||
|
|
|
|
|
|||||||||||||
| (a) | Represents operational data for WPC LLC as filed on August 7, 2012 in its Form 8-K disclosing Supplemental Unaudited Operating and Financial Data for the six months ended June 30, 2012. |
| (b) | Disposition price reflects applicable foreign exchange rate. |
Investing for the Long RunTM | 33
APPENDIX A
CPA® :15
Reconciliation of Net Income to Adjusted EBITDA (Unaudited)
(in thousands)
| Pro Rata Adjusted EBITDA Calculation |
Six Months Ended June 30 2012 |
|||
| Net income attributable to CPA®:15 - Global shareholders(a) |
$54,458 | |||
| Adjustments: |
||||
| Depreciation and amortization |
25,054 | |||
| Interest expenses |
37,093 | |||
| Taxes |
2,059 | |||
|
|
|
|||
|
CPA®:15 EBITDA |
118,664 | |||
| Proportionate share of adjustments from equity method investments(b) |
11,746 | |||
| Proportionate share of adjustments for non-controlling interests(b) |
(15,512) | |||
|
|
|
|||
| Pro Rata EBITDA |
114,898 | |||
|
|
|
|||
| Management adjustments:(c) |
||||
| Gain on sale |
(39,156) | |||
| Gain/ Loss on extinguishment of debt |
(474) | |||
| Merger Expenses |
1,339 | |||
| Realized and unrealized loss on foreign currency (net) |
1,897 | |||
| Realized and unrealized gain on derivatives (net) |
(67) | |||
| Proportionate share of adjustments from equity method investments(d) |
(10) | |||
| Proportionate share of adjustments for non-controlling interests(d) |
15,073 | |||
|
|
|
|||
| Total Adjustments |
(21,398) | |||
|
|
|
|||
| Pro Rata Adjusted EBITDA |
$93,500 | |||
|
|
|
|||
| a) | Per CPA®:15’s Form 10-Q for the period ended June 30, 2012. |
| b) | Incorporates the pro rata share of depreciation, amortization, interest and tax provision adjustments for unconsolidated subsidiaries and joint ventures. |
| c) | Represents adjustments to EBITDA to add impairments, stock compensation, merger expenses, gains or losses on the sale of real estate, and gain/loss on extinguishment of debt, as well as to addback the impact of realized and unrealized gains/losses related to foreign exchange and derivatives. |
| d) | Incorporates the pro rata share of management adjustments for unconsolidated subsidiaries and joint ventures. |
Investing for the Long RunTM | 34