Attached files
| file | filename |
|---|---|
| 8-K - FORM 8-K - W. P. Carey Inc. | d410886d8k.htm |
 Investing
for
the
Long
Run
TM
September 2012
Exhibit 99.1 |
 Investing for the Long Run™
| 2
Disclosures
W.
P.
Carey
&
Co.
LLC,
W.
P.
Carey
Inc.,
and
CPA
®
:15
and
can
be
identified
by
the
use
of
words
such
as
“may,”
“will,”
“should,”
“would,”
“assume,”
“outlook,”
“seek,”
“plan,”
“believe,”
“expect,”
proposed
REIT
Conversion
and
Merger.
These
statements
are
based
on
the
current
expectations
of
the
management
of
W.
P.
Carey
&
Co.
LLC,
W.
P.
Carey
Inc.,
and
CPA
®
:15.
It
is
important
to
achievements
of
the
combined
company.
Discussions
of
some
of
these
other
important
factors
and
assumptions
are
contained
in
W.
P.
Carey
&
Co.
LLC’s,
W.
P.
Carey
Inc.’s,
and
CPA
®
:15’s
rules
and
regulations
of
the
SEC,
none
of
W.
P.
Carey,
CPA
®
:15
or
W.
P.
Carey
Inc.
undertakes
any
obligation
to
release
publicly
any
revisions
to
the
forward-looking
statements
to
reflect
events
impairments
and
stock
compensation.
Additionally,
we
exclude
merger
expenses
related
to
the
proposed
merger
with
CPA
®
:15,
which
are
considered
non-recurring,
and
gains/losses
in
real
Cautionary Statement Concerning Forward-Looking Statements:
Certain of the matters discussed in this communication constitute forward-looking statements
within the meaning of the Securities Act of 1933 and the Securities Exchange Act of 1934, both as
amended by the Private Securities Litigation Reform Act of 1995. The forward-looking statements
include, among other things, statements regarding the intent, belief or expectations of
“anticipate,” “intend,” “estimate,” “forecast” and other
comparable terms. These forward-looking statements include, but are not limited to, the “Investment Highlights” and statements regarding the
benefits of the proposed REIT Conversion and Merger, Stable Cash Flows from Long-Term Leases,
integration plans and expected synergies, the expected benefits of the proposed REIT Conversion
and Merger, anticipated future financial and operating performance and results, including estimates of growth and value creation, and the expected timing of completion of the
note that the combined company’s actual results could be materially different from those
projected in such forward-looking statements. There are a number of risks and uncertainties that could
cause actual results to differ materially from the forward-looking statements. Other unknown or
unpredictable factors could also have material adverse effects on future results, performance or
filings with the SEC and are available at the SEC’s website at http://www.sec.gov, including Item
1A. Risk Factors in the Annual Report on Form 10-K for the year ended December 31, 2011 of
W. P. Carey & Co. LLC as filed with the SEC on February 29, 2012. These risks, as well as other
risks associated with the proposed REIT Conversion and Merger, are more fully discussed in the
Joint Proxy Statement/Prospectus that is included in the Registration Statement on Form S-4 that
W. P. Carey Inc. filed with the SEC in connection with the proposed REIT Conversion and Merger
on March 23, 2012, as amended. In light of these risks, uncertainties, assumptions and factors, the forward-looking events discussed in this communication may not occur. Readers are
cautioned not to place undue reliance on these forward-looking statements, which speak only as of
the date of this communication. Except as required under the federal securities laws and the
or circumstances after the date of this communication or to reflect the occurrence of unanticipated
events.
Non-GAAP Financial Disclosure We
believe that earnings before interest, taxes, depreciation and amortization (“EBITDA”) is a useful supplemental measure to investors and analysts for assessing the performance of our
business segments, although it does not represent net income that is computed in accordance with GAAP,
because it removes the impact of our capital structure and asset base from our operating
results and because it is helpful when comparing our operating performance to that of companies in our industry without regard to such items, which can vary substantially from
company to company. Adjusted EBITDA as disclosed represents EBITDA, as described herein,
modified to include other adjustments to GAAP net income for certain non-cash charges such as
estate, foreign exchange and derivatives which are not considered fundamental attributes of our
business plans and do not affect our overall long-term operating performance. We exclude these
items from Adjusted EBITDA as they are not the primary drivers in our decision making process.
Our assessment of our operations is focused on long-term sustainability and not on such non-
cash items, which may cause short term fluctuations in net income but have no impact on cash flows. We
believe that Adjusted EBITDA is a useful supplemental measure to investors and analysts for
assessing the performance of our business segments, although it does not represent net income that is computed in accordance with GAAP. Accordingly, EBITDA and Adjusted
EBITDA should not be considered as alternatives to net income as indicators of our financial
performance. EBITDA and Adjusted EBITDA may not be comparable to similarly titled measures of
other companies. Therefore, we use EBITDA and Adjusted EBITDA as two of the measures of our operating
performance when we formulate corporate goals, evaluate the effectiveness of our strategies,
and determine executive compensation. Funds from operations (“FFO”) is a non-GAAP measure defined by the National Association
of Real Estate Investment Trusts (“NAREIT”). NAREIT defines FFO as net income or loss (as
computed in accordance with GAAP) excluding: depreciation and amortization expense from real estate
assets, impairment charges on real estate, gains or losses from sales of depreciated real
estate assets and extraordinary items; however FFO related to assets held for sale, sold or otherwise
transferred and included in the results of discontinued operations are included. These
adjustments also incorporate the pro rata share of unconsolidated subsidiaries. FFO is used by
management, investors and analysts to facilitate meaningful comparisons of operating performance
between periods and among our peers. Although NAREIT has published this definition of FFO, companies
often modify this definition as they seek to provide financial measures that meaningfully
reflect their distinctive operations. We modify the NAREIT computation of FFO to include other
adjustments to GAAP net income to adjust for certain non-cash charges such as amortization of
intangibles, deferred income tax benefits and expenses, straight-line rents, stock compensation,
gains or losses from extinguishment of debt and deconsolidation of subsidiaries and unrealized
foreign currency exchange gains and losses. We refer to our modified definition of FFO as adjusted
funds from operations (“AFFO”). We exclude these items from GAAP net income as they are
not the primary drivers in our decision making process. Our assessment of our operations is focused on
long-term sustainability and not on such non-cash items, which may cause short-term
fluctuations in net income but have no impact on cash flows, and we therefore use AFFO as one measure
of our operating performance when we formulate corporate goals, evaluate the effectiveness of
our strategies, and determine executive compensation. We believe that AFFO is a useful supplemental measure for investors to consider because it will help them to better
assess the sustainability of our operating performance without potentially distorting the impact of
these short-term fluctuations. However, there are limits on the usefulness of AFFO to investors.
For example, impairment charges and unrealized foreign currency losses that we exclude may become
actual realized losses upon the ultimate disposition of the properties in the form of lower
cash proceeds or other considerations.
|
 Investing
for
the
Long
Run™|
3
•
Largest owner/manager of triple net lease assets
•
Superior credit and real estate underwriting platform leveraged
across various industries and property types
•
Stable cash flows from long-term leases to creditworthy tenants
•
Solid
stream
of
fee
income
from
$7.5
billion
of
AUM
(1)
•
Access to capital (both public and private) provides capacity for
growth
•
Well-covered, stable dividend; expectation for continued growth
(1)
Excludes
CPA
®
:15
and
includes
cash
and
distributions
payable
as
of
June
30,
2012.
Investment
Highlights |
 Background :
W. P. Carey & Co. LLC
(1)
Past performance does not indicate future results.
Investing for the Long Run™
| 4
•
Founded in 1973 and publicly
listed since 1998, W. P. Carey is
a leading global real estate firm
specializing in sale-leaseback
investments of corporate-owned
real estate worldwide
•
The Company’s REIT conversion
will expand its owned real estate
asset base and provide a
platform for future growth |
 Our
Post-Merger Business Model
Manages
CPA
®
REITs
and
CWI
•
Manages $7.5 billion of net-leased real
estate
•
Generates approximately 17% of its
revenue in fee income from managing the
day-to-day operations of its real estate
investments
(3)
Owns
Diversified Net Lease Portfolio
•
Owns $5 billion of net-leased real
estate
(1)
•
Generates approximately 83% of its
revenue through rental income from
its owned assets
(2)
(1)
Includes
assets
for
WPC
and
CPA
®
:15
on
a
combined
basis
plus
cash
on
hand.
(2)
Revenues from real estate ownership = pro-rata net lease revenues.
(3)
Revenues
from
investment
management
=
asset
management
revenue
+
structuring
revenue.
(4)
Including our pro rata share of revenue from equity investments.
(5)
Excludes
reimbursed
costs
from
affiliates.
Investing for the Long Run™| 5
Combined
Company
2012E
Revenues
(4),
(5) |
 Investing for the Long Run™
| 6
•
Generate attractive risk-adjusted returns by
identifying growing companies with real estate
assets globally
•
Create upside through lease escalations, credit
improvements and real estate appreciation
•
Protect downside by combining credit and real
estate underwriting with sophisticated structuring
and direct origination
•
Evaluate each transaction on:
creditworthiness of tenant
strategic importance of the asset to the tenant
the underlying value of the real estate
the transaction’s structure and pricing
Investment
Strategy |
 Investing for the Long Run™
| 7
•
Alternative form of financing
•
Company sells its real estate for cash and enters into long-term lease
•
Long-term leases translate into steady cash flow
Sale-Leaseback
Process |
 Combined company market capitalization
of approximately $5 billion
High-quality portfolio of premium assets
Investing for the Long Run™| 8
Combined Portfolio by Property Type
(3)
Combined Portfolio by Geography
(3)
(1) Reflects square feet on a pro rata basis. Excludes 20 domestic
self-storage properties in our Carey Storage subsidiary, totaling
approximately
0.5
million
square
feet
on
a
pro
rata
basis.
(2) Based on percentage of the portfolio’s total pro rata square footage
that was subject to lease. (3) Based on Annualized Contractual Minimum
Base Rent (“ABR”). (4)
Other
includes:
Child
Care
and
Social
Services;
Education;
Hospitality;
Sports;
Theater;
and
Unoccupied
Land.
REIT Conversion:
The Next Chapter
•
429 properties
•
39.1 million square feet
(1)
•
High-quality tenant base
•
97.6% occupancy
(2)
•
Diversified portfolio across geographies,
industries and property types
•
Average lease term of 8.9 years |
 Investing for the Long Run™
| 9
Geographically
Diversified Portfolio |
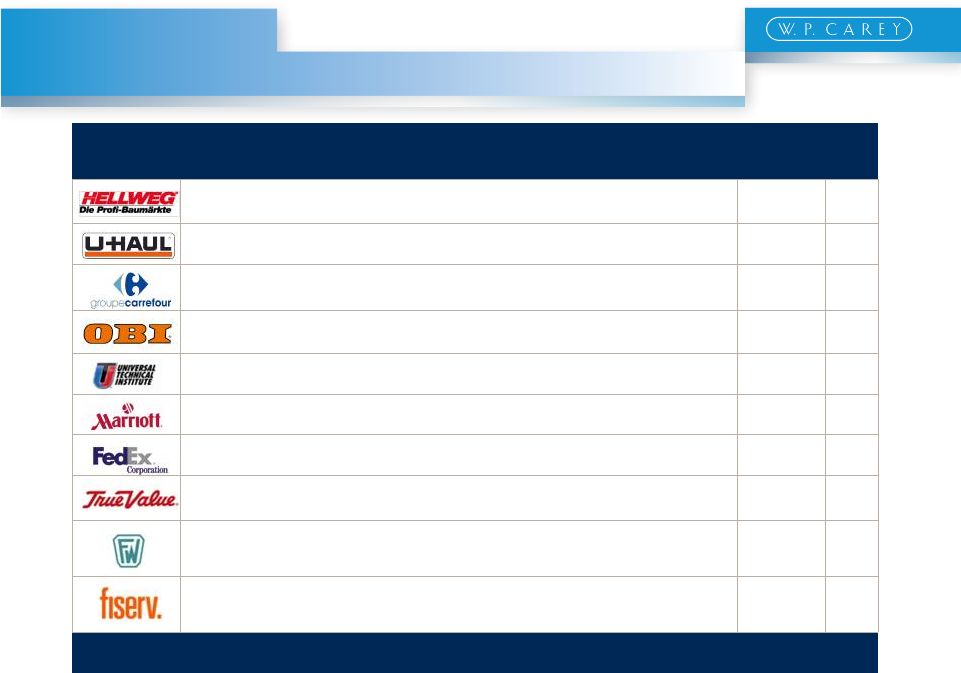 Annualized
Rent ($’000)
% of
Total
Leading German Do-It-Yourself (DIY) retailer with a broad footprint across
Germany and Austria $24,813
8.2%
North America’s largest DIY moving and storage operator with nearly 16,000
locations across the U.S. and Canada; Annual revenues in excess of $2
billion 18,741
6.2%
World’s second-largest food retailer, based on sales, with over 15,000
stores across Europe, Asia and South America; Annual sales of
approximately $115 billion 15,774
5.2%
Leading European DIY retailer with more than 530 stores in central and eastern
Europe Private company owned by the Tengelmann Group
12,743
4.2%
Provides post-secondary education for professional automotive, collision
repair, motorcycle and marine technicians; Annual revenues in excess of
$100 million 10,065
3.3%
Leading
lodging
company
with
more
than
3,700
lodging
properties
in
73
countries;
Annual
revenues
in excess of $12 billion
8,406
2.8%
220
countries; Annual revenues in excess of $41 billion
7,433
2.4%
One of the largest retailer-owned hardware cooperatives with more than 4,700
stores worldwide 7,101
2.3%
Foster Wheeler is a leading international engineering, construction and project
management contractor and power equipment supplier; Annual revenues of
approximately $4.5 billion 6,510
2.1%
A leading global provider of information management and electronic commerce
systems for the financial services industry, with more than 16,000 clients
worldwide; Annual revenues in excess of $4 billion
5,342
1.8%
Top 10 Total
$116,928
38.5%
Investing for the Long Run™| 10
Note: Company financial and valuation metrics as per CapitalIQ.
Major Tenants –
Established Corporate Credits
Top 10 Tenants – Combined Company
World's #1 express transportation provider, delivering more than 8 million packages daily to |
 Investing for the Long Run™
| 11
Stable Cash Flows
from Long-Term Leases
Lease Maturity Schedule (Combined Company)
•
Average lease term of 8.9 years
•
Low near-term rollover: 9.5% through 2014 |
 •
99% of leases include either fixed or CPI-based rent increases or percentage
rent Investing for the Long Run™
| 12
Internal Growth from
Built-In Rent Increases
Built-In
Contractual
Rent
Increases
(Combined
Company)
(1)
(1) Based on annualized base rents and exchange rates as of June 30,
2012. |
 Financial
Results |
 Financial
Highlights
Investing for the Long Run™
| 14
•
Broad access to equity capital
–
Public –
REIT conversion will likely increase liquidity and access to public capital
–
Private
–
W.
P.
Carey
has
raised
$2.3
billion
via
CPA
®
:17-Global,
its
latest
non-
traded CPA
®
REIT offering
(1)
•
Conservative capital structure
–
Net Debt to Total Market Cap of 39%
–
Strategic use of non-recourse leverage
•
Well-covered dividend
–
WPC has increased quarterly dividends each of the past 45 consecutive
quarters –
Annual dividend growth has averaged 2.4% from 1998–2011
•
Matching debt financing and rental income currency to mitigate risk
(1)
As of June 30, 2012. |
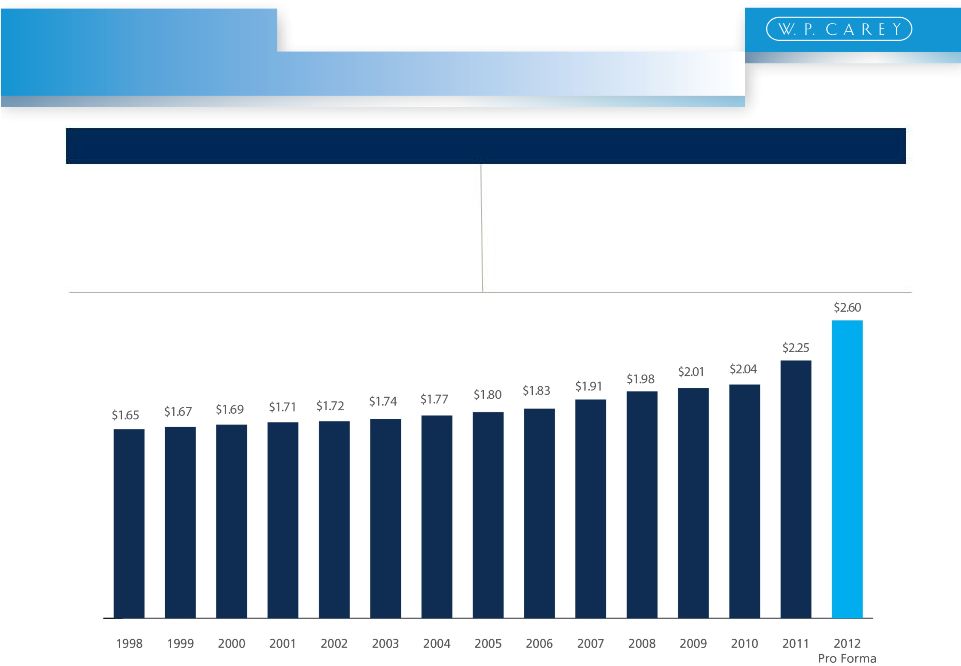 Annualized Dividend per Share
Note: Annualized dividend per share reflects annualized fourth quarter
dividend per share for the respective year. Note: Past performance does not
guarantee future results. (1)
Reflects pro forma annual dividend per share following transaction close to
maintain compliance with REIT requirements. Subject to modification.
Combined Company
Supports Continued Dividend Growth
Investing for the Long Run™
| 15
Pro Forma Dividend Well Covered
•
Payout ratio of 68%, based on results through
June 30, 2012 and current dividend of $2.27 per
share
•
Pro forma dividend of $2.60 supported by a
strong payout ratio of 70%
(1)
Consistent Historical Growth
•
W. P. Carey has increased its dividend every
year since going public in 1998
•
Transaction expected to be accretive to both
AFFO and CAD per share, providing for
continuation of stable dividend growth |
 Investing for the Long Run™
| 16
Note: Past performance does not guarantee future results.
(1)
Does not include special dividends.
Dividend is
Well-Covered
Payout
Ratio
63%
51%
71%
55%
56%
63%
65%
62%
46%
Funds
from
Operations
Coverage
(1) |
 Investing for the Long Run™
| 17
Note: Past performance does not guarantee future results.
Source: SNL Financial LC, Charlottesville, VA, 2012, www.snl.com
Returns have outpaced major indices, including the S&P 500 and the
FTSE NAREIT Equity REIT Index
Five-Year Total
Return Comparison
Five-Year Total Return Comparison |
 CPA®
Program
Performance
Investing for the long run™
| 18
Program
Program Life
Total Return as
% of Original
Investment
Average Annual
Total Return
IRR
CPA
®
:1
1979-1998
237%
7.2%
7.0%
CPA
®
:2
1980-1998
369%
14.9%
13.2%
CPA
®
:3
1981-1998
408%
18.8%
15.1%
CPA
®
:4
1983-1998
310%
13.9%
12.2%
CPA
®
:5
1984-1998
210%
7.7%
8.6%
CPA
®
:6
1985-1998
264%
12.5%
10.6%
CPA
®
:7
1987-1998
215%
10.2%
9.8%
CPA
®
:8
1988-1998
229%
13.1%
11.5%
CPA
®
:9
1989-1998
184%
9.6%
9.3%
CPA
®
:10
1990-2002
208%
8.8%
8.6%
CPA
®
:11
1992-2004
242%
11.2%
9.6%
CPA
®
:12
1994-2006
236%
10.9%
9.4%
CPA
®
:14
1998-2011
217%
9.0%
8.2%
Average
13 years
256%
11.4%
10.2%
Note: Calculated assuming investment at program inception.
|
 Fees Earned from
Asset Management
Investing for the long run™
| 19
1)
2)
3)
WPC
earns
contractual
fees
as
Advisor
to
the
CPA
®
REITs
and
CWI
Acquisition Fee
(1)
4.5%
Asset Management Fee
(2)
0.5% per annum
Cash flow participation
(3)
10%
Back-end participation
15% of gain
We generally earn base asset management revenue of 0.5% of average invested
assets. We
generally
receive
structuring
revenue
of
up
to
an
average
of
4.5%
of
the
total
cost
of
all
investments
made
by
each
CPA
®
:
REIT.
For
certain
types
of
non-long
term
net
lease
investments
acquired on behalf of CPA
®
:17 –
Global, structuring revenue may range from 0% to 1.75% of the equity invested plus
the related structuring revenue. For CWI, we earn structuring revenue of 2.5%
of the total investment cost of the properties acquired.
We
receive
up
to
10%
of
distributions
of
available
cash
from
the
operating
partnerships
of
CPA
®
:16
–
Global,
CPA
®
:17
–
Global,
and
CWI,
which
is
defined
as
cash
generated
from
operations,
excluding
capital proceeds, as reduced by operating expenses and debt service, excluding
prepayments and balloon payments. |
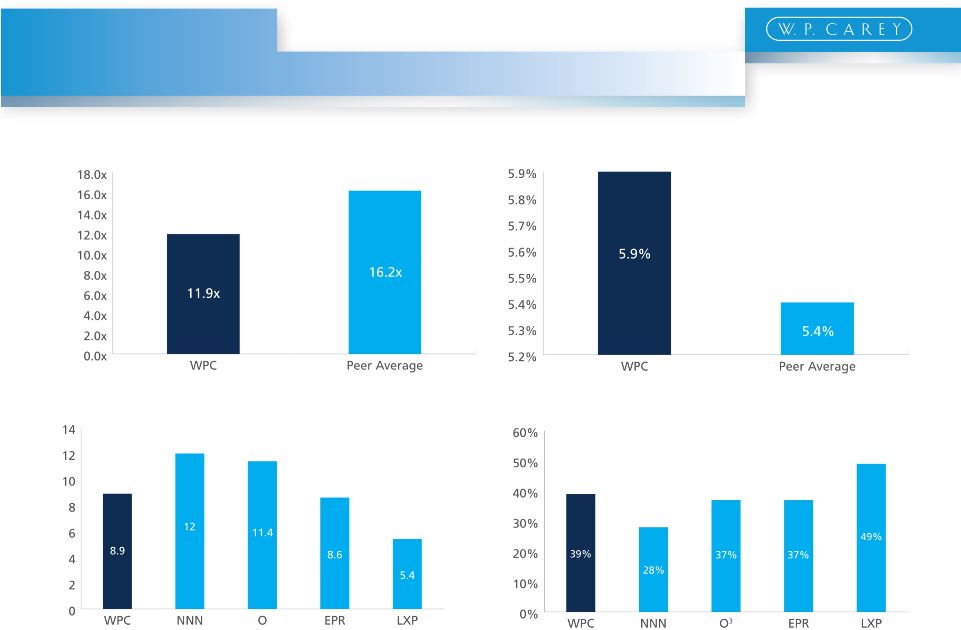 Investing for the Long Run™
| 20
1)
Based on September 12, 2012 closing prices, pro forma AFFO of $3.72 for WPC and
consensus estimates for peer group which includes NNN, O, EPR, and LXP.
Source: SNL Financial 2)
Based on September 12, 2012 closing prices, pro forma dividend of $2.60 for
WPC. 3)
O represents the proposed merger of Realty Income and American Realty Capital Trust.
Figures for the combined company O were obtained from its proposed merger
investor presentation. 4)
Book value debt was used for Debt / EV ratios
Peer Analysis
Price / AFFO
(1)
Dividend Yield
(2)
Weighted Average Lease Term (Yrs)
Leverage
(4)
3 |
 Investing for the Long Run™
| 21
Strong Pro Forma
Balance Sheet
Combined Company
1)
Based on annualized YTD June 2012 results.
2)
Based on September 12, 2012 closing price of $44.33.
3)
Includes outstanding recourse debt on the unsecured line of credit.
Equity Market Capitalization
$3.1 billion
Total Debt
$1.9 billion
Total Capitalization
$5.0 billion
Selected Metrics
Total Debt / Total Market Cap.
39%
Net Debt / Total Market Cap.
34%
Pro Rata Adjusted EBITDA
(1)
$391 million
Net Debt / Pro Rata Adjusted EBITDA
Pro Forma Dividend
Pro Forma AFFO Per Share
Dividend Yield
(2)
5.9%
Dividend Payout
69.9%
% Investment Grade Tenants
30.4%
Combined Company Metrics
Debt Maturity Schedule
4.46x
$2.60
$3.72 |
 The
Transaction |
 Benefits of the Merger
Investing for the Long Run™
| 23
Benefits of the
Transaction
Likely increased Wall Street research
coverage
Potential inclusion in REIT indices
Shareholders’
ability to benchmark W. P.
Carey against similar triple net lease REITs
Increased float and liquidity
Enhances W. P. Carey’s access to capital
markets
Creates better currency to pursue potential
future growth opportunities
Provides simplified tax reporting for
shareholders
Creates potential long-term valuation benefits
including:
Benefits of REIT Conversion
Supports W. P. Carey’s overall strategy and
significantly grows W. P. Carey’s high-quality
real estate asset base
Substantially increases W. P. Carey’s
scale
and
liquidity
–
pro forma equity value
of approximately $3 billion
Provides platform for future growth
Expected to be accretive to AFFO and CAD
per share, further improving coverage of W.
P. Carey’s secure dividend
Increases income contribution from owned
properties while preserving asset
management platform
Enhances W. P. Carey’s world-class asset
management platform |
 Key
Operational Metrics as of June 30, 2012
Investing for the long run™
| 24
AFFO/MFFO ($m)
(a)
Per share
135.8
$3.33
115.1
$0.88
Pro Rata Adjusted EBITDA ($m)
(a)
Per share
219.2
$5.37
187.0
$1.42
Annualized Contractual Minimum
Base Rent ($m)
84.7
219.4
Weighted Avg. Lease Term
6.4
9.9
Number of Properties
148
305
Square Footage (m)
11.6
27.5
Weighted Avg. Occupancy
94.4%
99.1%
Top 10 Tenant Concentration
54.8%
48.3%
% of Investment Grade Tenants
47.0%
24.0%
LLC
CPA
®
: 15
WPC
“LLC”
represents
the
actual
results
for
the
six
months
ended
June
30,
2012
or
the
current
position
as
of
June
30,
2012.
“CPA
®
”
represents
the
actual
results
for
the
six
months
ended
June
30,
2012
or
the
current
position
as
of
June
30,
2012.
“WPC”
represents the pro forma results for the six months ended June 30, 2012 or the pro
forma position as of June 30, 2012, had the All portfolio information
contained herein is based on pro rata annualized contractual minimum based rent and pro rata square footage.
Based on annualized YTD June 2012 results..
256.7
$3.72
391.4
$5.67
304.1
8.9
429
39.1
97.6%
38.5%
30.4%
Basis of Presentation
•
•
•
•
merger occurred on January 1, 2012.
15
:
a) |
 APPENDIX |
 Investing for the Long Run™
| 26
Blue Cross and Blue Shield of Minnesota
Facility Type
Six-building headquarters campus
and two additional properties
Purchase Price
$169 million
Location
Minneapolis, Aurora and Virginia, MN
•
Blue Cross of Minnesota was chartered in 1933 as Minnesota's first health plan
•
Blue Cross health plan is the largest health plan in Minnesota with $2.8 billion
in total revenues and 41% market share
•
The company is a conservatively run organization with strong capitalization
and no long term debt
Investment
Strategy |
 Investing for the Long Run™
| 27
The New York Times Company
Facility Type
Global Headquarters
Purchase Price
$234 million
Location
New York City
•
Constructed for approximately $500 million in 2007
•
Purchased for $234 million -
40% of the appraised value of the asset
•
15-year lease, initial cap rate of 10.75%, fixed annual escalations
•
Facility houses NYT’s senior executive team and main news desk –
critical to the entire enterprise
•
Transaction closed in March 2009
Investment
Strategy |
 Investing for the Long Run™
| 28
C1000 B.V.
Facility Type
Portfolio of 6 logistics properties leased
on a long-term triple net basis
Purchase Price
$208 million
Location
Netherlands
•
C1000
B.V.
is
a
leading
Dutch
supermarket
with
371
stores
across
the
Netherlands
•
Portfolio of 6 logistics properties represents the complete distribution network
of C1000, supplying all of its supermarket stores in the country
•
C1000 and its franchisee network comprise the second largest food retailer
in the Netherlands
•
Annual sales of €3.7 billion
Investment
Strategy |
 Investing for the Long Run™
| 29
Metro A.G.
Facility Type
20 cash and carry stores
Purchase Price
$396 million
Location
Throughout Italy
•
Lease is guaranteed by its German parent company, Metro A.G.
•
Metro A.G. is the world’s largest cash and carry operator and third largest
retailer, with 2011 revenues totaling €66 billion
•
Facilities represent half of Metro’s Italian presence
Investment
Strategy |
 Case Study –
New Lease
Investing for the long run™
| 30
Google, Inc.
Venice, CA
Background
•
Acquirer:
WPC
•
Initial
Acquisition:
1994
•
Square
Feet:
67,682
•
Original
Tenant:
Omnicom
Group
•
Omnicom
Lease
Expiration:
9/2010
•
Annual
Rent:
$1.2M
($17.64
PSF)
Opportunity
•
Landmark Frank Gehry Designed
“Binoculars Building”
•
Omnicom opted not to renew
•
Communication w/Omnicom Management
provided early visibility on non-renewal
•
Enforced deferred maintenance
•
Commenced marketing with Omnicom still
on lease
•Worked With Adjacent Landlords to Create a 200,00
SF Campus, Transforming Downtown Venice
•Landlord & tenant contributed capital for gut
renovation
•15-year lease, Annual Rent ~$30 PSF •Limited Downtime: Less than 4 months of vacancy
•Placed $24M,
15-year, Non-Recourse Mortgage @ 5.15%
Outcome |
 Case Study –
Opportunistic Disposition
Investing for the long run™
| 31
Best Buy Co. Inc.
National Big Box Portfolio
Background
•
Acquirer:
CPA
®
:14
(37%)
&
CPA
®
:15
(63%)
•
Initial
Acquisition:
1993
•
Acquisition
Cost:
$46M
•
Square
Feet:
452,348
(12
stores)
•
Annual
Rent:
$4.2M
($17.64
PSF)
•
Remaining
Lease
Term:
6.5
years
Opportunity
•
Partial renewal rights
•
Above-market contract rent
•
Strong avg. store sales, but wide range
•
70% of rent from large-format stores
•
BBY telegraphed shift from large format
•
Sold Portfolio on 9/1/11 for $53.3M (7.7% cap, $118 PSF)
•
Retail REIT capital imbalance: Lack of retail product
•
Challenging $23M mortgage maturity in 2012
•
Ran accelerated marketing process
•
BBY subsequently downgraded to BB+ on 8/6/12, 4 stores
already closed, 30% of rent
Outcome |
 Case Study –
Opportunistic Disposition
Investing for the long run™
| 32
Médica France, S.A.
Nursing Homes in France
Background
•
Acquirer:
WPC
(46%)
&
CPA
®
:15
(54%)
•
Initial
Acquisition:
2002
•
Acquisition
Cost:
$43.5M
•
Square
Feet:
336,923
(6
nursing
homes)
•
Annual
Rent:
$6.2M
($18.40
PSF)
•
Remaining
Lease
Term:
9.5
years
Opportunity
•
Lease extended to 12 years in 2009
•
Exchange Rate €1:$1.00 at acquisition,
€1:$1.34 at time of sale
•
20-year old assets would require significant
capex if leases not renewed
•
Beneficial tax structure began to erode
•
Assumable debt
•
Sold Portfolio on 4/11/12 for $74.5M (6.2% cap, $222
PSF)
•
Off-Market sale to large French REIT with expertise in
nursing homes
•
Buyer also funded 50% of tax costs
•
Buyer assumed in-place debt, saving $4.4M in prepayment
penalties
Outcome |
 Case Study –
Strategic Disposition
Investing for the long run™
| 33
Shoprite Supermarkets
Hudson Valley Area of NY
Background
•
Acquirer:
CPA
®
:14
(44%)
&
CPA
®
:15
(66%)
•
Initial
Acquisition:
1992,
1993
•
Acquisition
Cost:
$20.1M
•
Square
Feet:
196,590
(3
grocery
stores)
•
Annual
Rent:
$3.3M
($16.91
PSF)
•
Remaining
Lease
Term:
~12
years
Opportunity
•
Store Competition: Each location threatened by
pending Wal-Mart or Price Chopper
•
One strong store masked looming competition &
weak locations
•
Low renewal probability
•
$13.5M of near-term debt maturing, refi possible,
but not optimal value
•
10+ years of remaining term = liquidity
•
Sold Portfolio on 12/31/2011 for $37.1M (8.97% cap,
$228 PSF)
•
Able to market broadly as investment sale (lease term)
•
Sold at 5% premium to base case underwritten value, 20%
premium to downside case
•
Prior experience had shown potential for the degradation of
value
on
2
nd
generation
grocery,
exited
at
peak
valuation
Outcome |
 Case
Study
–
Early Lease Extension
Investing for the long run™
| 34
Dr. Pepper Snapple Group
Houston & Irving, TX
Background
•
Acquirer:
WPC
•
Initial
Acquisition:
1989
•
Acquisition
Price:
$28.4M
•
Original
SF:
721,947
(2
Bottling
Plants)
•
Current
Expanded
SF:
1.27
MSF
•
Annual
Rent:
$5.0M
($3.52
PSF)
•
Remaining
Lease
Term:
2
years
Opportunity
•
Critical facilities-tenant expanded each
facility over time with own capital
•
Irving is largest Dr. Pepper plant
•
Relationship w/Dr. Pepper management
opened dialog with Dr. Pepper supply chain
team
•
$26M mortgage maturing in 2015
Extended Lease on 8/8/12 to 17 yrs in Exchange for 10%
Immediate Rent Reduction
Increases unlevered DCF value by ~$6M vs. base case
Long-Lease Term = Attractive Long Term Financing Options
Refinancing will generate ~$12M in excess proceeds w/ long
amortization at historically low rates
Outcome |
 Investing for the Long Run™
| 35
W. P. Carey Inc.
Consolidated AFFO
AFFO Accretion / (Dilution) Per Share Buildup
Note: See next page for footnotes.
W. P. Carey Inc. Consolidated AFFO
30-Jun-12
W.
P.
Carey
Inc.
Shares
LLC
2012
Wtd
Avg.
Standalone
Shares
(per
10Q)
(a)
40,828,646
CPA
®
:15
2012
Wtd
Avg.
Standalone
Shares
(per
10Q)
(b)
131,657,978
Exchange Ratio
0.2326x
Shares Issued
28,192,415
W. P. Carey Inc. Shares Outstanding
69,021,061
$'000, except per share data
YTD Jun-12
$ Amount
$ / Share
Impact
Cumulative
Acc / (Dil)
YTD Jun-12
AFFO / Share
Annualized
AFFO / Share
W. P. Carey Inc. AFFO Calculation
Standalone LLC AFFO
(c)
67,892
1.66
1.66
3.33
Primary Accretion / (Dilution) Drivers
1. Dilutive Impact of New Share Issuance
-
(0.68)
(0.68)
0.98
1.97
2. CPA
®
:15
Contribution to
New Co
AFFO
(d)
57,367
0.83
0.15
1.81
3.63
3. (+)
Provision
for
income
taxes
(e)
Tax Savings from foregone Asset Mgmt Revenues
6,354
0.09
0.24
1.91
3.81
4. (+) Deferred taxes
(e)
Lost taxes deferred on CPA
:15 mgmt fees paid in shares
2,200
0.03
0.28
1.94
3.88
5. (+)
Distributions
from
Equity
Investments
in
CPAs
(f)
Foregone AFFO proceeds from LLC's CPA
:15 investment
(4,540)
(0.07)
0.21
1.87
3.75
Adjustments for Primary Accretion / (Dilution) Drivers
61,381
0.21
0.21
1.87
3.75
Acquisition Debt Interest Expense Impact
6. (-) Interest expense
(g)
Acquisition Debt Interest Expense
(944)
(0.01)
0.20
1.86
3.72
Adjustments for Acquisition Debt Interest Expense Impact
(944)
(0.01)
0.20
1.86
3.72
Elimination
of
Asset
Management
Fees
7. (-)
Asset
Management
Revenue
(h)
LLC Fee Revenues no longer received from CPA
:15
(12,418)
(0.18)
0.02
1.68
3.36
8. (+) Property expenses
(h)
CPA 15 Mgmt Fee Expense No Longer paid to LLC
12,418
0.18
0.20
1.86
3.72
Adjustments for Elimination of Management Fees
-
-
0.20
1.86
3.72
W. P. Carey Inc. Consolidated AFFO
128,329
1.86
0.20
1.86
3.72
®
®
®
® |
 a)
Per W. P. Carey’s Form 10-Q for the period ended June 30, 2012.
b)
Per CPA
®
:15’s Form 10-Q for the period ended June 30, 2012.
c)
For
a
reconciliation
of
W.
P.
Carey’s
Net
Income
for
the
six
months
ended
June
30,
2012
to
Funds
from
Operations
–
as
Adjusted
(AFFO),
see W. P. Carey ’s Form 10-Q for the period ended June 30, 2012.
d)
CPA
®
:15’s
contribution
to
W.
P.
Carey,
Inc.
AFFO
represents
MFFO
of
$57.5
million
as
filed
in
CPA
®
:15’s
Form
10-Q
for
the
period
ended
June 30, 2012, adjusted by $0.2 million related to acquisition expenses and
accretion of discounts and amortization of premiums on debt
investments.
For
a
reconciliation
of
CPA
®
:15’s
Net
Income
Attributable
to
CPA
®
:15
Stockholders
for
the
six
months
ended
June
30,
2012
to
Modified
Funds
from
Operations
(MFFO),
please
see
CPA
®
:15’s
Form
10-Q
for
the
period
ended
June
30,
2012.
e)
In
light
of
the
pending
merger
of
CPA
®
:15
and
W.
P.
Carey,
asset
management
and
other
taxable
revenues
have
been
eliminated.
The
adjustments of $6.4 million and $2.2 million for the six months ended June 30, 2012
reflect tax benefits related to the elimination of these transactions.
f)
Reflects
adjustment
to
eliminate
the
impact
on
AFFO
of
distributions
from
W.
P.
Carey’s
equity
investment
in
CPA
®
:15
as
a
result
of
the
pending merger.
g)
Reflects
an
increase
in
interest
expense
of
$0.9
million
for
the
six
months
ended
June
30,
2012
from
the
$175
million
new
line
of
credit
and
expected repayment of $113 million of the pre-existing line of credit.
h)
Reflects
adjustments
to
eliminate
activities
between
W.
P.
Carey
and
CPA
®
:15
in
the
respective
historical
financial
statements,
as
all
such
revenues, expenses and interests would have been eliminated in consolidation had
the merger occurred on January 1, 2011. Investing for the Long Run™ | 36
W. P. Carey Inc.
Consolidated AFFO: Footnotes |
 Investing for the Long Run™
| 37
W. P. Carey Inc.
Consolidated EBITDA
Note: See next page for footnotes.
EBITDA Per Share
W. P. Carey Inc. Pro Rata Adjusted EBITDA
$'000, except per share data
YTD Jun-12
$ Amount
$ / Share
Impact
Cumulative
Acc / (Dil)
YTD Jun-12
EBITDA / Share
Annualized
EBITDA / Share
W. P. Carey Inc. Adjusted EBITDA Calculation
Standalone LLC EBITDA
(a)
72,614
1.78
1.78
3.56
Proportionate share of adjustments for joint ventures
1. Proportionate share of adjustments from equity method investments
(b)
34,496
0.84
2.62
5.25
2. Proportionate share of adjustments for noncontrolling interests
(b)
(1,359)
(0.03)
2.59
5.18
Adjustment for joint ventures
33,137
0.81
2.59
5.18
Management adjustments)
3. (+) Impairments
6,727
0.16
2.75
5.51
4. (-) Gain on sale
(1,505)
(0.04)
2.72
5.44
5. (+) Stock Compensation
9,755
0.24
2.96
5.91
6. (+) Realized and Unrealized Loss on FX and Derivatives
542
0.01
2.97
5.94
7. (+) Merger Expenses
4,719
0.12
3.09
6.17
8. (-) Proportionate share of adjustments from equity method investments
(d)
(16,386)
(0.40)
2.68
5.37
Management adjustments
3,853
0.09
2.68
5.37
CPA
®
:15 contribution to EBITDA
9. (+) CPA
®
:15 EBITDA per 10Q
(e)
118,664
1.72
1.72
4.40
8.81
10. Proportionate share of adjustments from equity method investments
(b)
11,746
0.17
1.89
4.57
9.15
11. Proportionate share of adjustments for noncontrolling interests
(b)
(15,512)
(0.22)
1.66
4.35
8.70
12. (-) Management Adjustments
(c)
(21,398)
(0.31)
1.35
4.04
8.08
CPA®:15 contribution to EBITDA
93,500
1.35
1.35
4.04
8.08
Consolidation Adjustments
13. Dilutive Impact of New Shares Issuance
-
(1.10)
0.26
2.94
5.89
14. (-) Elimination of LLC's ownership in CPA
®
:15's Prorata Adjusted EBITDA
(f)
(7,387)
(0.11)
0.15
2.84
5.67
Consolidated Adjustments
(7,387)
(1.20)
0.15
2.84
5.67
Combined Adjusted EBITDA
195,718
2.84
0.15
2.84
5.67
(c) |
 a)
Per
W. P.
Carey’s
Form
8-K
disclosing
Supplemental
Unaudited
Operating
and
Financial
Data
for
the
period
ended
June
30,
2012.
b)
Incorporates the pro rata share of depreciation, amortization, interest and tax
provision adjustments for unconsolidated subsidiaries and joint
ventures.
c)
Represents adjustments to EBITDA to add impairments, stock compensation, merger
expenses, gain or losses on the sale of real estate, as well as, addback the
impact of realized and unrealized gains/losses related to foreign exchange and derivatives.
d)
Incorporates the pro rata share of management adjustments as described above for
unconsolidated subsidiaries and joint ventures. e)
Reflects
adjustments
to
eliminate
activities
between
W. P.
Carey
and
of
CPA
®
:15
in
the
respective
historical
financial
statements,
as
all
such
revenues, expenses and interests would have been eliminated in consolidation had
the merger occurred on January 1, 2012. f)
See
next
page
for
a
reconciliation
of
CPA
®
:15’s
Net
Income
for
the
six
months
ended
June
30,
2012
to
Adjusted
EBITDA.
Investing for the Long Run™
| 38
W. P. Carey Inc.
Consolidated EBITDA: Footnotes |
 a)
Per CPA
®
:15’s Form 10-Q for the period ended June 30, 2012.
b)
Incorporates the pro rata share of depreciation, amortization, interest and tax
provision adjustments for unconsolidated subsidiaries and joint
ventures.
c)
Represents adjustments to EBITDA to add impairments, stock compensation, merger
expenses, gain or losses on the sale of real estate, gain/loss on
extinguishment of debt, as well as, to addback the impact of realized and unrealized gains/losses related to foreign exchange and
derivatives.
d)
Incorporates the pro rata share of management adjustments for unconsolidated
subsidiaries and joint ventures. Investing for the Long
Run™| 39 W. P. Carey Inc.
Consolidated EBITDA: Footnotes
$'000
YTD Jun-12
Prorata Adjusted EBITDA Calculation
Net
income
attributable
to
CPA
®
:15
shareholders
(a)
54,458
Adjustments:
Depreciation and amortization
25,054
Interest expense
37,093
Provision for Income Taxes
2,059
CPA
®
:15 EBITDA
118,664
Proportionate
share
of
adjustments
from
equity
method
investments
(b)
11,746
Proportionate
share
of
adjustments
for
noncontrolling
interests
(b)
(15,512)
60,440
Prorata EBITDA
114,898
Management
adjustments:
(c)
Impairments
Loss on sale
(39,156)
Gain/Loss on extinguishment of debt
(474)
Stock compensation
-
Merger expenses
1,339
Realized and unrealized loss on foreign currency (net)
1,897
Realized and unrealized gain on derivatives (net)
(67)
Proportionate
share
of
adjustments
from
equity
method
investments
(d)
(10)
Proportionate
share
of
adjustments
for
noncontrolling
interests
(d)
15,073
Total adjustments
(21,398)
Pro rata Adjusted EBITDA
93,500 |