Attached files
| file | filename |
|---|---|
| 8-K - CURRENT REPORT OF MATERIAL EVENTS OR CORPORATE CHANGES - SUPERMEDIA INC. | a12-21459_18k.htm |
Exhibit 99.1
|
|
Lender Discussion Material September 18, 2012 |
|
|
Important Information For Investors And Security Holders This communication does not constitute an offer to sell or the solicitation of an offer to buy any securities or a solicitation of any vote or approval. The proposed merger transaction between SuperMedia Inc. (“SuperMedia”) and Dex One Corporation (“Dex One”) will be submitted to the respective stockholders of SuperMedia and Dex One. In connection with the proposed transaction, Newdex, Inc., a subsidiary of Dex One (“Newdex”), will file with the Securities and Exchange Commission (“SEC”) a registration statement on Form S-4 that will include a joint proxy statement/prospectus to be used by SuperMedia and Dex One to solicit the required approval of their stockholders and that also constitutes a prospectus of Newdex. INVESTORS AND SECURITY HOLDERS OF SUPERMEDIA AND DEX ONE ARE ADVISED TO CAREFULLY READ THE REGISTRATION STATEMENT AND JOINT PROXY STATEMENT/PROSPECTUS (INCLUDING ALL AMENDMENTS AND SUPPLEMENTS) AND OTHER RELEVANT DOCUMENTS FILED WITH THE SEC WHEN THEY BECOME AVAILABLE BECAUSE THEY WILL CONTAIN IMPORTANT INFORMATION ABOUT THE TRANSACTION, THE PARTIES TO THE TRANSACTION AND THE RISKS ASSOCIATED WITH THE TRANSACTION. A definitive joint proxy statement/prospectus will be sent to security holders of SuperMedia and Dex One seeking their approval of the proposed transaction. Investors and security holders may obtain a free copy of the joint proxy statement/prospectus (when available) and other relevant documents filed by SuperMedia and Dex One with the SEC from the SEC’s website at www.sec.gov. Copies of the documents filed by SuperMedia with the SEC will be available free of charge on SuperMedia’s website at www.supermedia.com under the tab “Investors” or by contacting SuperMedia’s Investor Relations Department at (877) 343-3272. Copies of the documents filed by Dex One with the SEC will be available free of charge on Dex One’s website at www.dexone.com under the tab “Investors” or by contacting Dex One’s Investor Relations Department at (800) 497-6329. SuperMedia and Dex One and their respective directors, executive officers and certain other members of management may be deemed to be participants in the solicitation of proxies from their respective security holders with respect to the transaction. Information about these persons is set forth in SuperMedia’s proxy statement relating to its 2012 Annual Meeting of Shareholders and Dex One’s proxy statement relating to its 2012 Annual Meeting of Stockholders, as filed with the SEC on April 11, 2012 and March 22, 2012, respectively, and subsequent statements of changes in beneficial ownership on file with the SEC. These documents can be obtained free of charge from the sources described above. Security holders and investors may obtain additional information regarding the interests of such persons, which may be different than those of the respective companies’ security holders generally, by reading the joint proxy statement/prospectus and other relevant documents regarding the transaction (when available), which will be filed with the SEC. |
|
|
Forward-Looking Statements Certain statements contained in this document are "forward-looking statements" subject to the safe harbor created by the Private Securities Litigation Reform Act of 1995, including but not limited to, statements about the benefits of the proposed transaction and combined company, including future financial and operating results and synergies, plans, objectives, expectations and intentions and other statements relating to the proposed transaction and the combined company that are not historical facts. Where possible, the words "believe," "expect," "anticipate," "intend," "should," "will," "would," "planned," "estimated," "potential," "goal," "outlook," "may," "predicts," "could," or the negative of such terms, or other comparable expressions, as they relate to Dex One, SuperMedia, the combined company or their respective management, have been used to identify such forward-looking statements. All forward-looking statements reflect only Dex One’s and SuperMedia’s current beliefs and assumptions with respect to future business plans, prospects, decisions and results, and are based on information currently available to Dex One and SuperMedia. Accordingly, the statements are subject to significant risks, uncertainties and contingencies, which could cause Dex One’s, SuperMedia’s or the combined company’s actual operating results, performance or business plans or prospects to differ materially from those expressed in, or implied by, these statements. Factors that could cause actual results to differ materially from current expectations include risks and other factors described in Dex One’s and SuperMedia’s publicly available reports filed with the SEC, which contain discussions of various factors that may affect the business or financial results of Dex One, SuperMedia or the combined company. Such risks and other factors, which in some instances are beyond either company’s control, include: the continuing decline in the use of print directories; increased competition, particularly from existing and emerging digital technologies; ongoing weak economic conditions and continued decline in advertising sales; the companies’ ability to collect trade receivables from customers to whom they extend credit; the companies’ ability to generate sufficient cash to service their debt; the companies’ ability to comply with the financial covenants contained in their debt agreements and the potential impact to operations and liquidity as a result of restrictive covenants in such debt agreements; the respective companies’ ability to refinance or restructure their debt on reasonable terms and conditions as might be necessary from time to time; increasing interest rates; changes in the companies’ and the companies’ subsidiaries credit ratings; changes in accounting standards; regulatory changes and judicial rulings impacting the companies’ businesses; adverse results from litigation, governmental investigations or tax related proceedings or audits; the effect of labor strikes, lock-outs and negotiations; successful realization of the expected benefits of acquisitions, divestitures and joint ventures; the companies’ ability to maintain agreements with major Internet search and local media companies; the companies’ reliance on third-party vendors for various services; and other events beyond their control that may result in unexpected adverse operating results. With respect to the proposed merger, important factors could cause actual results to differ materially from those indicated by forward-looking statements included herein, including, but not limited to, the ability of Dex One and SuperMedia to consummate the transaction on the terms set forth in the merger agreement; the risk that anticipated cost savings, growth opportunities and other financial and operating benefits as a result of the transaction may not be realized or may take longer to realize than expected; the risk that benefits from the transaction may be significantly offset by costs incurred in integrating the companies; potential adverse impacts or delay in completing the transaction as a result of obtaining consents from lenders to Dex One or SuperMedia; failure to receive the approval of the stockholders of either Dex One or SuperMedia for the transaction; and difficulties in connection with the process of integrating Dex One and SuperMedia, including: coordinating geographically separate organizations; integrating business cultures, which could prove to be incompatible; difficulties and costs of integrating information technology systems; and the potential difficulty in retaining key officers and personnel. These risks, as well as other risks associated with the merger, will be more fully discussed in the joint proxy statement/prospectus included in the registration statement on Form S-4 that Newdex intends to file with the SEC in connection with the proposed transaction. None of Dex One, SuperMedia or the combined company is responsible for updating the information contained in this presentation beyond the presentation date. |
|
|
Transaction Overview |
|
|
Transaction Objective Improve Positioning for Growth National scale and scope Greater market share Improve Quality and Productivity Achieve a complete suite of social, mobile and local solutions Capture marketing consultant expertise and best practices Apply best technology systems and platforms, operating processes, tools and client care techniques Strengthen the Balance Sheet Expense synergies Efficient use of tax assets Enhance cash flow Extend runway for payment of senior debt Accelerate the Transformation of the Companies |
|
|
Summary Transaction Terms Structure • Stock for stock merger in which SuperMedia stockholders exchange existing shares for shares in the new combined company, Dex Media • Implement 1-5 reverse split Exchange Ratio / Ownership Split • 40% SuperMedia / 60% Dex One Name • Dex Media, Inc. (publicly-traded successor to Dex One) Governance • 11 member board - 5 appointed by SuperMedia - 5 appointed by Dex One - 1 independent to be selected jointly Chairman • Alan Schultz (Dex One) Management • CEO: Peter McDonald (SuperMedia) • CFO: Dee Jones (SuperMedia) • Remaining management to be determined by representatives of each board and Peter McDonald Estimated Synergies • $150–175MM of annual run-rate expense synergies • $175–225MM of cash flow due to preservation of Dex One tax attributes Loan Modifications to be Sought • SuperMedia lenders agree to extend maturity by one year from December 31, 2015 to December 31, 2016, as well as modify certain other provisions • Dex One lenders at all 3 silos agree to extend maturities by 26 months from October 24, 2014 to December 31, 2016, as well as modify certain covenants, amortization requirements and certain other provisions Tax Sharing • The SuperMedia silo will have the ability to utilize savings resulting from Dex One’s tax attributes, subject to a tax sharing agreement where the SuperMedia silo will retain 25% of any tax savings and the Dex One silos will benefit from 75% of the tax savings Shared Services • New shared services agreement to allocate corporate and other shared services among the subsidiaries similar to existing Dex One agreement Trading Restrictions • Trading restrictions for 5% shareholders to preserve tax assets • Restrictions can be removed at the Board’s option and in certain circumstances may be removed after closing of the merger |
|
|
Condensed Pro Forma Corporate Structure Dex East, Inc. 2012E Net Debt: $489MM 2012E EBITDA: $162MM 2012E PF EBITDA: $188MM Net Leverage Stand-alone: 3.0x PF East: 2.6x Dex West, Inc. 2012E Net Debt: $452MM 2012E EBITDA: $184MM 2012E PF EBITDA: $214MM Net Leverage Stand-alone: 2.4x PF West: 2.1x Dex One Shareholders RHD, Inc. 2012E Net Debt: $731MM 2012E EBITDA: $215MM 2012E PF EBITDA: $247MM Net Leverage Stand-alone: 3.4x PF RHDI: 3.0x Illustrative 2012E Pro Forma Corporate Structure Summary (1) Dex Media , Inc. (HoldCo) 2012E Net Debt: $219MM 40% Ownership 60% Ownership SuperMedia Shareholders SuperMedia, Inc. 2012E Net Debt: $1,366MM 2012E EBITDA: $534MM 2012E PF EBITDA: $622MM Net Leverage Stand-alone: 2.5x PF SuperMedia: 2.2x 2012E PF Net Debt: $3.3Bn 2012E PF EBITDA: $1.3Bn 2012E PF Net Leverage: 2.6x Note 1. Pro forma analysis assumes gross, run-rate synergies as of 2012 and excludes costs to achieve |
|
|
National Presence: Increased Scale & Scope More Than 3,100 Marketing Consultants Building Trusted Relationships and Delivering Results to Over 700,000 Local Businesses |
|
|
Peter McDonald Background SuperMedia: Sept. 2010-Present, CEO Implementing transformation from a product-focused yellow pages company to a customer-focused marketing consultant across all local media, including a complete suite of digital solutions Achieved significant cost reductions resulting in a 900bp EBITDA margin improvement (32% FY2010 to 41% in YTD2012). RH Donnelley: 2002-Sept. 2008, President & COO COO from 2004 Integrated acquisition of Dex Media ($1.6bn in revenues), generating synergies of $75 million (~10% of Dex Media’s operating costs). SBC Directory Operations: 2000-2001, $4.5bn in revenues, CEO Replaced SBC CEO, when McDonald’s Ameritech operation was acquired. Integrated SBC, Ameritech, Southern New England Telecom and PacTel directories Ameritech Publishing and Advertising: 1994-2000, $1bn revenues, CEO Launched one of industry’s first internet yellow pages operation in 1994: Smartpages.com Previously, CEO of Dontech (RH Donnelley/Ameritech JV), GM of Donnelley Information Publishing, AVP Planning & GM of Northeast region of RH Donnelley, GM of National Telephone Directory Corporation. More than 35 years of experience in the yellow pages industry and managed three of the major U.S. directory operations |
|
|
Financial Overview |
|
|
Pro Forma Financial Summary Declining print revenue and cash flow will continue to depress revenue and EBITDA over the near-term Synergies mitigate cash flow decline and provide company with time and resources to grow digital business Combined revenue from digital solutions will represent ~20% of total revenue in 2012 Notes 1. Pro forma analysis assumes gross, run-rate synergies as of 2012 and excludes costs to achieve 2.Adjusted EBITDA is determined by adjusting EBITDA to exclude (i) gain on debt repurchases, (ii) stock-based compensation expense and long-term incentive program, (iii) impairment charges and (iv) gain on sale of assets, net and (v) other non-recurring items 3.SuperMedia EBITDA contains add-back for stock-based compensation expense/LTI expense of $6 and $5 in 2011A and 2012E, respectively in order to make comparable to Dex One adjusted EBITDA metric 4.Historical and forecasted digital revenue for SuperMedia include approximately $17 million from a discontinued operation that was divested in August 2012. EBITDA forecasts also include an offsetting $17 million in expenses 2011A 2012E 2011A 2012E 2011A 2012E Revenue, net 1,642 1,371 1,481 1,304 3,123 2,675 Expenses 1,034 837 852 744 1,886 1,581 Run-Rate Synergies(1) - - - - (175) (175) Expenses 1,034 837 852 744 1,711 1,406 Adj. EBITDA(2) 608 534 629 560 1,412 1,269 SuperMedia(3,4) Dex One Pro Forma |
|
|
Pro Forma Projected Financial Performance Revenue $MM EBITDA $MM Net Debt $MM Growth (%): Print: (18.8) (20.6) (18.0) (18.0) (18.0) Digital: 14.0 26.8 24.7 22.1 21.2 Total: (14.3) (12.1) (6.8) (3.9) (0.3) Net Debt/Trailing EBITDA x SuperMedia Dex One Synergies SuperMedia Dex One |
|
|
Comparison to Stand-Alone Without Merger Pro Forma SuperMedia Net Debt SuperMedia Net Debt / Trailing EBITDA Ratio Dex One Net Debt Without Merger Pro Forma Dex One Net Debt / Trailing EBITDA Ratio |

|
|
Long-Term Revenue Forecasts The long term rate of decline in print revenues is based on an observed secular trend in the industry over the past 4-5 years The rate of revenue decline was exacerbated during 2008-2009 by the economic downturn 2011 reports by third party industry observers forecasted annual North American print yellow page revenue declines ranging from 12-16% during the projection period. Year-to-date 2012 print revenue declines, however, have exceeded these levels, which will also result in higher decline rates in 2013 Based on recent results and the observed longer term secular decline, management projections contemplate an -18% annual decline in print revenue over the forecast period The long term digital revenue growth forecast anticipates the company slightly outpacing the overall digital media industry annual growth rate of 18-21%(1) Enhancements to their social, local and mobile digital solutions will enable the companies to fully participate in the growing digital market SuperMedia’s digital growth rate is projected to lag Dex One’s by 9-12 months as SuperMedia’s 2012 initiatives are realized in revenue By 2014 the digital revenue growth rates are projected to converge Note Source: Forrester, BIA/Kelsey, Barclays, Borrell, company estimates 2011A 2012E 2013E 2014E 2015E 2016E 2011A 2012E 2013E 2014E 2015E 2016E 2011A 2012E 2013E 2014E 2015E 2016E Print & Direct Mail 1,320 1,068 841 690 566 466 1,406 1,145 919 754 618 507 2,726 2,213 1,761 1,444 1,184 975 Digital 159 240 334 416 508 615 273 253 291 363 443 537 432 493 625 779 951 1,153 Other 17 11 7 7 7 10 0 0 0 0 0 0 17 11 7 7 7 7 Allowances & Credits (16) (14) (15) (14) (14) (14) (37) (27) (24) (22) (21) (20) (53) (41) (39) (36) (35) (35) Net Revenue 1,481 1,304 1,167 1,098 1,066 1,077 1,642 1,371 1,186 1,095 1,040 1,023 3,123 2,675 2,353 2,193 2,107 2,100 Year-over-Year Growth Rates Print & Direct Mail -19% -21% -18% -18% -18% -19% -20% -18% -18% -18% -19% -20% -18% -18% -18% Digital 51% 39% 25% 22% 21% -7% 15% 25% 22% 21% 14% 27% 25% 22% 21% Net Revenue -12% -11% -6% -3% 1% -17% -13% -8% -5% -2% -14% -12% -7% -4% 0% Dex One SuperMedia Pro Forma Combined |

|
|
Consolidate and rationalize G&A functions Reduce directory printing, paper, production and distribution costs Rationalize real estate, reduce locations and adopt most efficient real estate management practices Consolidate and rationalize IT platforms, systems and operations Rationalize suppliers and achieve scale discounts Operations Standardize on single platforms and tools Apply best IP and solutions to reduce traffic acquisition costs, rationalize digital products and solutions and streamline and automate digital fulfillment Eliminate duplication in SEM networks and standardize agreements with distribution partners Rationalize suppliers and partners Rationalize development resources Eliminate duplicative business development efforts Digital Solutions Apply best practices to consulting approach, recruiting and training Adopt most effective segmentation, channel management and productivity practices Align compensation plans Rationalize overlapping and contiguous markets Go To Market Expected cumulative gross synergies of $535MM through 2016 Expense Synergies |
|
|
Cost to Achieve Synergies Expense synergies actions will be implemented in 2013 and ~70% of the run rate synergies are expected to be realized in 2014 Total cost to achieve synergies of ~$100-120 million offset by realization of synergy benefit over the same time period The combined company will benefit from the increased scale and cost efficiencies. The companies have conservatively not modeled any revenue synergies 2013E-2016E Expense Synergies Summary Expense Synergies Cumulative Net Synergies -17 87 262 437 Cumulative Gross Synergies 60 185 360 535 |
|
|
Vast majority of the synergies are associated with overhead and support functions Management expects ~70-80% of the annual synergies will be captured in shared service cost functions (see Appendix A for additional details on Amended Shared Services Agreement) Alvarez & Marsal Transaction Advisory Group, LLC (“A&M”) was retained by SuperMedia to evaluate management’s expense synergy estimates and the one-time costs to achieve. After substantial investment of time and resources of both SuperMedia and Dex One, A&M performed a detailed review of management’s estimates The results of A&M’s review have been considered by management in the synergy savings and one-time costs to achieve presented herein Expense Synergies Category Low High Description Print Product & Publishing 25 30 Paper, printing and distribution economies of scale & process/vendor management redundancies Digital Product Costs 20 25 Traffic acquisition efficiencies & fulfillment redundancies Sales, Marketing & Advertising 40 45 Channel management redundancies, training efficiencies, expense and headcount redundancies IT 20 25 Platform consolidation, vendor consolidation & support efficiencies Corporate & Operational Overhead 45 50 Headcount and occupancy redundancies, best practices efficiencies, additional outsourcing opportunities, management redundancies Total 150 175 |
|
|
Tax Asset Utilization Dex One expects to have tax attributes of ~$1.8 billion at 2012 year-end ~$900 million net operating losses (NOLs) ~$900 million intangible basis Provide $175-225 million of cash flow Transaction preserves Dex One tax attributes and allows them to offset earnings of the combined company Provides Dex One lenders with incremental cash flow and SuperMedia lenders with a portion of the overall tax savings Existing Dex One Tax Sharing Agreement will be left in place, with certain modifications Dex One entities are reimbursed amongst themselves for tax attributes at 50%, no reimbursement for tax attributes used to offset cancellation of indebtedness income SuperMedia will enter into new Tax Sharing Agreement with Dex One such that: The SuperMedia silo will reimburse the Dex One silos at 75% for tax attributes The SuperMedia silo will retain 25% of the tax savings Merger agreement contemplates trading restrictions for 5% shareholders to preserve tax attributes |
|
|
Shared Digital Strategy Each company expects to achieve approximately the same revenue from digital products and solutions in 2012 ($240 - $250 million per company) Over the past 2½ years, both companies have improved their digital operations Dex One has increased digital revenue by over 60% SuperMedia has improved digital profit contribution(1) margin from approximately 7% to 32% Over the past 18 months both companies have enhanced their digital go-to-market strategy Filled out their digital product offerings Re-educated their go-to-market teams to be digital marketing consultants Begun offering bundled solutions to provide digital presence and performance (leads) Initial focus has been on penetrating existing print client base Establishing digital relationships with existing and new local business customers will be the driver for profitable market share growth Note 1. Profit contribution is a non-GAAP metric of revenue less direct and indirect expenses. |
|
|
Foundation For Digital Growth The companies will share and employ proven capabilities to improve combined digital revenue growth and contribution margin to improve cash flow Rationalize and enhance digital products Apply most effective bundling and pricing practices Achieve quality and cost improvements in fulfillment, operations and service Rationalize and enhance operating platforms, customer portals and consultant analysis, presentation and administrative tools Standardize on the most effective and efficient existing sales channels and supplement with additional channels Initiatives will focus on profitably increasing digital market share Penetrating the rest of the existing customer base with digital products Leading with digital products to increase new customer relationships Merger provides ability to leverage digital strengths of each company |
|
|
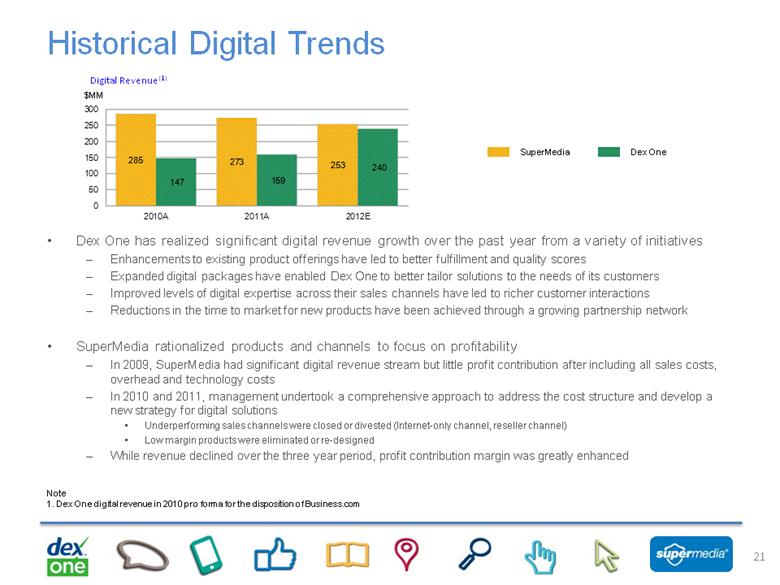
Historical Digital Trends Dex One has realized significant digital revenue growth over the past year from a variety of initiatives Enhancements to existing product offerings have led to better fulfillment and quality scores Expanded digital packages have enabled Dex One to better tailor solutions to the needs of its customers Improved levels of digital expertise across their sales channels have led to richer customer interactions Reductions in the time to market for new products have been achieved through a growing partnership network SuperMedia rationalized products and channels to focus on profitability In 2009, SuperMedia had significant digital revenue stream but little profit contribution after including all sales costs, overhead and technology costs In 2010 and 2011, management undertook a comprehensive approach to address the cost structure and develop a new strategy for digital solutions Underperforming sales channels were closed or divested (Internet-only channel, reseller channel) Low margin products were eliminated or re-designed While revenue declined over the three year period, profit contribution margin was greatly enhanced Note 1.Dex One digital revenue in 2010 pro forma for the disposition of Business.com Digital Revenue(1) SuperMedia Dex One $MM |
|
|
Amendment Overview |
|
|
Credit Agreement Amendments Approach The proposed merger and the maturity extension allows both companies to improve cash flow and reduce leverage relative to their stand-alone prospects The lenders at EACH credit silo receive MORE cumulative cash from interest, mandatory amortization and mandatory sweep under the proposed loan amendments than they would on a stand-alone basis Despite distressed levels of both companies’ debt, NO proposed principal or interest reduction as part of the merger Significant operational and financial synergies which can be used to efficiently de-leverage The combined companies requires the runway to transform and achieve synergies without risk of triggering a default due to a covenant breach, mandatory amortization or maturity The merger will require significant management effort to reduce expenses and headcount In order to achieve the merger benefits, the necessary components of the credit agreement amendments include: Modest extension of maturity Reset financial covenants to provide operating flexibility Reduction in Dex One’s mandatory amortization and shift to a quarterly cash sweep Ability to use the borrower’s portion of cash flow in market-based tender for debt |
|
|
Credit Agreement Amendments Approach This approach is not new, as the proposed amendments mirror the approach taken in the existing SuperMedia credit agreement SuperMedia has used all of its free cash flow to return ~$1 billion to its lenders since emergence from bankruptcy through June 2012 ~$625 million of principal reduction through mandatory cash sweep and the balance returned to lenders using the borrower’s portion of cash flow to tender for debt Both the Dex One and SuperMedia management teams and the Boards of the respective companies support the proposed merger and believe that all stakeholders benefit relative to the stand-alone prospects of these stakeholders |
|
|
Credit Agreement Amendments Overview Extends maturity to December 31, 2016 All loans under the various credit agreements mature before the Senior Subordinated Notes due 2017 Revised interest rate economics Increased LIBOR spread for RHDI and Dex West lenders through the extension period Implement LIBOR floor for Dex East lenders to equalize floor across all credit silos at 3.0% Increased LIBOR spread for Dex East during the extension period Adjusts mandatory amortization and cash sweep levels at RHDI and Dex East to accommodate projected financial performance and volatility of cash flow during transition period Annual mandatory amortization of approximately $20 million for each Dex One credit silo Compensating upward adjustment in cash flow sweep to re-capture any incremental cash flow in 2013 and 2014 Provides the combined company with ability to make discounted tender offers through maturity with borrower’s portion of excess cash flow Market-based opportunity for borrowers to efficiently de-leverage Liquidity for market participants Improves debt trading dynamics |
|
|
RHDI Credit Agreement Amendment Current Proposed Amendment Maturity October 24, 2014 December 31, 2016 Interest Rate 2013 – 2014 L+600bps(1) (3.0% floor) L+625 bps (3.0% Floor) 2015 – 2016 N/A L+650 bps (3.0% Floor) Mandatory Amortization 2013 – 2014 $10.8 million per quarter $5.0 million per quarter 2015 – 2016 N/A $5.0 million per quarter Cash Flow Sweep 2013 – 2014 50% - 60% of ECF(2), annually 90.0% of ECF for first $25.9 million, 50.0% thereafter, quarterly 2015 – 2016 N/A 50.0% of ECF, quarterly Discount Tender Opportunity Borrower’s portion of ECF through 12/31/13 Borrower’s portion of ECF through maturity Leverage Covenant 2013 – 2014 4.25x in 2013 & 4.00x in 2014 6.0x 2015 – 2016 N/A 6.0x Interest Coverage Covenant 2013 – 2014 1.90x in 2013 & 2.00x in 2014 1.0x 2015 – 2016 N/A 1.0x Other Maintain existing $5 million annual RP basket and allow pull-forward of future basket amounts through maturity into current year, extend discounted voluntary prepayments, permit borrower’s portion of excess cash flow basket to roll-over and permit certain other affiliate transactions. Notes 1.Actual LIBOR spread based on grid pricing. Proposed amendment eliminated grid-based pricing. 2.Actual excess cash sweep percentage based on leverage ratio grid. |

|
|
RHDI Pro Forma Metrics Without Merger Pro Forma EBITDA Net Debt(1) Note: 1.For purposes of this analysis, borrower’s portion of excess cash flow is assumed to be used to retire debt through a tender or voluntary repayment. The analysis above assumes a market price of 100% for all bank debt tenders. Net Debt/Trailing EBITDA(1) |

|
|
RHDI Pro Forma Lender Economics Notes 1.Leveraged Free Cash represents EBITDA less working capital, capital expenditures, cash interest, taxes and restricted payments. 2.For purposes of this analysis, borrower’s portion of excess cash flow is assumed to be used to retire debt through a tender (at 100%) or voluntary repayment. 3.In the stand-alone projection, all cash flow after the original maturity is presented as reducing debt as a cash flow sweep. Lenders will realize improved cash returns due to incremental cash flow from synergies and tax sharing benefits The proposed amendment adjusts the mandatory amortization to a level that provides sufficient liquidity and operating flexibility during the integration period The cash sweep starts at 90% for the first $25.9 million to allow the lenders to recapture all of the cash flow generated up to the current amortization schedule through 2014 2013E 2014E 2015E 2016E Total 2013E 2014E 2015E 2016E Total Leveraged Free Cash Flow(1) 82 56 28 14 180 107 126 105 112 450 Amortization 43 43 - - 86 20 20 20 20 80 Cash Sweep 26 11 28 14 79 58 67 45 48 218 Principal Payments 69 54 28 14 165 78 87 65 68 298 Cash Interest 64 58 57 55 234 65 54 45 34 198 Cash Returned to Lenders 133 112 85 69 399 143 141 110 102 496 Company Portion of Cash Flow(2) 13 2 - - 15 29 39 40 43 151 Cash Including Company Portion 146 114 85 69 414 172 180 150 145 647 Stand-Alone(3) Pro Forma |

|
|
Dex East Credit Agreement Amendment Current Proposed Amendment Maturity October 24, 2014 December 31, 2016 Interest Rate 2013 – 2014 L+250bps1 (no floor) L+250 bps (3.0% floor) 2015 – 2016 N/A L+300 bps (3.0% floor) Mandatory Amortization 2013 – 2014 $29 million per quarter $5.0 million per quarter 2015 – 2016 N/A $5.0 million per quarter Cash Flow Sweep 2013 – 2014 50% - 65% of ECF2, annually 90.0% of ECF, quarterly 2015 – 2016 N/A 50.0% of ECF, quarterly Discount Tender Opportunity Borrower’s portion of ECF through 12/31/13 Borrower’s portion of ECF through maturity Leverage Covenant 2013 – 2014 5.00x 6.0x 2015 – 2016 N/A 6.0x Interest Coverage Covenant 2013 – 2014 N/A 1.0x 2015 – 2016 N/A 1.0x Other Maintain existing $5 million annual RP basket and allow pull-forward of future basket amounts through maturity into current year, extend discounted voluntary prepayments, permit borrower’s portion of excess cash flow basket to roll-over and permit certain other affiliate transactions. Notes 1.Actual LIBOR spread based on grid pricing. Proposed amendment eliminated grid-based pricing. 2.Actual excess cash sweep percentage based on leverage ratio grid. |

|
|
Dex East Pro Forma Metrics Without Merger Pro Forma EBITDA Net Debt(1) Net Debt/Trailing EBITDA(1) Note 1.For purposes of this analysis, borrower’s portion of excess cash flow is assumed to be used to retire debt through a tender or voluntary repayment. The analysis above assumes a market price of 100% for all bank debt tenders. |

|
|
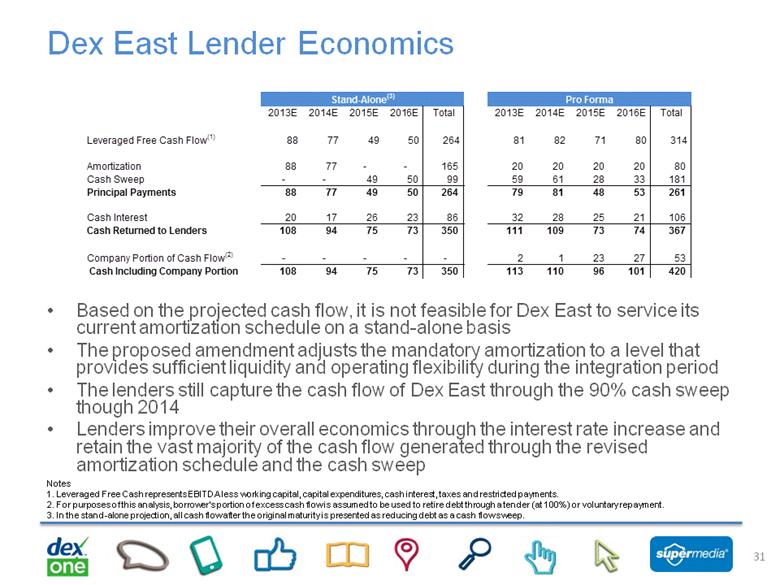
Dex East Lender Economics Based on the projected cash flow, it is not feasible for Dex East to service its current amortization schedule on a stand-alone basis The proposed amendment adjusts the mandatory amortization to a level that provides sufficient liquidity and operating flexibility during the integration period The lenders still capture the cash flow of Dex East through the 90% cash sweep though 2014 Lenders improve their overall economics through the interest rate increase and retain the vast majority of the cash flow generated through the revised amortization schedule and the cash sweep Notes 1.Leveraged Free Cash represents EBITDA less working capital, capital expenditures, cash interest, taxes and restricted payments. 2.For purposes of this analysis, borrower’s portion of excess cash flow is assumed to be used to retire debt through a tender (at 100%) or voluntary repayment. 3.In the stand-alone projection, all cash flow after the original maturity is presented as reducing debt as a cash flow sweep. 2013E 2014E 2015E 2016E Total 2013E 2014E 2015E 2016E Total Leveraged Free Cash Flow(1) 88 77 49 50 264 81 82 71 80 314 Amortization 88 77 - - 165 20 20 20 20 80 Cash Sweep - - 49 50 99 59 61 28 33 181 Principal Payments 88 77 49 50 264 79 81 48 53 261 Cash Interest 20 17 26 23 86 32 28 25 21 106 Cash Returned to Lenders 108 94 75 73 350 111 109 73 74 367 Company Portion of Cash Flow(2) - - - - - 2 1 23 27 53 Cash Including Company Portion 108 94 75 73 350 113 110 96 101 420 Stand-Alone(3) Pro Forma |
|
|
Dex West Credit Agreement Amendment Current Proposed Amendment Maturity October 24, 2014 December 31, 2016 Interest Rate 2013 – 2014 L+400 bps(1) (3.0% floor) L+425 bps (3.0% floor) 2015 – 2016 N/A L+450 bps (3.0% floor) Mandatory Amortization 2013 – 2014 $4.832 million per quarter $4.832 million per quarter 2015 – 2016 N/A $4.832 million per quarter Cash Flow Sweep 2013 – 2014 50% of ECF(2), annually 50.0% of ECF, quarterly 2015 – 2016 N/A 50.0% of ECF, quarterly Discount Tender Opportunity Borrower’s portion of ECF through 12/31/13 Borrower’s portion of ECF through maturity Leverage Covenant 2013 – 2014 3.00x 6.0x 2015 – 2016 N/A 6.0x Interest Coverage Covenant 2013 – 2014 1.35x 1.0x 2015 – 2016 N/A 1.0x Other Maintain existing $5 million annual RP basket and allow pull-forward of future basket amounts through maturity into current year, extend discounted voluntary prepayments, permit borrower’s portion of excess cash flow basket to roll-over, permit certain other affiliate transactions and eliminate ability to loan funds to Dex East and the senior secured leverage ratio covenant. Notes 1.Actual LIBOR spread based on grid pricing and leverage is expected to fall below 2.50x in 2012. Proposed amendment eliminates grid-based pricing. 2.Actual cash sweep percentage based on leverage ratio grid and leverage is expected to fall below 2.50x in 2012 resulting in a 50% ECF sweep this year. |

|
|
Dex West Pro Forma Financial Profile Without Merger Pro Forma EBITDA Net Debt(1) Net Debt/Trailing EBITDA(1) Note 1.For purposes of this analysis, borrower’s portion of excess cash flow is assumed to be used to retire debt through a tender or voluntary repayment. The analysis above assumes a market price of 100% for all bank debt tenders. |

|
|
Dex West Lender Economics The current amortization schedule for Dex West is the lowest among the Dex One credit silos Based on the projected cash flow, the proposed amendment does not require a change to the mandatory amortization and extends it at the current levels through December 31, 2016 Incremental cash flow from synergies and increased interest rate starting in 2013 provides the lenders with improved overall economics Notes 1.Leveraged Free Cash represents EBITDA less working capital, capital expenditures, cash interest, taxes and restricted payments. 2.For purposes of this analysis, borrower’s portion of excess cash flow is assumed to be used to retire debt through a tender (at 100%) or voluntary repayment. 3.In the stand-alone projection, analysis assumes existing amortization schedule is continued in 2015 and 2016. 2013E 2014E 2015E 2016E Total 2013E 2014E 2015E 2016E Total Leveraged Free Cash Flow(1) 86 71 57 55 269 87 89 84 83 343 Amortization 19 19 19 19 77 19 19 19 19 77 Cash Sweep 46 29 21 21 117 36 37 35 34 142 Principal Payments 65 48 40 40 194 55 56 54 53 219 Cash Interest 33 28 23 19 103 32 26 20 14 92 Cash Returned to Lenders 98 76 63 59 297 87 82 74 67 311 Company Portion of Cash Flow(2) 20 24 16 16 76 32 33 30 30 124 Cash Including Company Portion 118 100 79 75 373 119 115 104 97 435 Stand-Alone(3) Pro Forma |

|
|
SuperMedia Credit Agreement Amendment Current Proposed Amendment Maturity December 31, 2015 December 31, 2016 Interest Rate 2013 – 2015 L+800 bps (3% Floor) L+800 bps (3% Floor) 2016 N/A L+800 bps (3% Floor) Mandatory Amortization 2013 – 2015 None None 2016 N/A None Cash Flow Sweep 2013 – 2015 67.5% of FCF, quarterly 50.0% of FCF, quarterly 2016 N/A 50.0% of FCF, quarterly Discount Tender Opportunity Borrower’s portion of FCF through 12/31/13 Borrower’s portion of FCF through maturity Leverage Covenant 2013 – 2015 7.5x 7.5x 2016 N/A 7.5x Interest Coverage Covenant 2013 – 2015 1.10x 1.10x 2016 N/A 1.10x Other Refresh disposition and investment baskets, provide limited restricted payment, allow borrower to enter into intercompany operating agreements, permit below par loan repurchases out of borrower’s portion of cash flow and permit certain other affiliate transactions. |

|
|
SuperMedia Pro Forma Financial Profile Without Merger Pro Forma EBITDA Net Debt(1) Net Debt/Trailing EBITDA(1) Note 1.For purposes of this analysis, borrower’s portion of excess cash flow is assumed to be used to retire debt through a tender or voluntary repayment. The analysis above assumes a market price of 100% for all bank debt tenders. |

|
|
SuperMedia Lender Economics Lenders will realize improved cash returns due to incremental cash flow Pro forma cash sweep under proposed amendment will exceed the cash sweep in the stand-alone projections Notes 1.Leveraged Free Cash represents EBITDA less working capital, capital expenditures, cash interest, taxes and restricted payments. 2.For purposes of this analysis, borrower’s portion of cash flow is assumed to be used to retire debt through a tender (at 100%) or voluntary repayment. 3.In the stand-alone projection, all cash flow after the original maturity is presented as reducing debt as a cash flow sweep. 2013E 2014E 2015E 2016E Total 2013E 2014E 2015E 2016E Total Leveraged Free Cash Flow(1) 120 94 58 39 311 128 153 140 105 526 Amortization - - - - - - - - - - Cash Sweep 81 64 39 26 210 64 76 70 52 262 Principal Payments 81 64 39 26 210 64 76 70 52 262 Cash Interest 154 142 134 129 559 154 138 122 109 523 Cash Returned to Lenders 235 206 173 155 769 218 214 192 161 785 Company Portion of Cash Flow(2) 39 31 19 13 101 64 76 70 52 262 Cash Including Company Portion 274 237 192 167 870 282 291 262 213 1,048 Stand-Alone(3) Pro Forma |

|
|
Next Steps and Timeline |

|
|
Transaction Anticipated to be Completed by End of 2012 Lender Steering Committee Formed/ FTI Due Diligence Process August 2012 Finalize Amendments with Various Lender Groups and Receive Requisite Lender Consents October 2012 Shareholder Approval and Closing November 2012 Meeting With Lenders September 2012 |
|
|
Appendix A Shared Service Agreement Details |
|
|
Dex One currently uses a Shared Services Agreement to allocate overhead and co-mingled back-office costs between the three operating companies Shared expenses include: General and Administration Services: Executive, Finance, Human Resources, Legal, Information Technology, Corporate Facilities, Publishing and Communications Operations Support Services: Marketing and Advertising, Print & Delivery, Management, Customer Service, Billing, Credit and Operations Facilities Sales Leadership and Effectiveness Services: Sales Leadership Team, Sales Reporting, Training, Sales Office Support, Sales Compensation Analysis and National Sales Digital Operations Services: Digital Information Technology: Digital Leadership Team, Non-Print Product Development and Digital Reporting Allocation of expense is based on prior year revenue and adjusted annually The amended Shared Services Agreement will pool the combined shared services of both SuperMedia and Dex One and then, similar to the existing Dex One agreement, allocate the cost pool based on prior year revenue The 2012 expense allocation will be 53%/47% for SuperMedia and Dex One, respectively, based on 2011 revenue The 2013 allocation will be based on 2012 revenue, currently forecast to be 51%/49% for SuperMedia and Dex One, respectively Dex One Service will continue to allocate its portion of the shared service expense to Dex East, Dex West, RHDI and Dex One in accordance with the existing allocation methodology (prior year’s revenue) Shared Services Agreement |
|
|
Agreement provides flexibility to implement common management platforms and ultimately consolidate the cost structure Costs will be tracked on detailed basis and billed / settled between SuperMedia and Dex One every month Vast majority of the synergies are derived from the shared service pool (70-80% based on the year) Allows senior management to be agnostic to where the synergy is realized (i.e. it does not matter economically whether SuperMedia or Dex One eliminates the cost) as the overall reduction is captured in the cost pool The proposed agreement was evaluated on a historical basis and management determined that the methodology would have produced results within 2% of the actual results Shared Services Agreement SuperMedia Dex One Total SuperMedia Dex One Total SuperMedia Dex One 2011A 288 247 535 283 252 535 (5) 5 YTD 6/30/12A 123 105 228 120 108 228 (3) 3 Actual Expense Shared Service Shared Service Agreement Illustrative Result of Difference from Actual |
|
|
Appendix B Dex One Silo Comparison |
|
|
Dex West Dex East RHDI Market Tier Split 2012 Ad Sales Major Metro Markets Seattle, Portland, Phoenix, Salt Lake City Minneapolis, Denver Las Vegas, Chicago, Orlando (partial) Revenue & EBITDA LTM Q2 2012 Revenue (% of Total) EBITDA (% of Total) EBITDA Margin 32% 33% 45% Revenue (% of Total) EBITDA (% of Total) EBITDA Margin 27% 29% 47% Revenue (% of Total) EBITDA (% of Total) EBITDA Margin 41% 38% 41% Silo Overview Dex One management primarily operates the business on a regional and consolidated basis - rather than at the silo level – while recognizing the unique credit circumstances facing each silo Management believes its product offerings, training, and execution are similar across all regions Differences in silo performance relate to the markets themselves rather than factors under direct management control The proposed merger will preserve underlying silo operating characteristics and the relative performance differences Major Metro Market 40% Large Market 10% Mid Market 34% Small Market 16% Major Metro Market 30% Large Market 25% Mid Market 29% Small Market 16% |
|
|
Silo Historical Revenue Performance Each of the Dex One silos has experienced differing revenue and cost trends over time Market size has been the biggest driver of print ad sales / revenue decline with major metros declining at a faster rate than small/ rural markets Dex West includes major metro markets that suffer from a set of challenges unique to those areas Due to the historical declines already incurred, each silo has a similar revenue exposure to major metro and large markets Digital penetration (digital revenue as % of total revenue) is similar across all silos Revenue Index (Indexed with its Q1 2010 value set at 100) Digital Revenue (as % of Total) (32%) (26%) (22%) 65% 70% 75% 80% 85% 90% 95% 100% Q1 Q2 Q3 Q4 Q1 Q2 Q3 Q4 Q1 Q2 17% 21% 18% 5% 7% 9% 11% 13% 15% 17% 19% 21% 23% 25% Q1 Q2 Q3 Q4 Q1 Q2 Q3 Q4 Q1 Q2 |
|
|
Silo Historical EBITDA Performance Historically, RHDI margins have been lower than Dex West and Dex East However, from a trending perspective, relative EBITDA performance varies from period to period Examples of differences that impact margin include the timing of initiatives such as print/paper optimization, distribution initiatives, re-scoping markets and centralizing telesales Key underlying operating differences at each silo level include: Bad Debt: RHDI markets have exhibited worse bad debt trends as a result of economic factors. Sales & Sales Support Costs: Vary by silo due to population density. For example, RHDI regions are spread over greater distances, resulting in higher headcount and sales person/manager costs Print Cost of Sales: Smaller markets (RHDI has the greatest proportion) have a higher cost per directory than large markets due to scale Digital Cost of Sales: RHDI markets have less organic traffic on Dexknows.com than Dex One markets (likely due to less name brand recognition in non-Dex One markets), driving a higher level of purchased traffic to support the IYP product G&A: Dex West continues to have higher state and local taxes due to the Washington Business and Occupancy tax EBITDA Margin EBITDA Index (Indexed with its Q1 2010 value set at 100) 44% 47% 41% 35% 40% 45% 50% 55% 60% Q1 Q2 Q3 Q4 Q1 Q2 Q3 Q4 Q1 Q2 (41%) (39%) (33%) 55% 60% 65% 70% 75% 80% 85% 90% 95% 100% Q1 Q2 Q3 Q4 Q1 Q2 Q3 Q4 Q1 Q2 |
|
|
Appendix C Financial Projection Details EBITDA and Adjusted EBITDA are not measurements of operating performance computed in accordance with GAAP and should not be considered as a substitute for net income (loss) prepared in conformity with GAAP. In addition, EBITDA and Adjusted EBITDA may not be comparable to similarly titled measures of other companies. Management believes that these non-GAAP financial measures are important indicators of our operations because they exclude items that may not be indicative of, or related to, our core operating results, and provide a better baseline for analyzing our underlying business. Adjusted EBITDA is determined by adjusting EBITDA for (i) gain on debt repurchases, (ii) stock-based compensation expense and long-term incentive program, (iii) impairment charges and (iv) gain on sale of assets, net and (v) other non-recurring items. Leveraged free cash flow is not a measurement of operating performance computed in accordance with GAAP and should not be considered as a substitute for cash flow from operations prepared in conformity with GAAP. In addition, leveraged free cash flow may not be comparable to a similarly titled measure of other companies. Management believes that this cash flow measure provides investors and stockholders with a relevant measure of liquidity and a useful basis for assessing the Company's ability to fund its activities and obligations. |
|
|
Consolidated Pro Forma Detail Notes 1.Projections reflect proposed amendments and estimated synergies 2.“Other” primarily represents capital expenditures, changes in working capital and other operating cash flow requirements $MM 2012E 2013E 2014E 2015E 2016E Revenue 2,675 $ 2,353 $ 2,193 $ 2,107 $ 2,100 $ Adj EBITDA - Pre Synergies 1,094 882 732 607 544 Synergies, net - (17) 104 175 175 Adj EBITDA (1) 1,094 865 836 782 719 Bank Interest (316) (283) (246) (212) (178) Bond Interest (22) (16) (16) (16) (17) Payments to Hold Co - - - - - Taxes/Tax Sharing (111) (66) (46) (65) (60) Other (2) (96) (82) (63) (72) (71) Leveraged Free Cash Flow 550 418 465 416 394 Debt, ending 3,467 3,066 2,617 2,218 1,840 Cash, ending 211 211 212 212 212 Net Debt, ending 3,256 2,855 2,406 2,006 1,628 Net Debt/Adj EBITDA 3.0x 3.3x 2.9x 2.6x 2.3x Dex Media (Combined Companies) |

|
|
Pro Forma SuperMedia and Dex One Detail Notes 1. Projections reflect proposed amendments and estimated synergies 2. “Other” primarily represents capital expenditures, changes in working capital and other operating cash flow requirements Historical and forecasted digital revenue for SuperMedia include approximately $17 million from a discontinued operation that was divested in August, 2012. EBITDA forecasts also include an offsetting $17 million in expenses $MM 2012E 2013E 2014E 2015E 2016E 2012E 2013E 2014E 2015E 2016E Revenue 1,371 $ 1,186 $ 1,095 $ 1,040 $ 1,023 $ 1,304 $ 1,167 $ 1,098 $ 1,066 $ 1,077 $ Adj EBITDA - Pre Synergies 534 427 351 291 257 560 455 381 316 287 Synergies, net (9) 52 88 87 - (9) 52 88 88 Adj EBITDA (1) 534 419 403 379 344 560 446 434 403 375 Bank Interest (174) (154) (138) (122) (109) (142) (130) (108) (90) (69) Bond Interest - - - - - (22) (16) (16) (16) (17) Payments to Hold Co - - - - - - - - - - Taxes/Tax Sharing (96) (97) (84) (83) (96) (15) 31 38 18 36 Other (2) (23) (41) (28) (33) (35) (73) (42) (34) (38) (36) Leveraged Free Cash Flow 241 128 153 140 105 309 290 313 276 289 Debt, ending 1,461 1,334 1,181 1,041 936 2,006 1,732 1,436 1,177 904 Cash, ending 95 95 95 95 95 115 115 116 117 117 Net Debt, ending 1,366 1,238 1,086 945 841 1,890 1,617 1,320 1,060 787 Net Debt/Adj EBITDA 2.6x 3.0x 2.7x 2.5x 2.4x 3.4x 3.6x 3.0x 2.6x 2.1x SuperMedia (3) Dex One |

|
|
Pro Forma Dex One Credit Silo Detail Notes 1.Projections reflect proposed amendments and estimated synergies 2.“Other” primarily represents capital expenditures, changes in working capital and other operating cash flow requirements $MM 2012E 2013E 2014E 2015E 2016E 2012E 2013E 2014E 2015E 2016E Revenue 541 $ 479 $ 449 $ 437 $ 441 $ 348 $ 308 $ 292 $ 285 $ 288 $ Adj EBITDA - Pre Synergies 215 174 143 118 105 162 131 112 93 86 Synergies, net - (3) 20 33 32 - (2) 15 26 26 Adj EBITDA (1) 215 170 162 150 136 162 128 127 119 112 Bank Interest (77) (65) (54) (45) (34) (24) (32) (28) (25) (21) RP for Bond Interest (8) (6) (6) (6) (6) (6) (4) (4) (4) (4) RP Basket (5) (5) (5) (5) (5) (5) (5) (5) (5) (5) Taxes/Tax Sharing 5 26 38 21 34 (6) 8 4 0 7 Other (2) (60) (14) (10) (11) (14) 14 (14) (12) (13) (9) Leveraged Free Cash Flow 69 107 126 105 112 137 81 82 71 80 Debt, ending 755 648 522 417 306 538 458 375 304 224 Cash, ending 24 24 24 24 24 50 50 50 50 50 Net Debt, ending 731 624 498 393 282 489 408 325 255 174 Net Debt/Adj EBITDA 3.4x 3.7x 3.1x 2.6x 2.1x 3.0x 3.2x 2.6x 2.1x 1.6x RHDI Dex Media East |

|
|
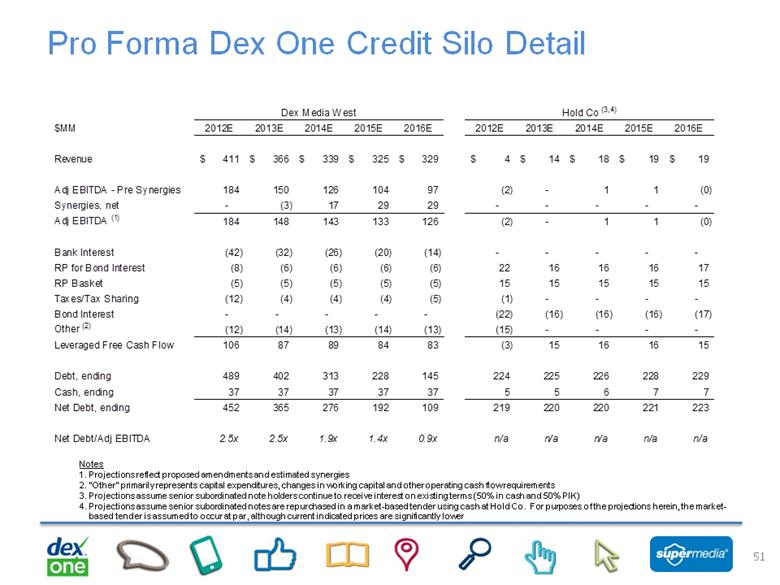
Pro Forma Dex One Credit Silo Detail Notes 1.Projections reflect proposed amendments and estimated synergies 2.“Other” primarily represents capital expenditures, changes in working capital and other operating cash flow requirements 3.Projections assume senior subordinated note holders continue to receive interest on existing terms (50% in cash and 50% PIK) 4.Projections assume senior subordinated notes are repurchased in a market-based tender using cash at Hold Co. For purposes of the projections herein, the market-based tender is assumed to occur at par, although current indicated prices are significantly lower $MM 2012E 2013E 2014E 2015E 2016E 2012E 2013E 2014E 2015E 2016E Revenue 411 $ 366 $ 339 $ 325 $ 329 $ 4 $ 14 $ 18 $ 19 $ 19 $ Adj EBITDA - Pre Synergies 184 150 126 104 97 (2) - 1 1 (0) Synergies, net - (3) 17 29 29 - - - - - Adj EBITDA (1) 184 148 143 133 126 (2) - 1 1 (0) Bank Interest (42) (32) (26) (20) (14) - - - - - RP for Bond Interest (8) (6) (6) (6) (6) 22 16 16 16 17 RP Basket (5) (5) (5) (5) (5) 15 15 15 15 15 Taxes/Tax Sharing (12) (4) (4) (4) (5) (1) - - - - Bond Interest - - - - - (22) (16) (16) (16) (17) Other (2) (12) (14) (13) (14) (13) (15) - - - - Leveraged Free Cash Flow 106 87 89 84 83 (3) 15 16 16 15 Debt, ending 489 402 313 228 145 224 225 226 228 229 Cash, ending 37 37 37 37 37 5 5 6 7 7 Net Debt, ending 452 365 276 192 109 219 220 220 221 223 Net Debt/Adj EBITDA 2.5x 2.5x 1.9x 1.4x 0.9x n/a n/a n/a n/a n/a Dex Media West Hold Co (3,4) |