Attached files
| file | filename |
|---|---|
| 8-K - FORM 8-K - PALMETTO BANCSHARES INC | d412226d8k.htm |
 NASDAQ:
PLMT
KBW Bank Conference
September 14, 2012
Palmetto Bancshares, Inc.
Palmetto Bancshares, Inc.
Holding Company for
Holding Company for
1
Sam Erwin,
President and Chief Executive Officer
Office: 864-250-6083
Email:
serwin@palmettobank.com
Lee Dixon,
Chief Operating and Chief Risk Officer
Office: 864-250-6082
Email:
ldixon@palmettobank.com
Exhibit 99.1 |
 NASDAQ:
PLMT
2
Non-GAAP Measures and Forward Looking Statements
This presentation contains financial information determined by methods other than in accordance with
Generally Accepted Accounting Principles (“GAAP”) such as earnings figures excluding
credit-related items such as provision for loan losses, loan workout expenses, foreclosed
real estate write downs and expenses, and losses on loans held for sale; one-time charges; and
gains on sales. Non-GAAP measures should not be considered as an alternative to any measure of
performance as promulgated under GAAP. Non-GAAP measures have limitations as analytical
tools, and investors should not consider them in isolation or as a substitute for analysis of
the Company’s results as reported under GAAP.
Certain statements in this presentation contain “forward-looking statements” within the
meaning of the Private Securities Litigation Reform Act of 1995, such as statements relating to
future plans and expectations, and are thus prospective. Such forward-looking statements
are identified by words such as “believes,” “expects,” “anticipates,” “estimates,” “intends,” “plans,”
“targets,” and “projects,” as well as similar expressions.
Forward-looking statements are subject to risks, uncertainties, and other factors which
could cause actual results to differ materially from future results expressed or implied by such forward-looking
statements. Factors which could cause actual results to differ materially from the anticipated results
or other expectations expressed in the forward-looking statements include, but are not
limited to: (1) the strength of the United States economy in general and the strength of the
local economies in which the Company conducts its operations which could result in, among other
things, a deterioration in the credit quality or a reduced demand for credit, including the resultant effect on our loan portfolio
and allowance for loan losses and the rate of delinquencies and amounts of charge-offs, or adverse
changes in asset quality in our loan portfolio, which may result in increased credit
risk-related losses and expenses; (2) adverse conditions in the stock market, the public
debt market and other capital markets (including changes in interest rate conditions) and the impact of such
conditions on the Company, and the timing and amount of future capital raising activities by the
Company, if any; and (3) actions taken by banking regulatory agencies related to the banking
industry in general and the Company or the Bank specifically. The assumptions underlying the
forward-looking statements could prove to be inaccurate. Therefore, we can give no assurance that
the results contemplated in the forward-looking statements will be realized. The inclusion of this
forward-looking information should not be construed as a representation by our Company or
any person that the future events, plans, or expectations contemplated by our Company will be
achieved. Additional factors that could cause our results to differ materially from those
described in the forward-looking statements can be found in our reports (such as Annual Reports on
Form 10-K, Quarterly Reports on Form 10-Q and Current Reports on Form 8-K) filed
with the U.S. Securities and Exchange Commission (the “SEC”) and available at the
SEC’s Internet site (www.sec.gov), including the “Risk Factors” included therein. All subsequent written and
oral forward-looking statements concerning the Company or any person acting on its behalf is
expressly qualified in its entirety by the cautionary statements above. We do not undertake any
obligation to update any forward-looking statement to reflect changes in circumstances or
events that occur after the date the forward-looking statements are made.
|
 NASDAQ:
PLMT
General Background on
The Palmetto Bank
3 |
 NASDAQ:
PLMT
The Palmetto Bank At a Glance
Headquarters: Greenville, South Carolina
Inception: 1906 (105 years)
Team members (FTE): 322.5
Total assets: $1.181 billion
Total deposits: $1.063 billion
Tangible book value/share: $7.04
Stock price: $7.50 (and as of September 10)
Market capitalization: $95.6 million
Private equity ownership: 87%
NASDAQ Capital Markets: PLMT
Source: financial and FTE information as of June 30, 2012 per Form
10-Q 4 |
 NASDAQ:
PLMT
Franchise and Leadership
History:
105
year
history
with
strong
brand
recognition
and
client
loyalty
–
$1.2 billion community bank headquartered in Greenville, South Carolina
–
Simple capital structure consisting of 100% common stock (no TARP financing)
–
Approximately 2,000 shareholders with 87% ownership through eight private equity
firms resulting from a $114 million private placement and follow-on
offering in October 2010 Franchise:
Premier
deposit-gathering
franchise
in
attractive
banking
markets
–
4 largest bank headquartered in South Carolina (6
in deposit share in the Upstate and
1 of banks headquartered in South Carolina)
–
25 branches in the attractive Upstate region of South Carolina with 325
teammates –
Excellent historical financial results as a high performing bank
–
Heritage of high touch client service provides platform for enhanced sales
culture Team:
Energized
and
experienced
executive
leadership
team
with
demonstrated
turnaround
capabilities
–
New senior leadership team starting in 2009 (7 of the 9 are new)
–
Experienced team with deep local market relationships
–
Proactive and comprehensive Strategic Project Plan implemented and producing
measurable results
Asset
quality:
Asset
quality
has
been
aggressively
addressed
–
Credit problems were identified and have been substantially resolved (with 52% of
the losses
incurred
related
to
a
specific
pool
of
55
problem
assets
–
losses
of
$98
million)
5
th
st
th |
 NASDAQ:
PLMT
Established Branch Network
25 branches located in the Upstate region of South Carolina (down from a peak of 33
branches) Corporate headquarters relocated from Laurens to Greenville, South
Carolina, in March 2009 to expand in the Anderson, Greenville and
Spartanburg markets along the economically strong Interstate 85 corridor
between Atlanta, GA and Charlotte, NC
6
Georgia
North Carolina
South Carolina |
  NASDAQ:
PLMT
Attractive Size and Franchise
Note: SCBT Financial Corp. financials do not reflect the acquisition of Savannah
Bancorp, Inc. announced on August 8, 2012 Source: SNL Financial LC; deposit
data as of June 30, 2011, total company assets as of most recent quarter available
Strategically well-positioned as both an acquirer or
as an entry point into South Carolina for a merger partner
7
Rank
Among SC-
Based
Banks
Company Name
City
Total Company
Assets
($000)
Total
SC Deposits
2011
($000)
SC Deposit
Market
Share 2011
(%)
1
First Citizens Bancorp. Inc.
Columbia
8,240,135
6,176,963
9.10
2
SCBT Financial Corp.
Columbia
4,373,269
2,791,628
4.11
3
First Financial Holdings Inc.
Charleston
3,304,174
2,687,814
3.96
4
Palmetto Bancshares Inc.
Greenville
1,180,960
1,076,345
1.59
5
CNB Corp.
Conway
930,166
737,775
1.09
6
Carolina Financial Corp.
Charleston
826,855
658,781
0.97
7
Security Federal Corp.
Aiken
910,112
658,354
0.97
8
Southern First Bancshares Inc.
Greenville
759,632
557,894
0.82
9
Arthur Financial Corp.
Union
565,454
531,857
0.78
10
HCSB Financial Corp.
Loris
536,744
517,598
0.76 |
  NASDAQ:
PLMT
Attractive Markets in Upstate South Carolina
Branches
located
in
nine
counties
in
the
Upstate
which
represent
approximately
1/3rd
of
South
Carolina’s
population
and
deposits
Fourteen branches located in Greenville and Spartanburg counties, the largest and
fourth largest counties in South Carolina, where combined population growth
since 2000 averaged 17.8% compared to 16.7% for South Carolina and 10.4% nationwide
The Upstate Region:
Located
adjacent
to
major
transportation
corridors
and
centrally
located
between
Charlotte,
NC
and
Atlanta,
GA
Diversified and broad economic base
Highest international investment per capita in the nation with more than 250
international firms One of the fastest growing and economically attractive
regions in South Carolina and in the Southeast in recent years Academic
center with Clemson University, Furman University, Wofford College, Converse College and USC Upstate
Source: SNL Financial LC; data as of June 30, 2011
County
Market
Rank
Number
of
Branches
Company
Deposits
in Market
($000)
Average
Deposits
Per
Branch
($000)
Deposit
Market
Share
(%)
Percent of
State
Franchise
(%)
Total
Population
2011
(Actual)
Population
Change
2000-2011
(%)
Projected
Population
Change
2011-2016
(%)
Greenville
8
9
343,775
38,197
3.18
31.94
459,324
21.00
8.15
Laurens
1
3
194,050
64,683
36.86
18.03
66,287
(4.71)
(1.77)
Spartanburg
10
5
164,594
32,919
3.91
15.29
286,838
13.02
4.67
Anderson
9
2
114,075
57,038
4.91
10.60
188,659
13.83
4.77
Greenwood
4
2
113,085
56,543
13.23
10.51
69,904
5.48
1.84
Cherokee
4
1
56,311
56,311
11.89
5.23
55,798
6.21
3.00
Abbeville
5
1
30,574
30,574
12.12
2.84
25,294
(3.34)
(1.86)
Oconee
10
1
30,403
30,403
2.64
2.82
74,978
13.23
4.82
Pickens
12
1
29,478
29,478
1.89
2.74
119,793
8.16
2.93
Total
25
1,076,345
43,054
100.00
1,346,875
13.12
5.07
Weighted Average: South Carolina Franchise
10.72
4.02
Aggregate: Entire State of South Carolina
4,682,632
16.72
6.02
Aggregate: National
10.41
3.42
8 |
 NASDAQ:
PLMT
9
Sam Erwin, President and Chief Executive Officer
Hired in March 2009
22 years of banking experience
CEO of Community Bankshares, Inc., Orangeburg, SC ($576 million in assets)
–
Addressed serious asset quality and organizational issues
–
Successful resolution of asset quality issues ultimately resulted in sale of the
bank for a significant market premium in October 2008 at two times book
value despite a depressed market Lee Dixon, Chief Operating and Chief Risk
Officer Hired in May 2009
24 years of business experience including 21 years of banking experience
Partner at PricewaterhouseCoopers LLP
–
Banking clients ranged from $100 million asset community banks to the largest
national and regional banks (Bank of America, Wachovia, and BB&T)
–
Extensive
operational
experience
covering
all
aspects
of
banking
and
financial
services
–
Key player on deal teams in many mergers and acquisition engagements and
integration teams Energized and Experienced Management Team
Roy Jones, Chief Financial Officer
Hired in November 2010
22 years of banking and banking-related experience
–
Various finance and accounting leadership positions with banks ranging from
national banks (NationsBank/Bank of America) to large regional banks (The
South Financial Group/TD Bank, Barnett Bank) as well as CFO of $800 million
asset community bank –
Started career with PricewaterhouseCoopers LLP in the firm’s financial
services audit practice |
 NASDAQ:
PLMT
Energized and Experienced Management Team
Coleman Kirven, Commercial Banking Executive
Started in this role in July 2011 (hired in January 2005)
19 years of business experience including 16 years of retail, commercial and
mortgage banking –
Previous bank experience includes BB&T, CapitalBank, and Carolina First Bank
(The South Financial Group) Trish Springfield, Retail Banking Executive
Hired in October 2010
24 years of retail banking and related experience
–
Key role in branch training, marketing, retail sales, branch network analysis and
incentive plan design; prior experience
includes
National
Bank
of
Commerce/SunTrust,
National
Commerce
Bank
Services,
Trustmark
National Bank, and Carolina First Bank (The South Financial Group)
Jack McElveen, Chief Credit Officer
Hired in July 2009
27 years of banking experience related mainly to lending, underwriting, credit
policy and credit review Senior credit-related roles for various banking
organizations since 2002, including at Community Bankshares with Mr.
Erwin –
Brought deep experience and capabilities and made significant improvements in
credit processes, procedures, infrastructure, reporting, staffing and loan
workout in a very short period of time 10 |
 NASDAQ:
PLMT
11
Teresa Knight, Bank Administration and HR Executive
Hired in May 1981
34 years of business experience including 31 years with The Palmetto Bank
–
Range of responsibilities during tenure at the Bank, including Retail leadership,
consumer lending, marketing and, most recently, human resources
Energized and Experienced Management Team
Matt Walter, Treasurer & Chief Investment Officer
Hired in August 1990
22 years of banking experience (all with The Palmetto Bank)
–
Prior to assuming the Treasurer role in 2009 worked in both Retail and Commercial
roles. Currently engaged in oversight of the investment securities
portfolio, leading the Bank’s Asset-Liability Committee and balance sheet
management
Mark Terry, Chief Information Officer
Hired in May 2011
22 years of information technology management experience, including 20 years in
banking –
Led information technology initiatives in healthcare, insurance and financial
services industries, including a $1 billion asset community bank
–
Managed technology and operations projects for several de novo startups and
mergers & acquisition |
 NASDAQ:
PLMT
The Turnaround Summary
Balance sheet (loan) “growth imperative”
resulted in rapid growth in real estate loans during 2004
to 2009 (balance sheet grew 60% from $893 million to $1.436 billion)
–
Heavy
concentration
in
acquisition,
development
and
construction
loans
with
a
higher
volume
of individually larger real estate loans including purchased participations,
brokered loans, and out-of-market loans
–
Originations continued into 2008 when both the overall economy and real estate
market were deteriorating
Chief
Executive
Officer,
Chief
Operating
and
Chief
Risk
Officer,
and
Chief
Credit
Officer
were
replaced by a new management team in March to July 2009
–
Rapid transition from a “family owned bank”
to a disciplined public company
–
Transformed Board with complete engagement and quick action (including three new
Directors in 2010 from private equity investors)
New
management
quickly
developed
and
implemented
a
comprehensive
Strategic
Project
Plan
in
2009 to address all major areas with an immediate emphasis on aggressively
resolving asset quality issues
–
Provisions of Consent Order effective June 2010 had been anticipated and included
in the Plan
–
Capital raise completed in October 2010 ($114 million private placement and
follow-on offering)
–
Nonperforming assets aggressively resolved, including through bulk sales (down 73%
from the peak in March 2010)
Management has set a new course which is now focused on a “Value Creation
Strategy” that
builds on the Company’s 105 year heritage as it returns to sustained
profitability 12 |
 NASDAQ:
PLMT
Strategic Focus
13 |
 NASDAQ:
PLMT
Evolution of Big Picture Strategic Focus
•
2009
–
Quantify depth of credit loss hole
–
Strategic Project Plan to survive
and thrive
–
Prepare for regulatory agreement
•
2010
–
Raise capital ($114 million in
October 2010)
–
Process improvement
–
Change management
•
2011
–
Performance culture and talent
management
–
Operating earnings
–
Client focus
14
•
2012
–
Profitability
–
Expense reductions
–
Technology
enhancements
–
Palmetto Partnership
•
2013
-
Sustained and
predictable earnings
-
Niche lending and
Treasury services
-
Value creation
-
Client experience |
 NASDAQ:
PLMT
15
Strategic Priorities
2012
1.
Return to profitability
2.
Improve asset quality
3.
Exit regulatory agreement
4.
Execute on client service and
support through Palmetto
Partnership
5.
Develop a high performing
culture and winning team
2013
Increase the value of
The Palmetto Bank franchise by:
1.
Improving profitability to
become a high performing
bank
2.
Enhancing the client
experience
3.
Cultivating a high performing
culture and winning team
4.
Exiting the regulatory
agreement, including
improvement in asset quality
5.
Operating with sound risk
management |
 NASDAQ:
PLMT
Value Creation Strategy
and the Client Experience
1.
What actions do we need to take to increase
the Value of The Palmetto Bank franchise?
2.
Are all of our actions contributing to an
enhanced Client Experience?
16 |
 NASDAQ:
PLMT
17
Big Picture Strategy –
Line of Business Delineation is Critical to
Improved Profitability and Risk Management
1.
Retail Bank: primarily manage funding cost through low cost
deposits and expanding household penetration
2.
Commercial Bank: primarily generate income through lending and
ancillary services
3.
Wealth Management: primarily generate incremental revenue and
provide “full service”
banking
4.
Support departments: enable the above with disciplined expense
management and sound risk management
By line of business, tailored go-to-market strategies, products,
services, bundled offerings, expertise, technology, infrastructure,
marketing, etc.
Out-service the big banks and
out-muscle the little banks! |
 NASDAQ:
PLMT
2012 Strategic Priorities
18 |
 NASDAQ:
PLMT
19
2012 Strategic Priorities
1.
Return to profitability
2.
Improve asset quality
3.
Exit regulatory agreement
4.
Execute on client service and support
through Palmetto Partnership
5.
Develop a high performing culture and
winning team
While keenly focused on the above in 2012,
we are already executing on 2013 Strategic Priorities.
|
 NASDAQ:
PLMT
1. Return to Profitability
20 |
 NASDAQ:
PLMT
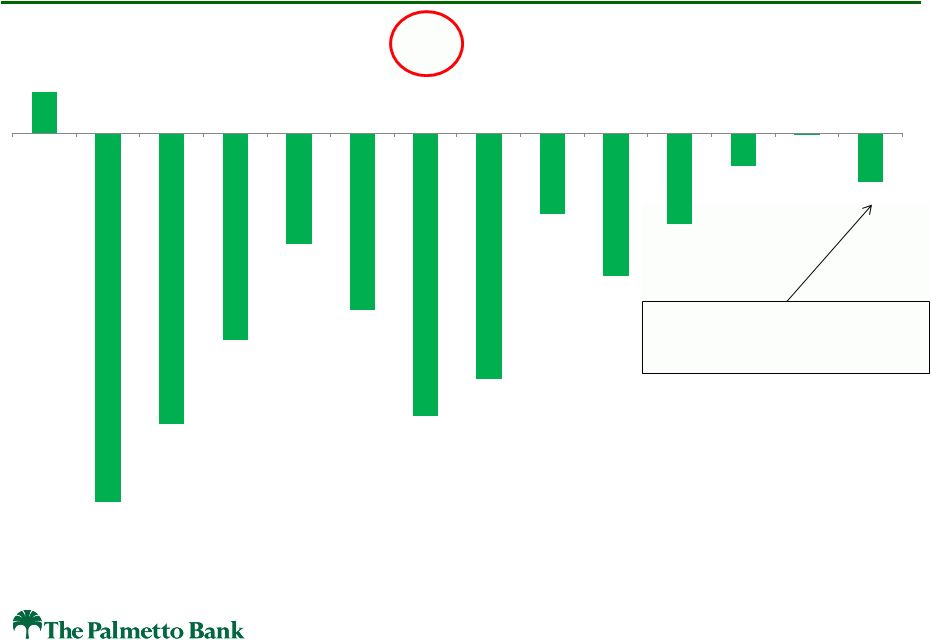
Pre-Tax Loss
21
Strategic problem asset
sales at discounted prices
$3,117
$(27,772)
$(21,939)
$(15,619)
$(8,334)
$(13,326)
$(21,359)
$(18,525)
$(6,028)
$(10,760)
$(6,824)
$(2,452)
$(70)
$(3,638)
1Q 2009
2Q 2009
3Q 2009
4Q 2009
1Q 2010
2Q 2010
3Q 2010
4Q 2010
1Q 2011
2Q 2011
3Q 2011
4Q 2011
1Q 2012
2Q 2012 |
 NASDAQ:
PLMT
Operating Earnings
(excluding credit costs and non-recurring items)
22
$5,333
$2,294
$3,631
$3,361
$2,868
$1,996
$977
$966
$1,475
$2,338
$4,321
$3,733
$4,683
$4,496
1Q 2009
2Q 2009
3Q 2009
4Q 2009
1Q 2010
2Q 2010
3Q 2010
4Q 2010
1Q 2011
2Q 2011
3Q 2011
4Q 2011
1Q 2012
2Q 2012 |
 NASDAQ:
PLMT
The Path to Profitability
•
Making money on an operating basis in spite of:
–
Low interest rates and flat yield curve
(compressed net interest margin)
–
Higher regulatory costs and revenue
restrictions (lower service charges, higher
FDIC premiums, etc.)
–
High operating expenses from workout mode
and catch up in infrastructure and technology
The core franchise is generating operating
earnings on a day-to-day basis.
23 |
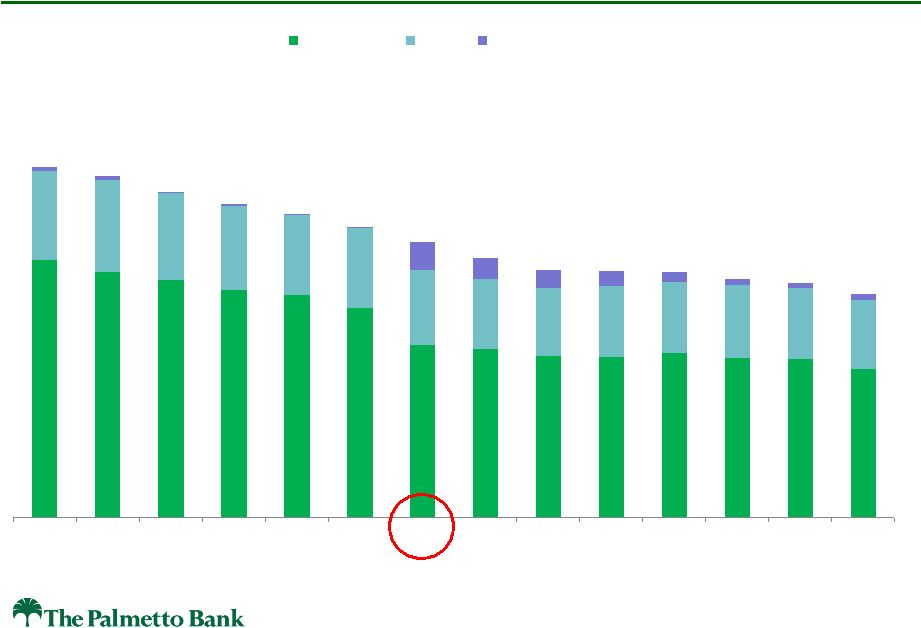
 NASDAQ:
PLMT
Net Interest Income
24
3.62%
2.82%
3.15%
3.06%
3.34%
3.23%
2.91%
2.69%
3.18%
3.32%
3.53%
3.65%
3.71%
3.56%
5.21%
4.45%
4.73%
4.56%
4.63%
4.37%
4.08%
3.74%
4.06%
4.12%
4.26%
4.27%
4.20%
4.03%
1.86%
1.91%
1.80%
1.70%
1.45%
1.30%
1.32%
1.25%
1.06%
0.99%
0.91%
0.78%
0.61%
0.59%
1Q 2009
2Q 2009
3Q 2009
4Q 2009
1Q 2010
2Q 2010
3Q 2010
4Q 2010
1Q 2011
2Q 2011
3Q 2011
4Q 2011
1Q 2012
2Q 2012
Net Interest Margin
Total yield on interest earning assets
Total rate on interest-bearing liabilities |
 NASDAQ:
PLMT
$1,167,924
$1,138,832
$1,082,313
$1,044,196
$1,011,368
$969,142
$919,844
$864,376
$824,852
$821,197
$817,691
$791,384
$779,231
$742,221
1Q 2009
2Q 2009
3Q 2009
4Q 2009
1Q 2010
2Q 2010
3Q 2010
4Q 2010
1Q 2011
2Q 2011
3Q 2011
4Q 2011
1Q 2012
2Q 2012
Commercial
Retail
Loans held for sale
Loans
25 |
 NASDAQ:
PLMT
Noninterest Income
(excluding securities gains and non-recurring items)
26
$3,767
$4,496
$4,010
$4,131
$3,930
$3,728
$4,060
$3,404
$3,572
$3,702
$4,300
$3,695
$3,930
$4,104
1Q 2009
2Q 2009
3Q 2009
4Q 2009
1Q 2010
2Q 2010
3Q 2010
4Q 2010
1Q 2011
2Q 2011
3Q 2011
4Q 2011
1Q 2012
2Q 2012
1Q 2012
Service charges on deposit
acconts, net
Fees for trust, investment
management and brokerage
Mortgage-banking
Automated teller machine
Merchant services
Bankcard services
Other
2Q 2012
Service charges on deposit acconts, net
Fees for trust, investment management
and brokerage
Mortgage-banking
Automated teller machine
Merchant services
Bankcard services
Other |
 NASDAQ:
PLMT
Noninterest Expense
(excluding provision for loan losses)
27
$10,336
$12,026
$13,039
$12,875
$12,639
$14,808
$22,011
$22,054
$14,061
$17,708
$16,472
$15,141
$11,931
$19,234
1Q 2009
2Q 2009
3Q 2009
4Q 2009
1Q 2010
2Q 2010
3Q 2010
4Q 2010
1Q 2011
2Q 2011
3Q 2011
4Q 2011
1Q 2012
2Q 2012
Operating noninterest expense
Credit-related expenses |
 NASDAQ:
PLMT
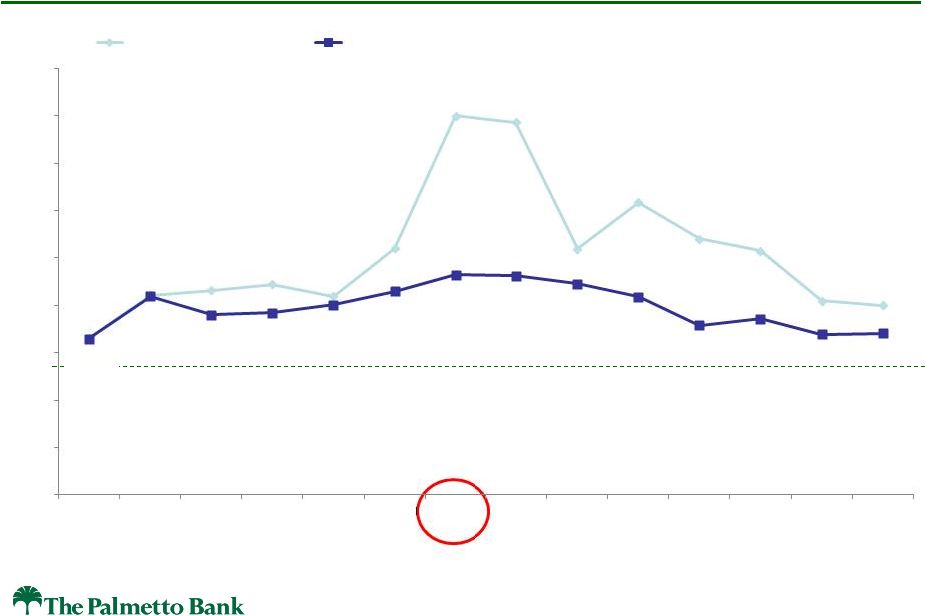
Efficiency Ratio
28
Medium Term Target = 60% (GAAP)
0.0%
20.0%
40.0%
60.0%
80.0%
100.0%
120.0%
140.0%
160.0%
180.0%
1Q 2009
2Q 2009
3Q 2009
4Q 2009
1Q 2010
2Q 2010
4Q 2010
1Q 2011
2Q 2011
3Q 2011
4Q 2011
1Q 2012
2Q 2012
Efficiency
Ratio
-
GAAP
Efficiency
Ratio
-
before
credit-related
and
non-recurring
items,
ex-securities
gains
66.1%
84.4%
86.4%
88.9%
84.0%
104.0%
160.1%
157.2%
103.9%
123.4%
108.0%
103.1%
81.9%
80.0%
83.9%
76.0%
76.8%
80.2%
86.0%
92.9%
92.5%
89.1%
83.6%
71.7%
74.4%
67.8%
68.3%
3Q 2010
65.9% |
 NASDAQ:
PLMT
Expense Reduction through Project SAVE
$6.2 million of annual expense
Savings
through
Automation,
Vendor
management
and
Efficiency
•
Outsourcing
–
Asset-liability management and Internal Audit co-sourcing began
January 1, 2012
–
Check processing outsourcing and related deposit statements process
on April 27, 2012
•
Branch reduction (from 29 to 25)
–
Two consolidations completed on March 30, 2012
–
Two sales completed on July 1, 2012
•
Compensation and benefits
–
Headcount reduced 20% from peak of 420 at December 31, 2008 to
323 at June 30, 2012
–
Salary freeze re-instated in 2012
–
Regular 401(k) Plan employer match suspended in 2012
29 |
 NASDAQ:
PLMT
Remainder of 2012
1.
Emphasis on quality loan production, including
niches (Small Business Administration,
Commercial & Industrial, Corporate Lending,
Indirect Auto and Mortgage)
2.
Margin and fee income pressure, with keen
focus on reducing funding costs
3.
Lower, more predicable credit-related expenses
4.
Clear focus on operating expense reduction
5.
Expected to return to quarterly profitability
30 |
 NASDAQ:
PLMT
2. Improve Asset Quality
31 |
 NASDAQ:
PLMT
Return to Profitability and
Improve Asset Quality
•
Objectives are inter-related with financial results driven primarily by
credit losses
•
Significant
reduction
in
problem
assets
and
improving
quarterly
trends -
reduced
–
Number of problem assets
–
Size of problem assets
–
Losses on problem assets
–
Inflows of problem assets
•
Strategic decision in second quarter 2012 to sell problem assets
at
discounts given
–
Ongoing cost to carry (taxes, insurance, legal fees, utilities,
repairs, etc.)
–
Regulatory and investor perspective on aggregate amount
–
Public perception of continued quarterly losses
32 |
 Nonperforming Assets
33
$63,648
$113,413
$120,297
$124,950
$142,161
$118,280
$113,411
$111,492
$101,484
$87,073
$89,858
$80,852
$72,333
$38,922
0.00%
2.00%
4.00%
6.00%
8.00%
10.00%
12.00%
$-
$20,000
$40,000
$60,000
$80,000
$100,000
$120,000
$140,000
$160,000
1Q 2009
2Q 2009
3Q 2009
4Q 2009
1Q 2010
2Q 2010
3Q 2010
4Q 2010
1Q 2011
2Q 2011
3Q 2011
4Q 2011
1Q 2012
2Q 2012
Nonperforming assets
NPA to total assets
NASDAQ:
PLMT |
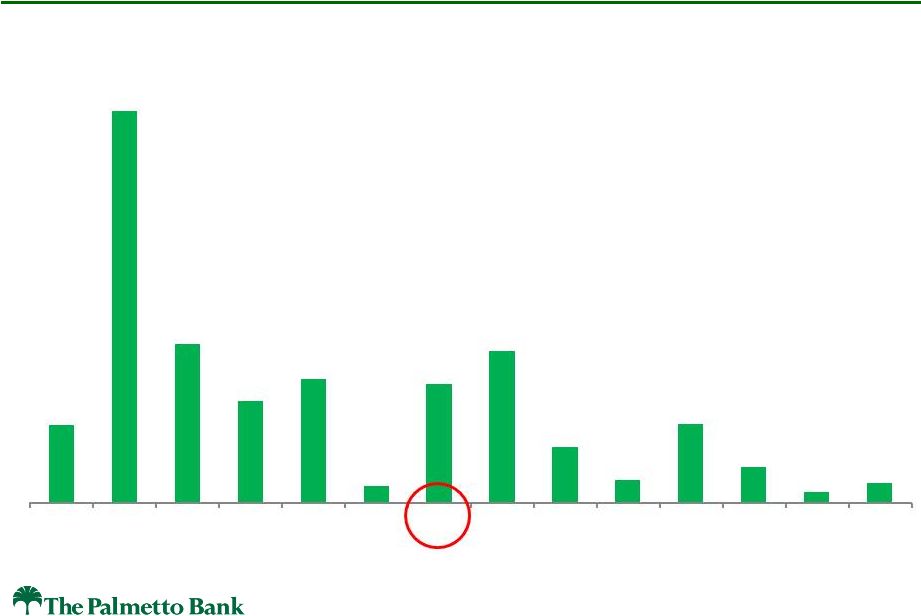 NASDAQ:
PLMT
Nonaccrual Loan Inflows
34
$13,983
$71,020
$28,784
$18,419
$22,423
$2,930
$21,420
$27,449
$10,100
$4,012
$14,140
$6,417
$1,885
$3,520
1Q 2009
2Q 2009
3Q 2009
4Q 2009
1Q 2010
2Q 2010
3Q 2010
4Q 2010
1Q 2011
2Q 2011
3Q 2011
4Q 2011
1Q 2012
2Q 2012 |
 Commercial Real Estate Loans
35
$0
$100,000
$200,000
$300,000
$400,000
$500,000
$600,000
$700,000
$800,000
$900,000
1Q 2009
2Q 2009
3Q 2009
4Q 2009
1Q 2010
2Q 2010
3Q 2010
4Q 2010
1Q 2011
2Q 2011
3Q 2011
4Q 2011
1Q 2012
2Q 2012
Development CRE
Existing and Other CRE
CRE Owner Occupied and Residential
NASDAQ:
PLMT |
 Commercial Real Estate as % of Tier 1 Capital
36
541.3%
596.1%
608.3%
571.2%
639.3%
701.7%
881.3%
341.6%
318.5%
326.0%
326.7%
306.1%
296.5%
288.4%
NASDAQ:
PLMT |
 NASDAQ:
PLMT
Provision for Loan Losses
37
Strategic problem asset
sales at discounted prices |
 NASDAQ:
PLMT
3. Exit Regulatory Agreement
38 |
 NASDAQ:
PLMT
Consent Order and
Regulatory Examinations
39
•
Consent Order: in compliance with all provisions
–
Continued focus on reducing commercial real estate
concentration
–
Elevated leverage capital ratio requirement (8%)
–
Prohibitions on incentive compensation and acquisitions
•
FDIC insurance premiums are based in part on the overall
ratings from the annual Safety and Soundness
examinations
–
Starting in the second quarter 2012, our annual
premiums were reduced by $1 million based on current
deposit levels |
 NASDAQ:
PLMT
4. Execute on Client Service and Support
through Palmetto Partnership
40 |
 NASDAQ:
PLMT
The Path To Profitability!
Project
SAVE
The Palmetto
Partnership
Profitability
Driven by...
Executing
Clients
41 |
 NASDAQ:
PLMT
Leveraging Technology
to Improve the Client Experience
42 |
 NASDAQ:
PLMT
Technology Upgrades to Meet Client Expectations
Upgraded
ATM fleet and locations
DONE!
Upgraded
Telephone Automatic Voice Response Unit
DONE!
Upgraded
Remote Deposit Capture
DONE!
Upgraded
Statements
DONE!
New
Automated Wire Transfer System
DONE!
Upgraded
Real Time Online Banking
DONE!
Upgraded
E-Statement System
DONE!
New
Mobile Friendly Web Site
September
New
Deposit Taking/Imaging ATMs
September
43 |
 NASDAQ:
PLMT
Technology Upgrades to Meet Client Expectations
44
New ACH Fraud Control
September
New Mobile Banking and App
October
Upgraded
Web Site
October
New
Online Personal Finance System
December
New
Electronic Notices Delivered for Loans &
Deposits
TBD
New
Person to Person Payments
TBD
New
Commercial Positive Pay
TBD
New
Electronic Check Recovery
TBD
New
Lockbox System
TBD |
 NASDAQ:
PLMT
Technology Upgrades to
Improve Risk Management and Profitability Analytics
New
Server Automated Monitoring
DONE!
New
Email Archiving
DONE!
Upgraded
Core Processing Hardware with Backup
September
Upgraded
General Ledger, Accounts Payable & Financial
Reporting (Prologue)
September
Upgraded
Customer Relationship Management System
(Encore)
October
New Report Writer and Automated Dashboards
(Data Warehouse)
November
45 |
 NASDAQ:
PLMT
5. Develop a High Performing Culture
and Winning Team
46 |
 NASDAQ:
PLMT
Critical Elements of Our Evolving Culture
1.
Continuous improvement culture (including
“possibility thinking”, automation, and expense
consciousness)
2.
Client
service
and
support
culture
Palmetto
Partnership
3.
Performance culture (personally and corporately)
4.
Winning culture!
47 |
 NASDAQ:
PLMT
Strategic Outlook
48 |
 NASDAQ:
PLMT
2012 Outlook
1.
General economic challenges although some have begun to
moderate in the Upstate
2.
Manage net interest income through continued reduction in time
deposit balances and rates, and reinvestment of excess cash
3.
Improving loan production but still a challenge and very competitive
4.
Focus on fee income, including Treasury Services, Mortgage, Trust
and Investments
5.
Credit losses expected to be significantly lower and more predictable
6.
Sustained focus on efficiency and continued operating expense
reductions
7.
Enhanced infrastructure, including continued technology investment
8.
Recruit high-performing lenders and lending teams
9.
Ongoing talent management
Projected to return to quarterly profitability in 2012
49 |
 NASDAQ:
PLMT
Longer-Term Outlook
1.
Improving and sustained profitability
2.
Removal of Consent Order (2013?)
3.
Reduction of allowance for loan losses coverage ratio
4.
Reversal of deferred tax asset valuation allowance
5.
Improved efficiency ratio (continuation of Project SAVE)
6.
Focused loan production strategy (SBA, C&I, Corporate,
Indirect Auto and Mortgage)
7.
Net interest margin management
8.
Growth through mergers and acquisitions (including potential
niche businesses)
50 |
 NASDAQ:
PLMT
Overall Summary
51 |
 NASDAQ:
PLMT
Value Creation and the Client Experience
Now spending much more of our time and energy on the
future instead of the past…
1.
An experienced team, including M&A and niche expertise
(Retail, Commercial, SBA, Corporate, C&I, etc.)
2.
Product and service bundling focused on the business
and personal life cycles of our clients and prospects
3.
Structured and disciplined sales and business
development process through Palmetto Partnership
4.
Client onboarding and assimilation program to engender
loyalty and identify cross-sell opportunities
5.
Technology that is competitive with the big banks and not
offered by the smaller community banks
52 |
 NASDAQ:
PLMT
Summary Thoughts on the Path Forward
1.
Significant progress on the path to profitability
2.
Asset quality has been aggressively improved
3.
Substantially completed the transition from “workout”
mode to
“value creation”
mode
4.
Clarity of the path forward -
more focused Bank, department, and
individual objectives and expectations
5.
Dedicated team and pride in our Bank
6.
High expectations to cultivate a performance culture and winning
team
7.
Sense of urgency continues and we insist on results, not activity
8.
Taking advantage of market disruption
9.
We are moving the Bank forward –
with intense focus on
profitability, value creation and the client experience
Proactive, comprehensive and focused strategic plan being executed
53 |
 NASDAQ:
PLMT
54
Value of The Palmetto Bank Franchise
1.
105 year legacy with excellent reputation and strong brand
recognition
2.
Historical high performing financial results, with history of
innovation and balanced and fair pricing to our clients
3.
Premier deposit-gathering franchise in an attractive banking
market with strong deposit gathering capability
–
4
th
largest bank headquartered in South Carolina
–
6
th
in deposit share in the Upstate and
1
st
of banks headquartered in South Carolina
–
25 branches in the economically attractive Upstate market along
the Interstate 85 corridor between Atlanta and Charlotte
4.
Heritage of deep client relationships and loyalty, with high touch
client service platform to be leveraged for enhanced sales culture
|