Attached files
| file | filename |
|---|---|
| EX-31.1 - CERTIFICATION - CEO - Granite Falls Energy, LLC | a311-certification73112.htm |
| EX-32.1 - CERTIFICATION - CEO - Granite Falls Energy, LLC | a321-certification73112.htm |
| EX-32.2 - CERTIFICATION - CFO - Granite Falls Energy, LLC | a322-certification73112.htm |
| EX-31.2 - CERTIFICATION - CFO - Granite Falls Energy, LLC | a312-certification73112.htm |
| EXCEL - IDEA: XBRL DOCUMENT - Granite Falls Energy, LLC | Financial_Report.xls |
UNITED STATES
SECURITIES AND EXCHANGE COMMISSION
Washington, D.C. 20549
FORM 10-Q
x | Quarterly report pursuant to Section 13 or 15(d) of the Securities Exchange Act of 1934. |
For the quarterly period ended July 31, 2012 | |
OR | |
o | Transition report pursuant to Section 13 or 15(d) of the Securities Exchange Act of 1934. |
For the transition period from to . | |
COMMISSION FILE NUMBER 000-51277 | |
GRANITE FALLS ENERGY, LLC
(Exact name of registrant as specified in its charter)
Minnesota | 41-1997390 | |||
(State or other jurisdiction of incorporation or organization) | (I.R.S. Employer Identification No.) | |||
15045 Highway 23 SE, Granite Falls, MN 56241-0216 | ||||
(Address of principal executive offices) | ||||
(320) 564-3100 | ||||
(Registrant's telephone number, including area code) | ||||
Indicate by check mark whether the registrant (1) has filed all reports required to be filed by Section 13 or 15(d) of the Securities Exchange Act of 1934 during the preceding 12 months (or for such shorter period that the registrant was required to file such reports), and (2) has been subject to such filing requirements for the past 90 days.
x Yes o No
Indicate by check mark whether the registrant has submitted electronically and posted on its corporate Web site, if any, every Interactive Data File required to be submitted and posted pursuant to Rule 405 of Regulation S-T (§232.405 of this chapter) during the preceding 12 months (or for such shorter period that the registrant was required to submit and post such files).
x Yes o No
Indicate by check mark whether the registrant is a large accelerated filer, an accelerated filer, a non-accelerated filer, or a smaller reporting company. See the definitions of "large accelerated filer," "accelerated filer" and "smaller reporting company" in Rule 12b-2 of the Exchange Act:
Large Accelerated Filer o | Accelerated Filer o |
Non-Accelerated Filer x | Smaller Reporting Company o |
Indicate by check mark whether the registrant is a shell company (as defined in Rule 12b-2 of the Exchange Act).
o Yes x No
Indicate the number of shares outstanding of each of the issuer's classes of common stock, as of the latest practicable date: As of September 14, 2012 there were 30,606 membership units outstanding.
1
INDEX
Page Number | |
2
PART I FINANCIAL INFORMATION
Item 1. Financial Statements
GRANITE FALLS ENERGY, LLC
Condensed Balance Sheets
ASSETS | July 31, 2012 | October 31, 2011 | ||||||
(Unaudited) | ||||||||
Current Assets | ||||||||
Cash | $ | 3,636,715 | $ | 13,064,560 | ||||
Restricted cash | 702,000 | 1,503,000 | ||||||
Accounts receivable | 5,572,697 | 3,777,547 | ||||||
Inventory | 6,979,962 | 8,615,411 | ||||||
Commodity derivative instruments | 55,088 | 404,050 | ||||||
Prepaid expenses and other current assets | 201,002 | 177,793 | ||||||
Total current assets | 17,147,464 | 27,542,361 | ||||||
Property, Plant and Equipment | ||||||||
Land and improvements | 7,095,172 | 3,627,973 | ||||||
Railroad improvements | 4,121,148 | 4,121,148 | ||||||
Process equipment and tanks | 64,241,991 | 63,592,688 | ||||||
Administration building | 279,734 | 279,734 | ||||||
Office equipment | 154,072 | 154,072 | ||||||
Rolling stock | 1,359,896 | 642,908 | ||||||
Construction in progress | 1,869,984 | 366,979 | ||||||
79,121,997 | 72,785,502 | |||||||
Less accumulated depreciation | 40,078,501 | 36,886,541 | ||||||
Net property, plant and equipment | 39,043,496 | 35,898,961 | ||||||
Total Assets | $ | 56,190,960 | $ | 63,441,322 | ||||
Notes to Unaudited Condensed Financial Statements are an integral part of this Statement.
3
GRANITE FALLS ENERGY, LLC
Condensed Balance Sheets
LIABILITIES AND MEMBERS' EQUITY | July 31, 2012 | October 31, 2011 | ||||||
(Unaudited) | ||||||||
Current Liabilities | ||||||||
Current portion of long-term debt | $ | 113,616 | $ | — | ||||
Accounts payable | 1,160,425 | 1,591,036 | ||||||
Corn payable to FCE | 1,867,522 | 2,516,923 | ||||||
Accrued liabilities | 349,549 | 375,425 | ||||||
Distribution payable | — | 9,196,800 | ||||||
Total current liabilities | 3,491,112 | 13,680,184 | ||||||
Long-Term Debt, less current portion | 412,013 | — | ||||||
Commitments and Contingencies | ||||||||
Members' Equity, 30,606 and 30,656 units authorized, issued and outstanding at July 31, 2012 and October 31, 2011, respectively | 52,287,835 | 49,761,138 | ||||||
Total Liabilities and Members’ Equity | $ | 56,190,960 | $ | 63,441,322 | ||||
Notes to Unaudited Condensed Financial Statements are an integral part of this Statement.
4
GRANITE FALLS ENERGY, LLC
Condensed Statements of Operations
Three Months Ended | Three Months Ended | Nine Months Ended | Nine Months Ended | ||||||||||||
July 31, 2012 | July 31, 2011 | July 31, 2012 | July 31, 2011 | ||||||||||||
(Unaudited) | (Unaudited) | (Unaudited) | (Unaudited) | ||||||||||||
Revenues | $ | 42,435,763 | $ | 45,414,923 | $ | 125,206,661 | $ | 110,669,020 | |||||||
Cost of Goods Sold | 42,381,069 | 43,346,542 | 120,806,601 | 101,362,371 | |||||||||||
Gross Profit | 54,694 | 2,068,381 | 4,400,060 | 9,306,649 | |||||||||||
Operating Expenses | 651,881 | 517,900 | 1,906,097 | 1,534,827 | |||||||||||
Operating Income (Loss) | (597,187 | ) | 1,550,481 | 2,493,963 | 7,771,822 | ||||||||||
Other Income (Expense) | |||||||||||||||
Other income, net | 34,357 | 13,754 | 99,905 | 21,094 | |||||||||||
Interest income | 2,452 | 23,144 | 17,733 | 82,145 | |||||||||||
Interest expense | (5,259 | ) | (497 | ) | (18,484 | ) | (6,473 | ) | |||||||
Total other income, net | 31,550 | 36,401 | 99,154 | 96,766 | |||||||||||
Net Income (Loss) | $ | (565,637 | ) | $ | 1,586,882 | $ | 2,593,117 | $ | 7,868,588 | ||||||
Weighted Average Units Outstanding - Basic and Diluted | 30,606 | 30,656 | 30,617 | 30,656 | |||||||||||
Net Income (Loss) Per Unit - Basic and Diluted | $ | (18.48 | ) | $ | 51.76 | $ | 84.70 | $ | 256.67 | ||||||
Distributions Per Unit | $ | — | $ | — | $ | 300.00 | $ | 300.00 | |||||||
Notes to Unaudited Condensed Financial Statements are an integral part of this Statement.
5
GRANITE FALLS ENERGY, LLC
Condensed Statements of Cash Flows
Nine Months Ended | Nine Months Ended | ||||||
July 31, 2012 | July 31, 2011 | ||||||
(Unaudited) | (Unaudited) | ||||||
Cash Flows from Operating Activities | |||||||
Net income | $ | 2,593,117 | $ | 7,868,588 | |||
Adjustments to reconcile net income to net cash provided by operations: | |||||||
Depreciation and amortization | 3,191,960 | 2,931,096 | |||||
Change in fair value of derivative instruments | 1,251,437 | (1,142,583 | ) | ||||
Changes in assets and liabilities: | |||||||
Restricted cash | 801,000 | 71,010 | |||||
Derivative instruments | (902,475 | ) | 1,773,120 | ||||
Accounts receivable | (1,795,150 | ) | (1,434,644 | ) | |||
Inventory | 1,635,449 | (1,156,870 | ) | ||||
Prepaid expenses and other current assets | (23,209 | ) | (39,570 | ) | |||
Accounts payable | (1,080,012 | ) | 1,638,142 | ||||
Accrued liabilities | (92,296 | ) | (140,524 | ) | |||
Net Cash Provided by Operating Activities | 5,579,821 | 10,367,765 | |||||
Cash Flows from Investing Activities | |||||||
Proceeds from maturity of short-term investments | — | 3,500,000 | |||||
Payments for capital expenditures | (1,416,620 | ) | (128,817 | ) | |||
Payments for land acquisition | (3,467,199 | ) | — | ||||
Payments for construction in process | (853,702 | ) | (3,091,877 | ) | |||
Net Cash Provided by (Used in) Investing Activities | (5,737,521 | ) | 279,306 | ||||
Cash Flows from Financing Activities | |||||||
Payments on long-term debt | (73,345 | ) | (45,792 | ) | |||
Member distributions paid | (9,196,800 | ) | (9,196,800 | ) | |||
Net Cash Used in Financing Activities | (9,270,145 | ) | (9,242,592 | ) | |||
Net Increase (Decrease) in Cash | (9,427,845 | ) | 1,404,479 | ||||
Cash - Beginning of Period | 13,064,560 | 10,664,225 | |||||
Cash - End of Period | $ | 3,636,715 | $ | 12,068,704 | |||
Supplemental Cash Flow Information | |||||||
Cash paid during the period for: | |||||||
Interest expense | $ | 18,484 | $ | 6,489 | |||
Supplemental Disclosure of Noncash Investing, Operating and Financing Activities | |||||||
Capital expenditures financed with long-term debt | $ | 598,974 | $ | — | |||
Transfer of construction in process to fixed assets | $ | 649,303 | $ | 2,883,343 | |||
Notes to Unaudited Condensed Financial Statements are an integral part of this Statement.
6
GRANITE FALLS ENERGY, LLC
Notes to UNAUDITED Condensed Financial Statements
July 31, 2012
1. SUMMARY OF SIGNIFICANT ACCOUNTING POLICIES
Basis of Presentation
The accompanying condensed balance sheet as of October 31, 2011 is derived from audited financial statements. The unaudited interim condensed financial statements of Granite Falls Energy, LLC (the “Company”) reflect all adjustments consisting only of normal recurring adjustments that are, in the opinion of management, necessary for a fair presentation of financial position and results of operations and cash flows. The results for the three and nine month periods ended July 31, 2012 are not necessarily indicative of the results that may be expected for a full fiscal year. Certain information and note disclosures normally included in annual financial statements prepared in accordance with accounting principles generally accepted in the United States of America (“GAAP”) are condensed or omitted pursuant to the rules and regulations of the Securities and Exchange Commission (“SEC”), although the Company believes that the disclosures made are adequate to make the information not misleading. These condensed financial statements should be read in conjunction with the Company's audited financial statements and notes thereto included in its annual report for the year ended October 31, 2011 filed on Form 10-K with the SEC.
Nature of Business
Granite Falls Energy, LLC (“GFE” or the “Company”) is a Minnesota limited liability company currently producing fuel-grade ethanol, distillers grains, and crude corn oil near Granite Falls, Minnesota and sells these products throughout the continental United States and on the international market. GFE's plant has an approximate annual production capacity of 60 million gallons, but is currently permitted to produce up to 70 million gallons of undenatured ethanol on a twelve month rolling sum basis.
Accounting Estimates
Management uses estimates and assumptions in preparing these condensed financial statements in accordance with generally accepted accounting principles in the United States of America. Those estimates and assumptions affect the reported amounts of assets and liabilities, the disclosure of contingent assets and liabilities, and the reported revenues and expenses. The Company uses estimates and assumptions in accounting for the following significant matters, among others: economic lives of property, plant, and equipment, valuation of commodity derivatives and inventory, and the assumptions used in the impairment analysis of long-lived assets. Actual results may differ from previously estimated amounts, and such differences may be material to our condensed financial statements. The Company periodically reviews estimates and assumptions, and the effects of revisions are reflected in the period in which the revision is made.
Revenue Recognition
The Company generally sells ethanol and related products pursuant to marketing agreements. Revenues from the production of ethanol and the related products are recorded when the customer has taken title and assumed the risks and rewards of ownership, prices are fixed or determinable and collectability is reasonably assured. Ethanol and related products are generally shipped free on board (FOB) shipping point. The Company believes there are no ethanol sales, during any given month, which should be considered contingent and recorded as deferred revenue.
In accordance with the Company's agreements for the marketing and sale of ethanol and related products, marketing fees and commissions due to the marketers are deducted from the gross sales price as earned. These fees and commissions are recorded net of revenues as they do not provide an identifiable benefit that is sufficiently separable from the sale of ethanol and related products. Shipping costs incurred by the Company in the sale of ethanol are not specifically identifiable and as a result, are recorded based on the net selling price reported to the Company from the marketer. Shipping costs incurred by the Company in the sale of distillers grains and corn oil are included in cost of goods sold.
Derivative Instruments
From time to time the Company enters into derivative transactions to hedge its exposures to commodity price fluctuations. The Company is required to record these derivatives in the balance sheet at fair value.
In order for a derivative to qualify as a hedge, specific criteria must be met and appropriate documentation maintained. Gains and losses from derivatives that do not qualify as hedges, or are undesignated, must be recognized immediately in earnings. If the
7
GRANITE FALLS ENERGY, LLC
Notes to UNAUDITED Condensed Financial Statements
July 31, 2012
derivative does qualify as a hedge, depending on the nature of the hedge, changes in the fair value of the derivative will be either offset against the change in fair value of the hedged assets, liabilities, or firm commitments through earnings or recognized in other comprehensive income until the hedged item is recognized in earnings. Changes in the fair value of undesignated derivatives are recorded in cost of goods sold.
Additionally, the Company is required to evaluate its contracts to determine whether the contracts are derivatives. Certain contracts that literally meet the definition of a derivative may be exempted as “normal purchases or normal sales”. Normal purchases and normal sales are contracts that provide for the purchase or sale of something other than a financial instrument or derivative instrument that will be delivered in quantities expected to be used or sold over a reasonable period in the normal course of business. Contracts that meet the requirements of normal purchases or sales are documented as normal and exempted from accounting and reporting requirements, and therefore, are not marked to market in our financial statements.
In order to reduce the risks caused by market fluctuations, the Company occasionally hedges its anticipated corn, natural gas, and denaturant purchases and ethanol sales by entering into options and futures contracts. These contracts are used with the intention to fix the purchase price of anticipated requirements for corn in the Company's ethanol production activities and the related sales price of ethanol. The fair value of these contracts is based on quoted prices in active exchange-traded or over-the-counter market conditions. Although the Company believes its commodity derivative positions are economic hedges, none have been formally designated as a hedge for accounting purposes and derivative positions are recorded on the balance sheet at their fair market value, with changes in fair value recognized in current period earnings or losses. The Company does not enter into financial instruments for trading or speculative purposes.
The Company has adopted authoritative guidance related to “Derivatives and Hedging,” and has included the required enhanced quantitative and qualitative disclosure about objectives and strategies for using derivatives, quantitative disclosures about fair value amounts of gains and losses from derivative instruments, and disclosures about credit-risk-related contingent features in derivative agreements. See further discussion in Note 4.
2. RISKS AND UNCERTAINTIES
The Company has certain risks and uncertainties that it experiences during volatile market conditions. These volatilities can have a severe impact on operations. The Company's revenues are derived from the sale and distribution of ethanol, distillers grains, and corn oil to customers primarily located in the U.S. Corn for the production process is supplied to our plant primarily from local agricultural producers and from purchases on the open market. Ethanol sales typically average 80-85% of total revenues and corn costs typically average 70-80% of cost of goods sold.
The Company's operating and financial performance is largely driven by the prices at which they sell ethanol and the net expense of corn. The price of ethanol is influenced by factors such as supply and demand, the weather, government policies and programs, and unleaded gasoline prices and the petroleum markets as a whole. Excess ethanol supply in the market, in particular, puts downward pressure on the price of ethanol. Our largest cost of production is corn. The cost of corn is generally impacted by factors such as supply and demand, the weather, government policies and programs, and our risk management program used to protect against the price volatility of these commodities.
3. INVENTORY
Inventories consist of the following:
July 31, 2012 | October 31, 2011 | ||||||
Raw materials | $ | 2,846,056 | $ | 5,323,615 | |||
Spare parts | 656,271 | 584,011 | |||||
Work in process | 1,299,548 | 1,150,239 | |||||
Finished goods | 2,178,087 | 1,557,546 | |||||
Totals | $ | 6,979,962 | $ | 8,615,411 | |||
The Company performs a lower of cost or market analysis on inventory to determine if the market values of inventories are less than their carrying value, which is attributable primarily to decreases in market prices of corn and ethanol. Based on the lower of cost or market analysis, the Company recorded a lower of cost or market change on corn inventories totaling approximately
8
GRANITE FALLS ENERGY, LLC
Notes to UNAUDITED Condensed Financial Statements
July 31, 2012
$377,000 for the nine months ended July 31, 2012. The loss was recorded in costs of goods sold in the statement of operations.
4. DERIVATIVE INSTRUMENTS
As of July 31, 2012, the total notional amount of the Company's outstanding corn derivative instruments was approximately 255,000 bushels that were entered into to hedge forecasted corn purchases through December 2012.
The following tables provide details regarding the Company's derivative instruments at July 31, 2012, none of which are designated as hedging instruments:
Balance Sheet location | Assets | Liabilities | |||||||
Corn contracts | Commodity Derivative instruments | $ | 55,088 | $ | — | ||||
Totals | $ | 55,088 | $ | — | |||||
In addition, as of July 31, 2012 the Company maintained $102,000 of restricted cash related to margin requirements for the Company's commodity derivative instrument positions.
As of October 31, 2011, the total notional amount of the Company's outstanding corn derivative instruments was approximately 2,580,000 bushels that were entered into to hedge forecasted corn purchases through March 2012.
The following tables provide details regarding the Company's derivative instruments at October 31, 2011, none of which are designated as hedging instruments:
Balance Sheet location | Assets | Liabilities | |||||||||
Corn contracts | Commodity Derivative instruments | $ | 404,050 | $ | — | ||||||
Totals | $ | 404,050 | $ | — | |||||||
In addition, as of October 31, 2011 the Company maintained $903,000 of restricted cash related to margin requirements for the Company's commodity derivative instrument positions.
The following tables provide details regarding the gains and (losses) from Company's derivative instruments in statements of operations, none of which are designated as hedging instruments:
Statement of Operations location | Three Months Ended July 31, | |||||||||||
2012 | 2011 | |||||||||||
Ethanol contracts | Revenue | — | 5,920 | |||||||||
Corn contracts | Cost of Goods Sold | 49,813 | (1,093,853 | ) | ||||||||
Natural gas contracts | Cost of Goods Sold | — | (13,360 | ) | ||||||||
Total gain (loss) | $ | 49,813 | $ | (1,101,293 | ) | |||||||
9
GRANITE FALLS ENERGY, LLC
Notes to UNAUDITED Condensed Financial Statements
July 31, 2012
Statement of Operations location | Nine Months Ended July 31, | |||||||||||
2012 | 2011 | |||||||||||
Ethanol contracts | Revenue | — | (4,626 | ) | ||||||||
Corn contracts | Cost of Goods Sold | (1,251,437 | ) | 1,151,754 | ||||||||
Natural gas contracts | Cost of Goods Sold | — | (4,545 | ) | ||||||||
Total gain (loss) | $ | (1,251,437 | ) | $ | 1,142,583 | |||||||
5. REVOLVING LINE OF CREDIT
The Company had a Loan Agreement with a bank. Under the Loan Agreement, the Company had a revolving line of credit with a maximum of $6,000,000 available through March 2013 that was secured by substantially all of the Company's assets. The interest rate on the revolving line of credit was at 0.25 percentage points above the prime rate as reported by the Wall Street Journal, with a minimum rate of 4.0%. The interest rate on the revolving line of credit at July 31, 2012 was 4.0%, the minimum rate under the terms of the agreement. At July 31, 2012, the Company had no outstanding balance on this line of credit. The Company was required to maintain a savings account balance with the Bank totaling 10% of the maximum amount available on the line of credit to serve as collateral on this line of credit. At both July 31, 2012 and October 31, 2011, this amount totaled $600,000 and is included in restricted cash.
Subsequent to the quarter ended July 31, 2012, the Company terminated this revolving line of credit and entered into two new credit facilities with a different bank. The first is a revolving line of credit with a maximum of $6,000,000 available through August 2013. The second is a revolving term loan with a maximum of $8,000,000 available. The interest rates for both facilities are based on the one-month LIBOR rate plus 2.65% and 2.90% on the line of credit and revolving term loan, respectively. There are no savings account balance collateral requirements as part of this new credit facility. The Company currently has not made any advances on either of these two credit facilities.
The Company also has letters of credit totaling $386,928 as part of a credit requirement of Northern Natural Gas. Subsequent to the quarter ended July 31, 2012, these letters of credit were transferred to the Company's new lender as part of the new credit facilities. These letters of credit reduce the amount available under the revolving line of credit to approximately $5,613,000.
6. LONG-TERM DEBT
Long-term debt consists of the following:
July 31, 2012 | October 31, 2011 | ||||||
Capital One Equipment Leasing/Finance: | |||||||
Shuttlewagon Railcar Mover (5 year term at 3.875%) | $ | 525,629 | $ | — | |||
Less: Current Maturities | (113,616 | ) | — | ||||
Total Long-Term Debt | $ | 412,013 | $ | — | |||
7. LEASES
The Company has a lease agreement with Trinity Industries Leasing Company (“Trinity”) for 76 hopper cars to assist with the transport of distiller's grains by rail through April 2018. The Company will pay Trinity $620 per month plus $0.03 per mile traveled in excess of 36,000 miles per year. Rent expense for these leases was approximately $139,500 and $137,049 for the three month periods ended July 31, 2012 and 2011, respectively.
At July 31, 2012, the Company had lease agreements with three leasing companies for 177 rail car leases for the transportation of the Company's ethanol with various maturity dates through October 2017. The rail car lease payments are due monthly in the
10
GRANITE FALLS ENERGY, LLC
Notes to UNAUDITED Condensed Financial Statements
July 31, 2012
aggregate amount of approximately $107,000. Rent expense for these leases was approximately $317,904 and $318,272 for the three month periods ended July 31, 2012 and 2011, respectively.
8. MEMBERS' EQUITY
The Company has one class of membership units. The units have no par value and have identical rights, obligations and privileges. Income and losses are allocated to all members based upon their respective percentage of units held. As of July 31, 2012 and October 31, 2011, the Company had 30,606 and 30,656 respectively, membership units issued and outstanding.
In October 2011, the Board of Governors declared a cash distribution of $300 per unit or $9,196,800 for unit holders of record as of October 27, 2011. The distribution was paid on December 15, 2011.
In December 2011, the Board of Governors exercised its discretion to redeem 50 membership units totaling $66,420 from an investor due to a unique restriction on transfers situation.
11
GRANITE FALLS ENERGY, LLC
Notes to UNAUDITED Condensed Financial Statements
July 31, 2012
9. FAIR VALUE
The following table provides information on those liabilities measured at fair value on a recurring basis at July 31, 2012:
Carrying Amount in Balance Sheet July 31, 2012 | Fair Value July 31, 2012 | Fair Value Measurement Using | ||||||||||||||||||
Quoted Prices in Active Markets (Level 1) | Significant Other Observable Inputs (Level 2) | Significant unobservable inputs (Level 3) | ||||||||||||||||||
Financial Assets: | ||||||||||||||||||||
Commodity derivative instruments | $ | 55,088 | $ | 55,088 | $ | 55,088 | $ | — | $ | — | ||||||||||
The fair value of the derivative instruments are based on quoted market prices in an active market.
The following table provides information on those assets measured at fair value on a recurring basis at October 31, 2011:
Carrying Amount in Balance Sheet October 31, 2011 | Fair Value October 31, 2011 | Fair Value Measurement Using | |||||||||||||
Quoted Prices in Active Markets (Level 1) | Significant Other Observable Inputs (Level 2) | Significant unobservable inputs (Level 3) | |||||||||||||
Financial Assets: | |||||||||||||||
Commodity derivative instruments | $ | 404,050 | $ | 404,050 | $ | 404,050 | $ | — | $ | — | |||||
The fair value of the derivative instruments are based on quoted market prices in an active market.
10. COMMITMENTS AND CONTINGENCIES
Corn Storage and Grain Handling Agreement and Purchase Commitments
The Company has a corn storage and grain handling agreement with Farmers Cooperative Elevator Company (FCE), a member. Under the current agreement, the Company agrees to purchase all of the corn needed for the operation of the plant from FCE. The price of the corn purchased will be the bid price the member establishes for the plant plus a set fee per bushel. At July 31, 2012, the Company had 3.7 million bushels of forward purchased basis only corn with FCE. At October 31, 2011, the Company had 460,000 bushels of stored corn totaling $2,862,550 with FCE.
Ethanol Contracts
At July 31, 2012, the Company had forward ethanol sales contracts totaling approximately 9.1 million gallons for various delivery periods from August 2012 to October 2012. The prices on these contracts have a basis level established by the Oil Price Information Service (“OPIS”) Chicago ethanol market and the OPIS Los Angeles market between -$0.09 and -$0.27.
Distillers Grains Contracts
At July 31, 2012, the Company had forward distillers grains sales contracts totaling approximately 5,575 tons for various delivery periods from August 2012 to October 2012 at an average price of approximately $258 per ton.
Natural Gas Contracts
At July 31, 2012, the Company had forward contracts to purchase approximately 210,000 British thermal units (MMBTU) of
12
GRANITE FALLS ENERGY, LLC
Notes to UNAUDITED Condensed Financial Statements
July 31, 2012
natural gas during the months of August 2012 through March 2013 at an average price of approximately $4.37 per MMBTU.
Corn Oil Contracts
At July 31, 2012, the Company had forward corn oil sales contracts totaling approximately 2.7 million pounds for various delivery periods from August 2012 to December 2012 at an average price of approximately $0.38 per pound.
Rail Infrastructure Improvement Project
The Company is currently in the process of a rail infrastructure improvement project. As of July 31, 2012 the Company has acquired approximately $3,500,000 of land that will be used for this project. The Company has contracts with various contractors totaling approximately $3.8 million to construct the project, of which approximately $1,540,000 has been completed as of July 31, 2012. The project is expected to be completed in late 2012.
11. LEGAL PROCEEDINGS
From time to time in the ordinary course of business, the Company may be named as a defendant in legal proceedings related to various issues, including without limitation, workers' compensation claims, tort claims, or contractual disputes. We are not currently a party to any material pending legal proceedings and we are not currently aware of any such proceedings contemplated by governmental authorities.
13
Item 2. Management's Discussion and Analysis of Financial Condition and Results of Operations
We prepared the following discussion and analysis to help you better understand our financial condition, changes in our financial condition, and results of operations for the three and nine month periods ended July 31, 2012, compared to the same period of the prior fiscal year. This discussion should be read in conjunction with the condensed financial statements and notes and the information contained in the Company's Annual Report on Form 10-K for the fiscal year ended October 31, 2011.
Disclosure Regarding Forward-Looking Statements
This report contains historical information, as well as forward-looking statements. These forward-looking statements include any statements that involve known and unknown risks and relate to future events and our expectations regarding future performance or conditions. Words such as “may,” “will,” “should,” “expect,” “plan,” “anticipate,” “believe,” “estimate,” “future,” “intend,” “could,” “hope,” “predict,” “target,” “potential,” or “continue” or the negative of these terms or other similar expressions are intended to identify forward-looking statements, but are not the exclusive means of identifying such statements. These forward-looking statements, and others we make from time to time, are subject to a number of risks and uncertainties. Many factors could cause actual results to differ materially from those projected in forward-looking statements. While it is impossible to identify all such factors, factors that could cause actual results to differ materially from those estimated by us include, but are not limited to:
• | Changes in the availability and price of corn and natural gas; |
• | Demand for corn exceeding supply; and corresponding corn price increases; |
• | Changes in our business strategy, capital improvements or development plans; |
• | Our ability to profitably operate the ethanol plant and maintain a positive spread between the selling price of our products and our raw materials costs; |
• | Results of our hedging transactions and other risk management strategies; |
• | Decreases in the market prices of ethanol and distillers grains; |
• | Ethanol supply exceeding demand; and corresponding ethanol price reductions; |
• | Changes in the environmental regulations that apply to our plant operations and changes in our ability to comply with such regulations; |
• | Changes in plant production capacity or technical difficulties in operating the plant; |
• | Changes in general economic conditions or the occurrence of certain events causing an economic impact in the agriculture, oil or automobile industries; |
• | Lack of transport, storage and blending infrastructure preventing ethanol from reaching high demand markets; |
• | Changes in federal and/or state laws (including the elimination of any federal and/or state ethanol tax incentives); |
• | Changes and advances in ethanol production technology; |
• | Effects of mergers, consolidations or contractions in the ethanol industry; |
• | Competition from alternative fuel additives; |
• | The development of infrastructure related to the sale and distribution of ethanol; |
• | Our inelastic demand for corn, as it is the only available feedstock for our plant; |
• | Our ability to retain key employees and maintain labor relations; |
• | Changes to our current water intake system, or our ability to cost-effectively construct a modified water intake system, if necessary; and |
• | Volatile commodity and financial markets. |
The cautionary statements referred to in this section also should be considered in connection with any subsequent written or oral forward-looking statements that may be issued by us or persons acting on our behalf. We do not undertake any duty to update forward-looking statements after the date they are made or to conform forward-looking statements to actual results or to changes in circumstances or expectations. Furthermore, we cannot guarantee future results, events, levels of activity, performance, or achievements. We caution you not to put undue reliance on any forward-looking statements, which speak only as of the date of this report. You should read this report and the documents that we reference in this report and have filed as exhibits, completely and with the understanding that our actual future results may be materially different from what we currently expect. We qualify all of our forward-looking statements by these cautionary statements.
Overview
Granite Falls Energy, LLC (“Granite Falls Energy” or the “Company”) is a Minnesota Limited Liability Company formed on December 29, 2000.
We are currently producing fuel-grade ethanol, distillers grains and crude corn oil for sale. Our plant has an approximate
14
annual production capacity of 60 million gallons of denatured ethanol, but is currently permitted to produce up to 70 million gallons of undenatured ethanol on a twelve month rolling sum basis. We intend to continue working toward increasing production to take advantage of the additional production allowed pursuant to our permit as long as we believe it is profitable to do so.
Our operating results are largely driven by the prices at which we sell our ethanol, distillers grains, and corn oil as well as the other costs related to production. The price of ethanol has historically fluctuated with the price of petroleum-based products such as unleaded gasoline, heating oil and crude oil. The price of distillers grains has historically been influenced by the price of corn as a substitute livestock feed. We expect these price relationships to continue for the foreseeable future, although recent volatility in the commodities markets makes historical price relationships less reliable. Our largest costs of production are corn, natural gas, depreciation and manufacturing chemicals. Our cost of corn is largely impacted by geopolitical supply and demand factors and the outcome of our risk management strategies. Prices for natural gas, manufacturing chemicals and denaturant are tied directly to the overall energy sector, crude oil and unleaded gasoline.
A continuing widespread drought in several corn producing states, combined with continued corn demand from other sectors, has resulted in increasing corn prices. At this point in the growing season it is unlikely that even significant rains will materially improve lower projected yields. As a result, we anticipate that corn prices will remain high through at least the 2013 harvest, as that is the earliest possible time that corn producers may be able to generate significant additional domestic production. If we are unable to offset increases in corn prices with increases in the price of our products, we may experience a prolonged period of tight or negative profit margins.
Additionally, the federal Renewable Fuels Standard, known as RFS2, has recently come under scrutiny. RFS2 requires the use of a specified amount of renewable fuels in the United States. In 2012, RFS2 requires approximately 15.2 billion gallons, of which corn based ethanol can be used to satisfy approximately 13.2 billion gallons. However, under the provisions of the law implementing RFS2, the Environmental Protection Agency (EPA) has the authority to waive the mandated RFS2 requirements in whole or in part. In August 2012, Governors of the States of Arkansas and North Carolina submitted separate letters to EPA requesting a waiver of required volumes under RFS2. Additionally, other organizations and individuals, including state governors, members of Congress, livestock and dairy groups, and food and beverage producers, have also submitted letters to EPA in support of a waiver of RFS2. EPA is currently seeking public comment on these requests. Although we do not expect the EPA to grant the requests to waive RFS2, if the efforts of those seeking to waive RFS2 are successful, demand for ethanol could be negatively impacted.
As of the date of this report, we have 37 full time employees. Ten of these employees are involved primarily in management and administration. The remaining employees are involved primarily in plant operations. We do not currently anticipate any significant change in the number of employees at our plant.
Results of Operations for the Three Months Ended July 31, 2012 and 2011
The following table shows the results of our operations and the approximate percentage of revenues, costs of goods sold, operating expenses and other items to total revenues in our unaudited statements of operations for the three months ended July 31, 2012 and 2011:
2012 | 2011 | ||||||||||||
Income Statement Data | Amount | % | Amount | % | |||||||||
Revenue | $ | 42,435,763 | 100.0 | % | $ | 45,414,923 | 100.0 | % | |||||
Cost of Goods Sold | 42,381,069 | 99.9 | % | 43,346,542 | 95.4 | % | |||||||
Gross Profit | 54,694 | 0.1 | % | 2,068,381 | 4.6 | % | |||||||
Operating Expenses | 651,881 | 1.5 | % | 517,900 | 1.1 | % | |||||||
Operating Income (Loss) | (597,187 | ) | (1.4 | )% | 1,550,481 | 3.4 | % | ||||||
Other Income, net | 31,550 | 0.1 | % | 36,401 | 0.1 | % | |||||||
Net Income (Loss) | $ | (565,637 | ) | (1.3 | )% | $ | 1,586,882 | 3.5 | % | ||||
Revenues
Our revenues from operations come from three primary sources: sales of fuel ethanol, sales of distillers grains and sales of corn oil.
15
The following table shows the sources of our revenue for the three months ended July 31, 2012:
Revenue Sources | Amount | Percentage of Total Revenues | |||||
Ethanol sales | $ | 32,999,732 | 77.8 | % | |||
Distillers grains sales | 8,054,122 | 19.0 | % | ||||
Corn oil sales | 1,381,909 | 3.2 | % | ||||
Total Revenues | $ | 42,435,763 | 100.0 | % | |||
The following table shows the sources of our revenue for the three months ended July 31, 2011:
Revenue Sources | Amount | Percentage of Total Revenues | |||||
Ethanol sales | $ | 38,254,903 | 84.3 | % | |||
Distillers grains sales | 6,014,127 | 13.2 | % | ||||
Corn oil sales | 1,139,973 | 2.5 | % | ||||
Ethanol derivative activity gains | 5,920 | — | % | ||||
Total Revenues | $ | 45,414,923 | 100.0 | % | |||
In the three month period ended July 31, 2012, ethanol sales comprised 77.8% of our revenues and distillers grains sales comprised 19.0% percent of our revenues, while corn oil sales comprised 3.2% of our revenues. For the three month period ended July 31, 2011, ethanol sales comprised 84.3% of our revenue, without including ethanol derivatives, and distillers grains sales comprised 13.2% of our revenue, while corn oil sales comprised 2.5% of our revenues.
The average ethanol sales price we received for the three month period ended July 31, 2012 was approximately 16.0% lower than our average ethanol sales price for the comparable 2011 period. Management attributes the decrease in our average ethanol sales price to sustained market oversupply resulting from anticipation of the expiration of the Federal Volumetric Ethanol Excise Tax Credit (“VEETC”) on December 31, 2011. In an effort to capture as much of the VEETC as possible, blenders maximized the amount of ethanol they could blend at the end of calendar 2011. As a result of that timing, demand slowed during the beginning of calendar 2012, resulting in increased ethanol inventories, which have pressured ethanol prices downward. Downward pressure on ethanol prices, combined with increased corn prices, have recently caused some ethanol plants to suspend production. Although these suspensions will reduce the total quantity of ethanol produced domestically, management does not anticipate that this reduction in supply will materially impact ethanol prices moving forward. Management anticipates that the price of ethanol will continue to be volatile during the remainder of our 2012 fiscal year, continuing into our 2013 fiscal year. Our volume of ethanol sold during the three month period ended July 31, 2012 was approximately 2.7% higher than the volume sold for the comparable 2011 period.
Distillers grains represent a larger portion of our revenues during the three months ended July 31, 2012 compared to the same period of 2011 as a result of higher prices and greater quantities of distillers grains produced and sold during our third fiscal quarter of 2012 compared to the same period of 2011. The price we received for our dried distillers grains in the three month period ended July 31, 2012 was approximately 18.2% higher than the price we received during the three months ended July 31, 2011. Management believes these higher distillers grains prices are a result of the high price of other feed products available to livestock producers. We anticipate that the market price of our dried distillers grains will continue to be volatile as a result of changes in the price of corn and competing animal feed substitutes such as soybean meal. Volatility in distillers grains supplies related to changes in ethanol production is another factor that may impact the sales price of our distillers grains. Additionally, our quantity of distillers grains sold increased approximately 13.3% in the three month period ended July 31, 2012 compared to the three months ended July 31, 2011. This increase in quantity sold was largely a result of a sizable portion of our third quarter 2011 production not being sold until the fourth quarter of 2011. The price and quantity increases, combined with the decrease in ethanol prices discussed above, resulted in distillers grains sales comprising a larger percentage of our total revenues during the three months ended July 31, 2012 relative to the same period during the prior year.
Corn oil represented a greater portion of our revenues during the three months ended July 31, 2012 than it did for the same period of 2011. Corn oil sales accounted for approximately 3.2% of our revenues during our quarter ended July 31, 2012 compared to 2.5% for our quarter ended July 31, 2011. The price we received for our corn oil decreased by approximately 11.1% during the three months ended July 31, 2012 compared to the same period of 2011. However, offsetting this price decrease, our
16
total volume of corn oil sold increased by 36.4% as a result higher production rates at our facility and increased extraction efficiencies. Management attributes the decrease in corn oil prices to additional corn oil entering the market. However, increased use of corn oil by biodiesel producers and animal feeders have continued to support demand.
We occasionally engage in hedging activities with respect to our ethanol sales. We recognize the gains or losses that result from the changes in the value of these derivative instruments in revenues as the changes occur. As ethanol prices fluctuate, the value of our derivative instruments are impacted, which affects our financial performance. We anticipate continued volatility in our revenues due to the timing of the changes in value of the derivative instruments relative to the price and volume of the ethanol being hedged. We did not recognize any gains or losses for the three month period ended July 31, 2012 related to our ethanol derivative instruments, as compared to a $5,920 combined realized and unrealized gain for the three months ended July 31, 2011 related to our ethanol derivative instruments, which increased our revenues.
Our results of operations for our 2012 fiscal year will continue to be affected by volatility in the commodity markets. If plant operating margins are negative for an extended period of time, management anticipates that this could negatively impact our liquidity. Management believes the industry will need to continue to grow demand and further develop an ethanol distribution system to facilitate additional blending of ethanol and gasoline to offset oversupply issues within the industry. In April 2012, the U.S. Environmental Protection Agency ("EPA") approved the first applications for registering ethanol for use in making a blend of fifteen percent ethanol, known as E15. Since that time, our application with the EPA to register ethanol for use in making E15 has also been approved. We are optimistic that over time, as E15 is brought to market and gains market acceptance, demand for ethanol will increase. However, we do not anticipate that the EPA's approval of applications for registering ethanol for use in making E15 will impact ethanol demand or pricing in the near term.
Cost of Sales
Our costs of goods sold as a percentage of revenues were 99.9% for the three month period ended July 31, 2012 compared to 95.4% for the same period of 2011. Our two largest costs of production are corn (86.9% of cost of goods sold for our three months ended July 31, 2012) and natural gas (2.9% of cost of goods sold for our three months ended July 31, 2012). Our total cost of goods sold decreased to approximately $42,381,000 for the three months ended July 31, 2012 from approximately $43,347,000 in the three months ended July 31, 2011. The volume of corn we processed was up 7.6% for the three months ended July 31, 2012 as compared to the same period for our 2011 fiscal year. However, our per bushel corn costs decreased by approximately 4.0% for the three months ended July 31, 2012 as compared to the same period for our 2011 fiscal year. Recent widespread drought in several corn producing states, combined with continued corn demand from other sectors, has resulted in increasing corn prices. Management anticipates that corn prices will remain high throughout 2012 and for the duration of our 2013 fiscal year. The USDA's World Agricultural Supply and Demand Estimates published on August 10, 2012 projects domestic corn production of 10.8 billion bushels for the 2012 growing season, which would be the lowest production since the 2006 growing season. Although management does not expect the drought to impact corn production in Minnesota to the same extent as other corn producing states, as a local consumer of corn we must nevertheless be cost competitive when sourcing corn in order to procure sufficient quantities for ethanol production. Management expects continued upward pressure on corn prices and tightened corn supplies moving forward.
For the three month period ended July 31, 2012, we experienced a decrease of approximately 33.5% in our overall natural gas costs compared to the same period of 2011. Falling natural gas prices have decreased our natural gas costs, even though our natural gas consumption has risen as a result of our increased ethanol production during the quarter ended July 31, 2012 as compared to the same period in 2011. We expect the market price for natural gas to remain steady in the near term as we continue to enjoy an abundant supply of domestic natural gas, due in part to the continued commissioning of new, highly productive natural gas wells.
We occasionally engage in hedging activities with respect to corn, natural gas or denaturant. We recognize the gains or losses that result from the changes in the value of our derivative instruments in cost of goods sold as the changes occur. As corn, natural gas and denaturant prices fluctuate, the value of our derivative instruments are impacted, which affects our financial performance. We anticipate continued volatility in our cost of goods sold due to the timing of the changes in value of the derivative instruments relative to the cost and use of the commodity being hedged.
We experienced an approximate $50,000 combined realized and unrealized gain for the three month period ended July 31, 2012 related to our corn derivative instruments, which decreased our cost of goods sold. By comparison, we experienced an approximate $1,107,000 combined realized and unrealized loss for the three months ended July 31, 2011 related to our corn and natural gas derivative instruments, which increased our cost of goods sold. We recognize the gains or losses that result from the changes in the value of our derivative instruments from corn and natural gas in cost of goods sold as the changes occur. As corn and natural gas prices fluctuate, the value of our derivative instruments are impacted, which affects our financial performance.
17
Operating Expense
Our operating expenses as a percentage of revenues increased to 1.5% for the three month period ended July 31, 2012 from 1.1% for the same period ended July 31, 2011. The increase in our operating expenses for the three months ended July 31, 2012 as compared to the same period for our 2011 fiscal year is due primarily to an increase in various administrative expenses. We continue to focus on increasing our operating efficiency and we strive to lower our operating expenses.
Operating Income (Loss)
Our income (loss) from operations for the three months ended July 31, 2012 was a loss of approximately $597,000 compared to income of approximately $1,550,000 for the three months ended July 31, 2011. This decrease in our operating income is primarily due to decreased ethanol sales prices.
Other Income and Expense
We had other income for the three months ended July 31, 2012 of $31,550 compared to other income of $36,401 for the three months ended July 31, 2011.
Our other income and expense includes other income, net of $34,357 for the three months ended July 31, 2012, as compared to $13,754 for the same period the prior year. Our other income, net increased primarily due to miscellaneous income during the quarter ended July 31, 2012.
Also included in other income and expense is our interest income and expense. Interest expense for the three months ended July 31, 2012, totaled approximately $5,259, compared to approximately $497 of interest expense for the three months ended July 31, 2011. The interest expense incurred during the three months ended July 31, 2012 is attributable to a 5 year, 3.875% note we took to purchase a Shuttlewagon Railcar Mover in December 2011 and the one percent fee on our letters of credit. The interest expense incurred during the three months ended July 31, 2011 is attributable to our low interest loan obtained through a local Economic Development Authority ("EDA") and the one percent fee on our letters of credit. On August 26, 2011, the board of governors decided to repay the EDA loan in the amount of approximately $187,000.
Our interest income was lower for the three months ended July 31, 2012 when compared to the three months ended July 31, 2011. This reduction in interest income is primarily a result of us having less cash on hand during the quarter ended July 31, 2012 as compared to the same period the prior year.
Results of Operations for the Nine Months Ended July 31, 2012 and 2011
The following table shows the results of our operations and the percentage of revenues, cost of goods sold, operating expenses and other items to total revenues in our statement of operations for the nine months ended July 31, 2012 and 2011:
2012 | 2011 | ||||||||||||
Income Statement Data | Amount | % | Amount | % | |||||||||
Revenue | $ | 125,206,661 | 100.0 | % | $ | 110,669,020 | 100.0 | % | |||||
Cost of Goods Sold | 120,806,601 | 96.5 | % | 101,362,371 | 91.6 | % | |||||||
Gross Profit | 4,400,060 | 3.5 | % | 9,306,649 | 8.4 | % | |||||||
Operating Expenses | 1,906,097 | 1.5 | % | 1,534,827 | 1.4 | % | |||||||
Operating Income | 2,493,963 | 2.0 | % | 7,771,822 | 7.0 | % | |||||||
Other Income | 99,154 | 0.1 | % | 96,766 | 0.1 | % | |||||||
Net Income | $ | 2,593,117 | 2.1 | % | 7,868,588 | 7.1 | % | ||||||
18
Revenues
The following table shows the sources of our revenue for the nine months ended July 31, 2012:
Revenue Sources | Amount | Percentage of Total Revenues | ||||
Ethanol sales | $ | 100,447,367 | 80.2 | % | ||
Distillers grains sales | 21,616,740 | 17.3 | % | |||
Corn oil sales | 3,142,554 | 2.5 | % | |||
Total Revenues | $ | 125,206,661 | 100.0 | % | ||
The following table shows the sources of our revenue for the nine months ended July 31, 2011:
Revenue Sources | Amount | Percentage of Total Revenues | ||||
Ethanol sales | $ | 92,052,005 | 83.2 | % | ||
Distillers grains sales | 15,851,797 | 14.3 | % | |||
Corn oil sales | 2,769,843 | 2.5 | % | |||
Ethanol derivative activity losses | (4,626 | ) | — | % | ||
Total Revenues | $ | 110,669,020 | 100.0 | |||
Our total revenues were higher for the nine month period ended July 31, 2012 compared to the same period of 2011. This increase in revenue is a result of a significant increase in our quantity of ethanol sold during the first nine months of our 2012 fiscal year compared to the same period of 2011. We sold approximately 18.7% more gallons of ethanol during the nine month period ended July 31, 2012 compared to the same period of 2011. However, the price we received for our ethanol was approximately 8.1% lower for the nine month period ended July 31, 2012 compared to the same period of 2011. Our increase in our quantity of ethanol sold is largely due to the de-bottlenecking improvements made to our facility in the last year.
The average price we received for our distillers grains was approximately 15.2% higher for the first nine months of our 2012 fiscal year compared to the same period of 2011. We also sold approximately 18.4% more tons of distillers grains during the first nine months of our 2012 fiscal year compared to the same period of 2011 due to our increased ethanol production.
We sold approximately 21.9% more pounds of corn oil during the first nine months of our 2012 fiscal year compared to the same period of 2011. However, offsetting our increase in corn oil sales, our average price per pound of corn oil decreased by approximately 6.9% for the first nine months of our 2012 fiscal year compared to the same period of 2011.
Cost of Goods Sold
Our costs of goods sold were significantly higher for the first nine months of our 2012 fiscal year compared to the same period of our 2011 fiscal year. Additionally, our costs of good sold as a percentage of our revenues were higher for the first nine months of our 2012 fiscal year compared to the same period of our 2011 fiscal year. Our average cost per bushel of corn was approximately 4.8% higher during the first nine months of our 2012 fiscal year compared to the same period of 2011. Additionally, we ground approximately 15.9% more corn during the first nine months of our 2012 fiscal year compared to the same period of 2011 due to our increased production.
Our natural gas costs decreased during the first nine months of our 2012 fiscal year compared to the same period of 2011. Our total cost of natural gas was approximately 15.4% lower during the first nine months of our 2012 fiscal year compared to the same period of 2011. Our natural gas consumption during the first nine months of our 2012 fiscal year was approximately 10.5 % higher compared to the first nine months of our 2011 fiscal year. Management attributes this increase in our natural gas consumption to increases in our ethanol production and quantity of distillers grains sold.
We experienced an approximate $1,251,000 combined realized and unrealized loss for the nine month period ended July 31, 2012 related to our corn derivative instruments, which increased our cost of goods sold. By comparison, we experienced
19
an approximately $1,147,000 combined realized and unrealized gain for the nine months ended July 31, 2011 related to our corn and natural gas derivative instruments, which decreased our cost of goods sold. We recognize the gains or losses that result from the changes in the value of our derivative instruments from corn, natural gas, and denaturant in cost of goods sold as the changes occur. As corn and natural gas prices fluctuate, the value of our derivative instruments are impacted, which affects our financial performance.
Operating Expenses
Our operating expenses as a percentage of revenues were relatively steady for the nine month period ended July 31, 2012 when compared to the same period ended July 31, 2011. The increase in our operating expenses for the nine months ended July 31, 2012 as compared to the same period for our 2011 fiscal year is due primarily to an increase in various administrative expenses. We continue to focus on increasing our operating efficiency and we strive to lower our operating expenses.
Other Income and Expense
We had other income for the nine months ended July 31, 2012 of $99,154 compared to $96,766 for the nine months ended July 31, 2011. Our other income, net increased primarily as a result of income related to land rent and other miscellaneous income.
Our interest income was lower for the nine month period ended July 31, 2012 compared to the same period of 2011 as a result of having less cash on hand during the 2012 period. Our interest expense was greater for the first nine months of our 2012 fiscal year compared to the same period of 2011 due to the note we took to purchase a Shuttlewagon Railcar Mover in December 2011.
Changes in Financial Condition for the Nine Months Ended July 31, 2012
The following table highlights the changes in our financial condition for the nine months ended July 31, 2012 from our previous fiscal year ended October 31, 2011:
July 31, 2012 | October 31, 2011 | |||||
Current Assets | $ | 17,147,464 | $ | 27,542,361 | ||
Current Liabilities | $ | 3,491,112 | $ | 13,680,184 | ||
Long-Term Debt | $ | 412,013 | $ | — | ||
Members' Equity | $ | 52,287,835 | $ | 49,761,138 | ||
Total assets were approximately $56,191,000 at July 31, 2012 compared to approximately $63,441,000 at October 31, 2011. This decrease in total assets is primarily a result of the approximately $9,200,000 cash distribution paid to membership during our nine month period ended July 31, 2012. Also included in our total assets this period is an increase of approximately $5,740,000 in land, process equipment, and construction in progress. During fiscal 2012, we purchased approximately $3,500,000 of land that will be used as part of a rail infrastructure improvement project. Our construction in progress is primarily related to rail infrastructure improvement and the de-bottlenecking process we are implementing at our plant as we move toward an increased annual run rate. The additions in property, plant and equipment were offset with additional depreciation of approximately $3,192,000.
Current assets totaled approximately $17,147,000 at July 31, 2012, which is less than our current assets as of October 31, 2011, which totaled approximately $27,542,000. The decrease is primarily due to the land acquisitions, property, plant, and equipment purchases, and payments of distributions discussed in the previous paragraph.
Total current liabilities decreased and totaled approximately $3,491,000 at July 31, 2012 and approximately $13,680,000 at October 31, 2011. This decrease was mainly due to the payment of the accrued distribution during the first quarter of fiscal 2012. Long term debt increased from zero at October 31, 2011 to approximately $412,000 at July 31, 2012 as we financed the purchase of a Shuttlewagon Railcar Mover in December 2011.
Plant Operations
We are currently producing fuel-grade ethanol, distillers grains and crude corn oil for sale. Our plant has an approximate annual production capacity of 60 million gallons of denatured ethanol. We have obtained an amendment to our environmental
20
permits allowing us to produce up to 70 million gallons of undenatured ethanol on a twelve month rolling sum basis. We intend to continue working to increase production to take advantage of the underutilized capacity of our plant. Any plant bottlenecks are assessed and a cost benefit analysis is performed prior to further capital investment.
We have completed several de-bottlenecking projects and we are in the process of completing our remaining projects. Each of these projects help our facility to be more efficient, productive and improve the environmental aspects of our process. For the nine month period ended July 31, 2012 we have incurred approximately $985,000 in costs associated with our equipment construction projects. Since starting our de-bottlenecking projects we have incurred approximately $4,985,000 associated with the cost of these equipment improvements.
We expect to have sufficient cash generated by continuing operations, current lines of credit and cash reserves to cover our usual operating costs, which consist primarily of our corn supply, our natural gas supply, de-bottlenecking projects, staffing expense, office expense, audit and legal compliance, working capital costs and debt service obligations.
Trends and Uncertainties Impacting the Ethanol and Distillers Grains Industries and Our Future Revenues
Our revenues primarily consist of sales of the ethanol and distillers grains we produce; however, we also realize revenue from the sale of corn oil we separate from our distillers syrup. The ethanol industry needs to continue to expand the market for ethanol and distillers grains in order to maintain current price levels.
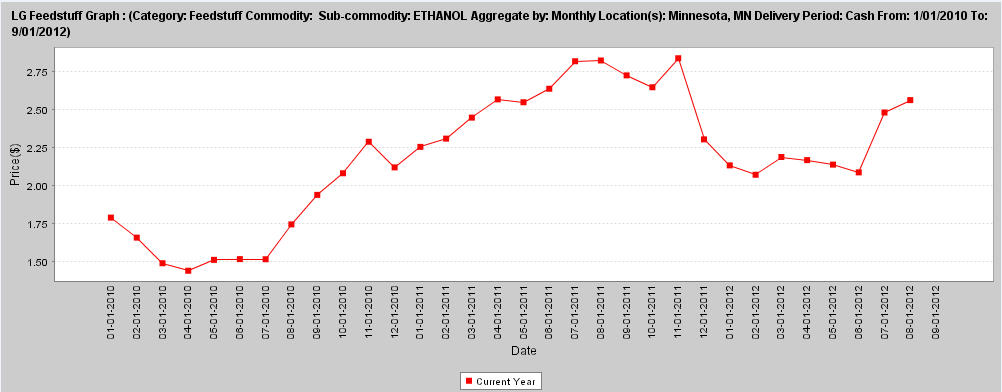
The following chart shows the average cash price per gallon of ethanol in Minnesota from January 2010 through September 1, 2012, as compiled by the USDA Agricultural Marketing Service.
According to the Renewable Fuels Association (“RFA”), as of September 4, 2012, there were 211 ethanol plants nationwide with the capacity to produce approximately 14.7 billion gallons of ethanol annually. The RFA estimates that plants with an annual production capacity of approximately 13.7 billion gallons are currently operating and that approximately 6.8% of the nameplate production capacity is not currently operational. Management believes the production capacity of the ethanol industry is greater than ethanol demand which may continue to depress ethanol prices.
Currently, ethanol is primarily blended with conventional gasoline for use in standard (non-flex fuel) vehicles to create a blend which is 10% ethanol and 90% conventional gasoline. Estimates indicate that approximately 135 billion gallons of gasoline are sold in the United States each year. However, gasoline demand may be shrinking in the United States as a result of the global economic slowdown and improved fuel efficiency. Assuming that all gasoline in the United States is blended at a rate of 10% ethanol and 90% gasoline, the maximum demand for ethanol is 13.5 billion gallons. This is commonly referred to as the “blend wall”, which represents a limit where more ethanol cannot be blended into the national gasoline pool. This is a theoretical limit since it is believed it would not be possible to blend ethanol into every gallon of gasoline that is used in the United States and it discounts higher percentage blends of ethanol such as E15 and E85 used in flex fuel vehicles. As discussed under "Results of Operations for the Three Months Ended July 31, 2012 and 2011 - Revenues," in April 2012, the U.S. Environmental Protection Agency ("EPA") approved the first applications for registering ethanol for use in making E15. As E15 is brought to market and gains market acceptance, management believes that demand for ethanol will increase. However, we do not expect the EPA's
21
acceptance of applications for registering ethanol for use in making E15 to impact ethanol demand or pricing in the near term.
The United States ethanol industry has exported an increasing amount of ethanol. Granite Falls Energy recently began to export a portion of its ethanol production to the European market. The exportation of domestic ethanol has helped to mitigate the effects of the blend wall and has thereby helped to maintain ethanol price levels. We are excited to be participating in the export market, but would prefer that all of our domestically produced fuel could be utilized by the domestic market. Whether the export market continues to make economic sense for Granite Falls Energy will depend on domestic blend rates as well as global supply and demand for our product.
The federal Renewable Fuels Standard, known as RFS2, requires the use of a specified amount of renewable fuels in the United States. In 2012, RFS2 requires approximately 15.2 billion gallons, of which corn based ethanol can be used to satisfy approximately 13.2 billion gallons. However, as discussed above under "Overview," certain parties are seeking a waiver of RFS2, and if their efforts are successful our financial performance may be adversely affected.
Xcel Energy is the owner of a dam on the Minnesota River located downstream from our water intake structure. We have been notified that Xcel Energy intends to remove that dam in the near future. In the event Xcel Energy proceeds with the dam removal, we expect that the water level around our intake structure will be lowered by approximately 15 feet. This change in the pool level would require us to invest capital to upgrade our intake structure to draw water from the Minnesota River. Although we considered acquiring ownership of the dam, we have since determined that it is preferable for us to instead upgrade our water intake structure. We are working on plans for this upgrade and expect to complete the necessary modifications by the end of the first quarter of our 2013 fiscal year. We are unable to estimate the total cost of this upgrade at this time, but expect to use cash flows from operations to fund this project.
Trends and Uncertainties Impacting the Corn and Natural Gas Markets and Our Future Cost of Goods Sold
Our costs of our goods sold consist primarily of costs relating to the corn and natural gas supplies necessary to produce ethanol and distillers grains for sale. We grind approximately 1,800,000 bushels of corn each month. For the quarter ended July 31, 2012, our average cost of corn per bushel, net of hedging activity, was approximately $0.28 lower than our cost of corn for the same period ended July 31, 2011.
Although our cost of corn was lower for the quarter ended July 31, 2012 compared to the quarter ended July 31, 2011, corn prices remain above historical averages. During spring 2012, projected increases in domestic corn production led many to anticipate the possibility of lower corn prices following the 2012 harvest. However, a continuing widespread drought in several corn producing states, combined with continued corn demand from other sectors, has resulted in increasing corn prices. At this point in the growing season it is unlikely that even significant rains will materially improve lower projected yields. As a result, we anticipate that corn prices will remain high through at least the 2013 harvest, as that is the earliest possible time that corn producers may be able to generate significant additional domestic production.
If a period of high corn prices were to be sustained for some time, such pricing may reduce our ability to generate income because of the higher cost of operating our plant.
Natural gas is also an important input commodity to our manufacturing process. Our natural gas usage is approximately 120,000 million British thermal units (mmBTU) per month. We continue to work to find ways to limit our natural gas price risk through efficient usage practices, research of new technologies, and pricing and hedging strategies. We use a marketing firm and an energy consultant for our natural gas procurement and will work with them on an ongoing basis to mitigate our exposure to volatile gas prices.
Management anticipates that natural gas prices will be relatively stable in the next several months as a result of an ample amount of gas in the supply chain. However, should we experience any natural gas supply disruptions, including disruptions from hurricane activity, we may experience significant increases in natural gas prices.
Compliance with Environmental Laws
We are subject to extensive air, water and other environmental regulations and we have been required to obtain a number of environmental permits to construct and operate the plant. As such, any changes that are made to the plant or its operations must be reviewed to determine if amended permits need to be obtained in order to implement these changes.
22
Contracting Activity
Farmers Cooperative Elevator Company supplies our corn. Eco-Energy, LLC markets our ethanol and Renewable Products Marketing Group, LLC (“RPMG”) markets our distillers grains and our corn oil. Each of these contracts is critical to our success and we are very dependent on each of these companies. Accordingly, the financial stability of these partners is critical to the successful operation of our business.
We independently market a small portion of our ethanol production as E-85 to local retailers.
Commodity Price Risk Protection
We seek to minimize the risks from fluctuations in the prices of corn, ethanol, denaturant and natural gas through the use of derivative instruments. In practice, as markets move, we actively manage our risk and adjust hedging strategies as appropriate. We do not use hedge accounting which would match the gain or loss on our hedge positions to the specific commodity contracts being hedged. Instead, we are using fair value accounting for our hedge positions, which means that as the current market price of our hedge positions changes, the gains and losses are immediately recognized in our revenue or cost of goods sold depending on the commodity that is hedged. The immediate recognition of hedging gains and losses under fair value accounting can cause net income to be volatile from quarter to quarter due to the timing of the change in value of the derivative instruments relative to the cost and use of the commodity being hedged.
As of July 31, 2012, we recorded a net asset for our derivative instruments in the amount of $55,088. As of October 31, 2011, we recorded a net asset for our derivative instruments in the amount of $404,050. There are several variables that could affect the extent to which our derivative instruments are impacted by fluctuations in the price of corn, ethanol, denaturant or natural gas. However, it is likely that commodity cash prices will have the greatest impact on the derivative instruments with delivery dates nearest the current cash price. As we move forward, additional protection may be necessary. As the prices of these hedged commodities move in reaction to market trends and information, our statement of operations will be affected depending on the impact such market movements have on the value of our derivative instruments. Depending on market movements, crop prospects and weather, these price protection positions may cause immediate adverse effects, but are expected to produce long-term positive growth for Granite Falls Energy.
At July 31, 2012, we had approximately 3,700,000 bushels of fixed basis contracts for forward corn purchase commitments.
As of July 31, 2012, we had price protection in place for approximately 14% of our natural gas needs through July 31, 2013. As we move forward, we may determine that additional price protection for natural gas purchases is necessary to reduce our susceptibility to price increases. However, we may not be able to secure natural gas for prices less than current market price and we may not recover high costs of production resulting from the possible increase in natural gas prices, which may raise our costs of production and reduce our net income.
The derivative accounts are reported at fair value. We have categorized the cash flows related to the hedging activities with cash provided by operations, in the same category as the item being hedged.
Critical Accounting Estimates
Management uses estimates and assumptions in preparing our financial statements in accordance with generally accepted accounting principles. These estimates and assumptions affect the reported amounts of assets and liabilities, the disclosure of contingent assets and liabilities, and reported revenues and expenses.
Liquidity and Capital Resources
The following table shows our cash flows for the nine months ended July 31, 2012 and 2011:
2012 | 2011 | ||||||
Net cash provided by operating activities | $ | 5,579,821 | $ | 10,367,765 | |||
Net cash provided by (used in) investing activities | (5,737,521 | ) | 279,306 | ||||
Net cash used in financing activities | (9,270,145 | ) | (9,242,592 | ) | |||
23
Operating Cash Flows. Cash provided by operating activities was approximately $5,580,000 for the nine months ended July 31, 2012, which was a decrease from the approximately $10,368,000 provided by operating activities for the nine months ended July 31, 2011. Currently, our capital needs are being adequately met through cash flows from our operating activities and our currently available credit facilities.
Investing Cash Flows. Cash used in investing activities was approximately $5,738,000 for the nine months ended July 31, 2012, compared to cash provided by investing activities of approximately $279,000 for the nine months ended July 31, 2011. During the nine months ended July 31, 2012 we made payments totaling approximately $5,738,000 for capital expenditures and construction in process, compared to payments of approximately $3,221,000 during the same period in 2011. Additionally, during the nine months ended July 31, 2011, we had positive investing cash flow from the maturity of certain short term investments (certificates of deposit) in the amount of $3,500,000.
Financing Cash Flows. Cash used in financing activities was approximately $9,270,000 for the nine months ended July 31, 2012, compared to $9,243,000 for the nine months ended July 31, 2011, most of which was used to pay a distribution to our members in each period.
Indebtedness
Short-Term Debt Sources
The Company formerly had a Loan Agreement with Minnwest Bank M.V. of Marshall, MN (the “Bank”). Under the Loan Agreement, the Company had a revolving line of credit with a maximum of $6,000,000 available which was secured by a first mortgage on substantially all of our assets. The interest rate on the revolving line of credit was at 0.25 percentage points above the prime rate as reported by the Wall Street Journal, with a minimum rate of 4.0%. The interest rate on the revolving line of credit at July 31, 2012 was 4.0%, the minimum rate under the terms of the agreement. At July 31, 2012 and October 31, 2011, the Company had no outstanding balance on this line of credit. Subsequent to the quarter ended July 31, 2012, the Company terminated this revolving line of credit and entered into two new credit facilities, one short-term and one long-term, with United FCS. CoBank serves as administrative agent for these new credit facilities and will purchase a participation interest in them.
The Company's short-term credit facility with United FCS is a revolving line of credit. This facility allows us to borrow, repay, and reborrow up to $6,000,000 subject to a borrowing base calculation. Final payment of amounts borrowed under this credit facility is due August 1, 2013. Amounts borrowed under the revolving line of credit bear interest at one of three interest rate options selected by us, (i) at a variable weekly rate equal to 2.65% above the rate quoted by the British Bankers Association for the offering of one-month U.S. Dollar deposits, (ii) at a fixed rate to be quoted by CoBank, or (iii) at a fixed rate for up to 12 months equal to LIBOR plus 2.65%. Interest on amounts borrowed is payable monthly in arrears. We expect to utilize this credit facility to finance inventory and receivables as needed. We have not yet made any advances on this line of credit.
The Company also has letters of credit totaling $386,928 as part of a credit requirement of Northern Natural Gas. Subsequent to the quarter ended July 31, 2012, these letters of credit were transferred to United FCS as part of the new credit facilities. These letters of credit reduce the amount available under the revolving line of credit to approximately $5,613,000.
Long-Term Debt Sources
The Company's long-term credit facility with United FCS is a revolving term loan. Under this facility we may borrow, repay, and reborrow up to $8,000,000. However, the amount available for borrowing under this facility reduces by $1,000,000 every six months, beginning September 1, 2013, with final payment due March 1, 2017. Amounts borrowed under the revolving term loan bear interest at one of three interest rate options selected by us, (i) at a variable weekly rate equal to 2.90% above the rate quoted by the British Bankers Association for the offering of one-month U.S. Dollar deposits, (ii) at a fixed rate to be quoted by CoBank, or (iii) at a fixed rate for up to 12 months equal to LIBOR plus 2.90%. Interest on amounts borrowed is payable monthly in arrears. We expect to utilize this credit facility to provide working capital and fund capital expenditures, including our ongoing rail infrastructure improvement project. We have not yet made any advances on this credit facility.
The Company's credit facilities with United FCS require the Company to comply with certain financial covenants, including (i) maintaining working capital of at least $10,000,000, (ii) maintaining local net worth, defined as total assets, minus total liabilities, minus investments by the Company in other entities, of at least $45,000,000, and (iii) achieving a debt service coverage ratio of at least 2.0 to 1.0. Our debt service coverage ratio is calculated as follows: (1) net income, plus depreciation and amortization, minus extraordinary gains (plus extraordinary losses), minus gain on asset sales (plus loss on asset sales); (2) divided by $2,000,000. Our credit facilities with United FCS are secured by substantially all our assets. There are no savings account balance collateral requirements as part of this new credit facility.
24
In December 2011, the Company purchased a Shuttlewagon Railcar Mover for use at its facility. The Company financed all of the purchase price through Capital One Equipment Leasing and Finance. As of July 31, 2012, the loan balance was approximately $526,000, of which $412,013 is classified as long-term debt. The note is on a five year term at a fixed annual interest rate of 3.875%.
Off-Balance Sheet Arrangements.
We currently have no off-balance sheet arrangements.
Item 3. Quantitative and Qualitative Disclosures About Market Risk
We are exposed to the impact of market fluctuations associated with interest rates and commodity prices as discussed below. We have no exposure to foreign currency risk as all of our business is conducted in U.S. Dollars. We use derivative financial instruments as part of an overall strategy to manage market risk. We use cash, futures and option contracts to hedge changes to the commodity prices of corn, ethanol and natural gas. We do not enter into these derivative financial instruments for trading or speculative purposes, nor do we designate these contracts as hedges for accounting purposes pursuant to the requirements of Generally Accepted Accounting Principles ("GAAP").
Interest Rate Risk
We are generally exposed to market risk from changes in interest rates. Exposure to interest rate risk results primarily from our revolving line of credit and letters of credit with Minnwest Bank. As of July 31, 2012, we did not have an outstanding balance on this revolving line of credit. The specifics of these credit facilities are discussed in greater detail in “Item 2 - Management's Discussion and Analysis of Financial Condition and Results of Operations - Short-Term Debt Sources.”
Commodity Price Risk
We seek to minimize the risks from fluctuations in the prices of raw material inputs, such as corn and natural gas, and finished products, such as ethanol and distillers grains, through the use of hedging instruments. In practice, as markets move, we actively manage our risk and adjust hedging strategies as appropriate. Although we believe our hedge positions accomplish an economic hedge against our future purchases and sales, management has chosen not to use hedge accounting, which would match the gain or loss on our hedge positions to the specific commodity purchase being hedged. We are using fair value accounting for our hedge positions, which means as the current market price of our hedge positions changes, the realized or unrealized gains and losses are immediately recognized in our cost of goods sold or as an offset to revenues. The immediate recognition of hedging gains and losses under fair value accounting can cause net income to be volatile from quarter to quarter due to the timing of the change in value of the derivative instruments relative to the cost and use of the commodity being hedged.
As corn prices move in reaction to market trends and information, our income statement will be affected depending on the impact such market movements have on the value of our derivative instruments. Depending on market movements, crop prospects and weather, these price protection positions may cause immediate adverse effects, but are expected to produce long-term positive growth for us.
A sensitivity analysis has been prepared to estimate our exposure to ethanol, corn and natural gas price risk. Market risk related to these factors is estimated as the potential change in income resulting from a hypothetical 10% adverse change in the fair value of our corn and natural gas prices and average ethanol price as of July 31, 2012, net of the forward and future contracts used to hedge our market risk for corn and natural gas usage requirements. The volumes are based on our expected use and sale of these commodities for a one year period from July 31, 2012. The results of this analysis, which may differ from actual results, are as follows:
Estimated Volume Requirements for the next 12 months (net of forward and futures contracts) | Unit of Measure | Hypothetical Adverse Change in Price as of July 31, 2012 | Approximate Adverse Change to Income | |||||
Natural Gas | 1,410,000 | MMBTU | 10 | % | $ | 535,800 | ||
Ethanol | 61,164,000 | Gallons | 10 | % | $ | 15,107,500 | ||
Corn | 21,091,000 | Bushels | 10 | % | $ | 16,240,000 | ||
25
Participation in Captive Reinsurance Company
We participate in a captive reinsurance company (“Captive”). The Captive reinsures losses related to workman's compensation, commercial property and general liability. Premiums are accrued by a charge to income for the period to which the premium relates and is remitted by our insurer to the captive reinsurer. The Captive reinsures losses in excess of a predetermined amount. The Captive insurer has estimated and collected a premium amount in excess of expected losses but less than the aggregate loss limits reinsured by the Captive. We have contributed limited capital surplus to the Captive that is available to fund losses should the actual losses sustained exceed premium funding. So long as the Captive is fully-funded through premiums and capital contributions to the aggregate loss limits reinsured, and the fronting insurers are financially strong, we cannot be assessed over the amount of our current contributions.
Item 4. Controls and Procedures
We maintain disclosure controls and procedures that are designed to ensure that information required to be disclosed in the reports that we file or submit pursuant to the Securities Exchange Act of 1934 (the “Exchange Act”) is recorded, processed, summarized and reported within the time periods specified in the Securities and Exchange Commission's rules and forms, and that such information is accumulated and communicated to our management, including our Chief Executive Officer and Chief Financial Officer, as appropriate, to allow for timely decisions regarding required disclosures.
Our management, including our Chief Executive Officer and General Manager (the principal executive officer), Steve Christensen, along with our Chief Financial Officer (the principal financial officer), Stacie Schuler, have reviewed and evaluated the effectiveness of our disclosure controls and procedures as of July 31, 2012. Based upon this review and evaluation, these officers have concluded that our disclosure controls and procedures are effective to ensure that information required to be disclosed in the reports that we file or submit under the Exchange Act is recorded, processed, summarized and reported within the time periods required by the forms and rules of the Securities and Exchange Commission; and to ensure that the information required to be disclosed by an issuer in the reports that it files or submits under the Exchange Act is accumulated and communicated to our management, including our principal executive and principal financial officers, or persons performing similar functions, as appropriate to allow timely decisions regarding required disclosure.
Changes in Internal Control over Financial Reporting
Our management, including our principal executive officer and principal financial officer, have reviewed and evaluated any changes in our internal control over financial reporting that occurred during the quarter ended July 31, 2012 and there has been no change that has materially affected or is reasonably likely to materially affect our internal control over financial reporting.
26
PART II. OTHER INFORMATION
Item 1. Legal Proceedings
From time to time in the ordinary course of business, Granite Falls Energy, LLC may be named as a defendant in legal proceedings related to various issues, including workers' compensation claims, tort claims, or contractual disputes. We are not currently involved in any material legal proceedings.
Item 1A. Risk Factors
The following risk factors are provided due to material changes from the risk factors previously disclosed in our annual report on Form 10-K. The risk factors set forth below should be read in conjunction with the risk factors section and the Management's Discussion and Analysis section for the fiscal year ended October 31, 2011, included in our annual report on Form 10-K.
An oversupply of ethanol in the United States may reduce our revenues and profitability. The United States ethanol industry presently has a production capacity of approximately 15.2 billion gallons per year of “renewable biofuels” according to the Spring 2012 Fuel Ethanol Plant Map produced by Ethanol Producer Magazine, including some presently idled facilities. However, the current Federal Renewable Fuels Standard, known as RFS2, requires that U.S. ethanol blenders purchase only 13.2 billion gallons of renewable biofuels during 2012. During 2011, the U.S. exported a record 1.2 billion gallons of ethanol, according to the Renewable Fuels Association. However, net exports in 2012 remain uncertain given a jump in imports following the expiration of the import tariff on December 31, 2011 and a weaker Brazilian currency in 2012. Brazil purchased approximately 40% of U.S. ethanol exports in 2011. If the U.S. ethanol supply imbalance continues, then ethanol prices and our profit margins may remain narrow or trend negative, and the value of your investment in us may decrease.
Widespread drought may cause increases in the price of corn and reduce our profitability. During spring 2012, projected increases in domestic corn production led many to anticipate the possibility of lower corn prices following the 2012 harvest. However, a continuing widespread drought in several corn producing states, combined with continued corn demand from other sectors, has resulted in increasing corn prices. At this point in the growing season it is unlikely that even significant rains will materially improve lower projected yields. As a result, we anticipate that corn prices will remain high through at least the 2013 harvest, as that is the earliest possible time that corn producers may be able to generate significant additional domestic production. If we are unable to offset increases in corn prices with increases in the price of our products, we may experience a prolonged period of tight or negative profit margins, which would adversely affect our financial performance.
Waiver of the Renewable Fuels Standard may negatively impact demand for ethanol. The federal Renewable Fuels Standard, known as RFS2, requires the use of a specified amount of renewable fuels in the United States. In 2012, RFS2 requires approximately 15.2 billion gallons, of which corn based ethanol can be used to satisfy approximately 13.2 billion gallons. However, under the provisions of the law implementing RFS2, the Environmental Protection Agency (EPA) has the authority to waive the mandated RFS2 requirements in whole or in part. In August 2012, Governors of the States of Arkansas and North Carolina submitted separate letters to EPA requesting a waiver of required volumes under RFS2. Additionally, other organizations and individuals, including state governors, members of Congress, livestock and dairy groups, and food and beverage producers, have also submitted letters to EPA in support of a waiver of RFS2. EPA is currently seeking public comment on these requests. If the efforts of those seeking to waive RFS2 are successful, demand for ethanol could be negatively impacted, which would adversely affect our financial performance.
Item 2. Unregistered Sales of Equity Securities and Use of Proceeds
None.
Item 3. Defaults Upon Senior Securities
None.
Item 4. Mine Safety Disclosures
None.
27
Item 5. Other Information
None.
Item 6. Exhibits.
(a) | The following exhibits are filed as part of this report. |
Exhibit No. | Exhibit | ||
31.1 | Certification of Chief Executive Officer pursuant to 17 CFR 240.13a-14(a)* | ||
31.2 | Certification of Chief Financial Officer pursuant to 17 CFR 240.13a-14(a)* | ||
32.1 | Certification of Chief Executive Officer pursuant to 18 U.S.C. Section 1350* | ||
32.2 | Certification of Chief Financial Officer pursuant to 18 U.S.C. Section 1350* | ||
101 | The following financial information from Granite Falls Ethanol, LLC's Quarterly Report on Form 10-Q for the quarter ended July 31, 2012, formatted in XBRL (eXtensible Business Reporting Language): (i) Condensed Balance Sheets as of July 31, 2012 and October 31, 2011, (ii) Condensed Statements of Operations for the three and nine months ended July 31, 2012 and 2011, (iii) Statements of Cash Flows for the nine months ended July 31, 2012 and 2011, and (iv) the Notes to Condensed Financial Statements.** | ||
* Filed herewith.
** Furnished herewith.
28
SIGNATURES
Pursuant to the requirements of the Securities Exchange Act of 1934, the registrant has duly caused this report to be signed on its behalf by the undersigned thereunto duly authorized.
GRANITE FALLS ENERGY, LLC | ||
Date: | September 14, 2012 | /s/ Steve Christensen |
Steve Christensen | ||
Chief Executive Officer | ||
Date: | September 14, 2012 | /s/ Stacie Schuler |
Stacie Schuler | ||
Chief Financial Officer | ||
29