Attached files
| file | filename |
|---|---|
| 8-K - FORM 8-K - FIFTH THIRD BANCORP | d409026d8k.htm |
 ©
Fifth Third Bank | All Rights Reserved
Exhibit 99.1
Barclays
Global Financial Services Conference
Kevin T. Kabat
President & Chief Executive Officer
September 11, 2012
Refer to earnings release dated July 19, 2012
and 10-Q dated August 8, 2012 for further information
|
 2
©
Fifth Third Bank | All Rights Reserved
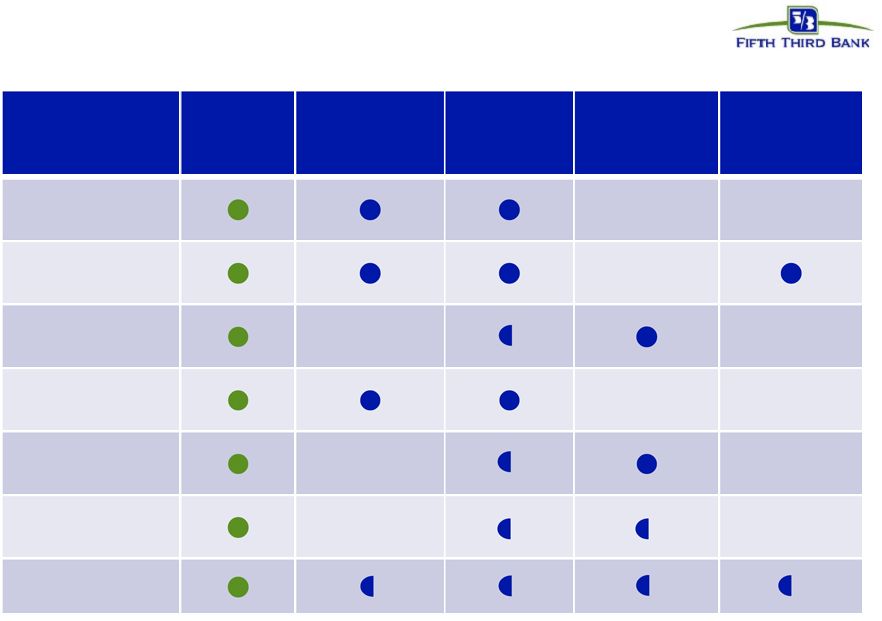
Well-positioned for success and leadership in new banking landscape
Key themes
Traditional
banking focus
consistent with
direction of
financial reform
Strong levels of
profitability
Broad-based
credit
improvements
Exceed fully
phased-in Basel
III capital
standards today
Well-established
franchise in key
markets
Commitment to
our customers
and our
communities
Continued
investments to
maintain and
enhance
revenue-
generation
Disciplined
expense control |
 3
©
Fifth Third Bank | All Rights Reserved
Continued momentum
Strong first half 2012 results underscored by
continued loan growth, solid fee income,
expense control, and ongoing improvement
in credit metrics
Traditional banking model and moderate risk
profile contribute to above average returns
New product offerings consistent with our
mission, our customer value proposition,
and regulatory reform
Return capital from robust internal capital
generation through appropriate dividend
payout and share repurchase plans
We believe current and forecasted fully
phased-in pro-forma capital ratios would
substantially exceed new fully phased-in
well-capitalized minimums
1
2
3
4
5
$130
$175
$270
$88
$328
$373
$305
$421
$376
$0
$50
$100
$150
$200
$250
$300
$350
$400
$450
2Q10
3Q10
4Q10
1Q11
2Q11
3Q11
4Q11
1Q12
2Q12
Earnings Growth
Net income available to common shareholders
($mm) |
 4
©
Fifth Third Bank | All Rights Reserved
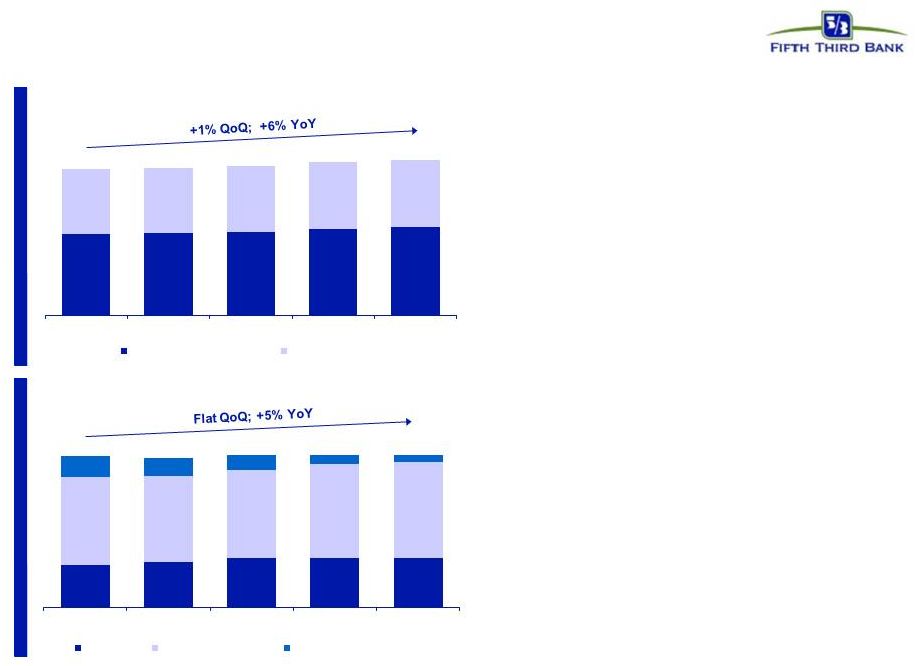
Balance sheet growth mitigates rate environment
•
Core deposit to loan ratio of 99% consistent with
2Q11
–
DDAs up 19% year-over-year
–
Consumer average transaction deposits up 6%
year-over-year
–
Commercial average transaction deposits up
12% year-over-year
Average loan growth ($B)^
Average core deposit growth ($B)
83
78
82
78
^
Excludes loans held-for-sale
Note: Numbers may not sum due to rounding
79
78
81
82
•
Sustained growth driven by C&I and residential
mortgage loans; portfolios in run-off mode of
moderate size
–
Commercial line utilization stable at 32%;
potential source of future growth
•
CRE portfolio run-off at slowing rate, with modest
selective current origination volume
•
Managing auto volumes to ensure appropriate
returns; spread pressure due to competition
•
Branch mortgage refi product has FICO over 780,
LTV ~60% and avg. term ~17 years while yielding
above market rates due to process convenience
80
Demand
IBT/Savings/MMDA
Consumer CD/Core foreign
22
24
26
26
26
46
45
46
49
50
11
9
8
7
6
2Q11
3Q11
4Q11
1Q12
2Q12
44
44
45
46
47
34
35
35
36
36
2Q11
3Q11
4Q11
1Q12
2Q12
Commercial Loans
Consumer Loans
82
•
Short-term wholesale borrowings represent only
7% of total funding |
 5
©
Fifth Third Bank | All Rights Reserved
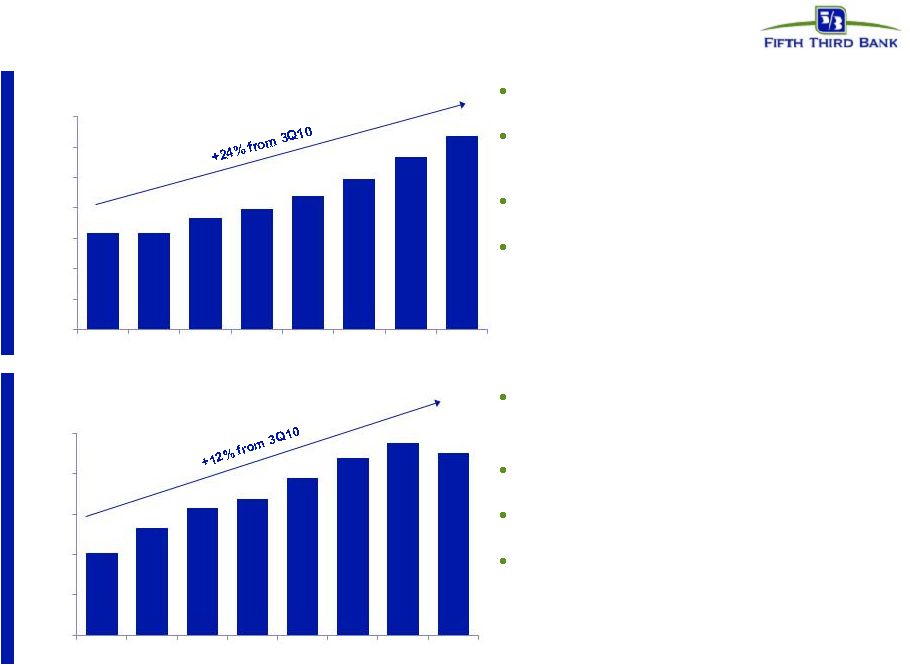
Strength in loan growth
Completed geographic expansion initiatives
–
Now in 44 states representing majority of US
auto sales
Increased competition for high quality prime
auto assets
Careful margin management to optimize
volume/return levels
Continued strong credit performance
–
Net charge-offs of 0.21% in 2Q12
–
High quality origination profile with ~770
YTD average FICO
Continued solid demand in large corporate and
mid-corporate space
Mix shift toward higher-quality loans and
portfolio effects of repricing have resulted in
reduction in portfolio yields
C&I loans as a percent of total commercial loans
was 70% at 2Q12 versus peer average of 62%
C&I production continues to be broad based
across industries and sectors
Source: SNL Financial and Company Reports. Peer average includes: BBT, CMA, HBAN,
KEY, MTB, PNC, RF, STI, USB, WFC, and ZION *ZION & BBT exclude government guaranteed loans; ZION presented as end of
period data. ^Presented on an average basis; Excluding held-for-sale loans.
26.3
26.3
27.3
27.9
28.8
29.9
31.4
32.7
$20.0
$22.0
$24.0
$26.0
$28.0
$30.0
$32.0
$34.0
3Q10
4Q10
1Q11
2Q11
3Q11
4Q11
1Q12
2Q12
C&I Portfolio*^ ($B)
10.5
10.8
11.1
11.2
11.4
11.7
11.9
11.8
$9.5
$10.0
$10.5
$11.0
$11.5
$12.0
3Q10
4Q10
1Q11
2Q11
3Q11
4Q11
1Q12
2Q12
Auto Portfolio^ ($B) |
 6
©
Fifth Third Bank | All Rights Reserved
NII results reflect continued moderate NIM
pressure offset by balance sheet growth
*
^ Estimate; funding (DDAs +
Fixed / Floating Portfolio
•
Near-term NIM pressure created by low rate
environment and modest natural asset sensitivity, but
is expected to be manageable
•
$1.4bn TruPS redemptions in August will benefit 3Q12
NII ~$4MM and benefit NIM ~2 bps vs. 2Q12
•
Coupons on new originations of variable rate assets
consistent with portfolio weighted average coupons
Emphasis on variable rate C&I lending
•
Coupons on new fixed rate originations converging
with portfolio average coupons
•
Current trends provide for stable near-term net interest
income levels
Funding^
NII and NIM (FTE)
Trend: fixed rate loan origination coupons
relative to fixed portfolio weighted avg
Larger portfolio repricing effects
0.00
0.50
1.00
1.50
2.00
3.62%
3.65%
3.67%
3.61%
3.56%
$450
$550
$650
$750
$850
$950
2.0%
2.5%
3.0%
3.5%
4.0%
2Q11
3Q11
4Q11
1Q12
2Q12
Net Interest Income (right axis)
PAA*
NIM
$869
$902
$920
$903
$899
($mm)
Loans
51%
Investment
Portfolio
14%
Fixed
46%
Floating
54%
Investment
Portfolio 3%
Interest-Earning
Assets
Fixed
Floating
Floating
~40-45%
Loans
32%
Fixed
55-60%
Represents purchase accounting adjustments included in net interest income.
interest-bearing liabilities); liabilities attributed to fixed
or floating using terms and expected beta |
 7
©
Fifth Third Bank | All Rights Reserved
Strong revenue and profit generation
Source: SNL Financial and Company Reports. Peer median includes: BBT, CMA, HBAN,
KEY, MTB, PNC, RF, STI, USB, WFC, and ZION *
Excludes
$29MM,
$3MM,
$10MM,
$46MM,
and
$56MM
positive
valuation
adjustment
on
the
Vantiv
warrant
and
put
option
in
2Q11,
3Q11,
4Q11,
1Q12,
and
2Q12,
respectively,
as
well
as
$115MM in gains from Vantiv's IPO and $34MM charge related to Vantiv's debt
refinancing in 1Q12. **
Non-GAAP measure. See Reg. G reconciliation in the Appendix to the
presentation. Revenue / Avg. Int. Earning Assets*
PPNR** / Avg. Int. Earning Assets*
Returns strong relative to peers
•
Business mix provides higher than average
diversity among spread and fee revenues
(40+% of revenue)
•
Relatively strong margin and relatively high
fee income contribution drives strong revenue
and PPNR generation profitability despite
sluggish economy
•
Income from ownership in Vantiv $26mm in
2Q12 (full year 2011 quarterly avg ~$14mm),
despite selling ~10% in 1Q12 |
 8
©
Fifth Third Bank | All Rights Reserved
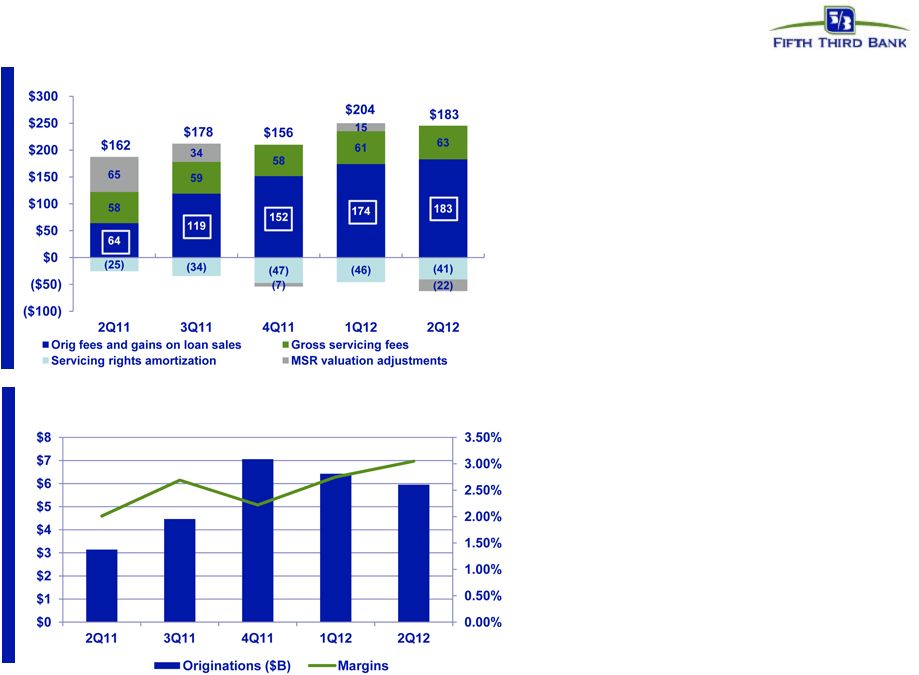
Strong mortgage banking results
•
Record origination fees and gain on
loan sales in 2Q12
•
Highest ranking among all servicers
and peer groups in Fannie Mae’s
2011 STAR
TM
Program for servicing
performance
Looking forward:
•
Continued strong originations /
deliveries in 3Q12
–
Results should remain robust
while rates remain low
•
Gain on sale margins benefitting
from:
–
Strong demand
–
Industry capacity constraints
–
Low prepayment expectations
(particularly on HARP 2.0
originations)
•
HARP 2.0 originations expected to
remain similar percentage of total
originations in 3Q12 vs 2Q12
Mortgage originations and gain-on-sale margins
Mortgage Banking Revenue ($MM) |
 9
©
Fifth Third Bank | All Rights Reserved
Momentum building in corporate banking
Corporate banking revenue ($mm)
•
Dedicated national
healthcare team also
focused in core Midwest &
Southeast markets
•
$2.8B in outstandings; up
40% from June 2011
•
Specialized products
including RevLink
Solutions platform; 30%
increase in accounts from a
year ago
$95
$87
$82
$97
Mid-corporate opportunity
•
Target clients: businesses
that generate $200mm to
$2B in revenue
•
Hired 20+ bankers in the
past 9 months
–
Have generated over $3B
in committed credit and
more than $1.5B in
funded loans
•
Integrated receivables solutions
simplify cash handling and improve
cash flow
–
Remote Currency Manager, our
remote cash capture smart safe
solution
–
Electronic Deposit Manager, our
remote deposit capture solution
•
Commercial card solutions
streamline processes, reduce costs
and maximize convenience
Healthcare vertical
Innovative solutions
$102
31
32
30
29
33
12
9
9
11
14
7
7
6
6
8
28
28
29
31
30
16
11
7
19
17
$0
$20
$40
$60
$80
$100
$120
2Q11
3Q11
4Q11
1Q12
2Q12
Letter of Credit / FX
Institutional Sales
Interest Rate Derivatives
Business Lending Fees
Other Corporate Banking |
 10
©
Fifth Third Bank | All Rights Reserved
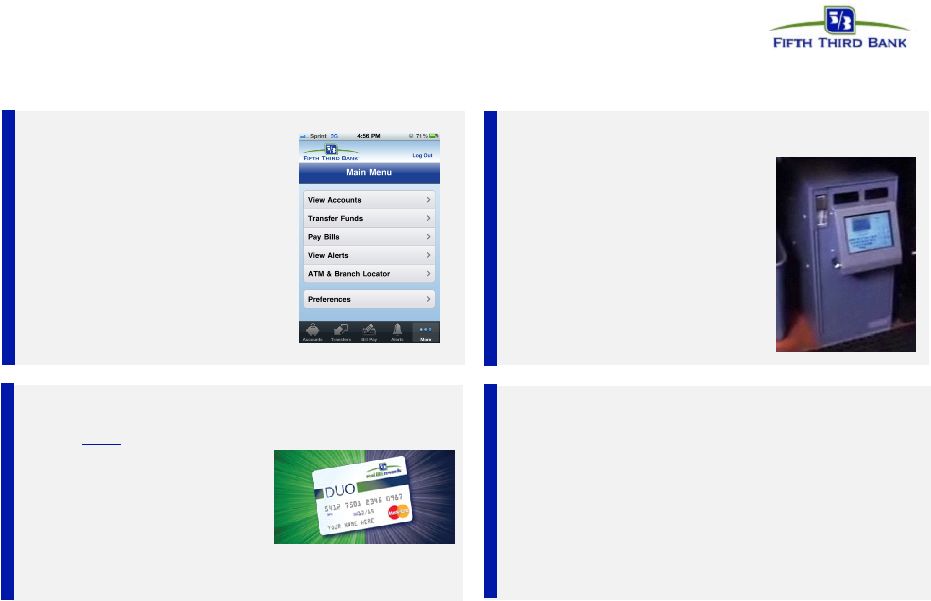
•
View balances,
transfer money, pay
bills, view alerts,
and more
•
App available on
iPhone, Android,
and BlackBerry
•
The only
combined credit
and a debit card
•
Convenience, security,
and financial flexibility
•
New sales consistently
increasing; ~30% of new
consumer card accounts
•
Pay down mortgage faster, just for doing
everyday banking
•
Credit card earns rewards points and
automatically pays down mortgage
principal
•
Pay off mortgage up to a year early
•
Innovative, end-to-end
remote cash
management solution
•
Maximize cash flow while
boosting control over
cash handling
•
Nearly 6,400 RCM
locations; has doubled
since 2009
Mobile Experience
Homeowner Plus Value Package
DUO Card
Remote Currency Manager
Providing customers with products and services they find valuable
New products developed by listening to the voice of the customer
and a
deliberate approach to mitigate regulatory and legislative impacts
Customer oriented solutions |
 11
©
Fifth Third Bank | All Rights Reserved
Simplifying deposit structure:
Aligning value to our customers with value to Fifth Third
Value to our customers
Value to Fifth Third
1
2
3
1
2
3
Accounts straightforward and easy to
use
Simplified service charges with
elimination of certain fees
Greater benefits, including competitive
rates and identity theft protection, for
total relationship value
Simplifies relationship building
for our sales force by reducing
complexity across checking and
savings products
Payment and deposit fee results
and balances expected to
contribute to revenue growth
Changes are compatible with
Fifth Third’s strategic direction
and new regulatory landscape
We are committed to providing valuable products
and services at a fair price
–
Broader and deeper banking
relationships with Fifth Third earn
better rates and lower costs
–
Elimination of daily overdraft fees
on continuing customer overdraft
positions
–
25 checking products simplified to
5 segment-focused products
–
17 savings products simplified to 3 |
 12
©
Fifth Third Bank | All Rights Reserved
Credit trends continue to improve
with strong reserve coverage levels
Source: SNL Financial and Company Reports. Data as of 2Q12. HFI NPLs exclude loans
held-for-sale and also exclude covered assets for BBT, USB, and ZION
Continued
decline
in
problem
assets
and
corresponding
decline
in
charge-offs
combined
with strong reserves on an absolute and relative basis
NPLs / Loans
Peer average: 1.8%
Loan loss reserves / Loans
Peer average: 2.1%
Net charge-off ratio
Peer average: 0.8%
Reserves / NPLs
Peer average: 129% |
 13
©
Fifth Third Bank | All Rights Reserved
Capital management philosophy
*
Subject to Board of Directors and regulatory approval
Organic growth opportunities
•
Support growth of core banking franchise
•
Continued loan growth despite sluggish
economy
Strategic opportunities
*
•
Prudently evaluate franchise including
increasing density in core markets via
disciplined acquisitions or selective de
novos
•
Expect future acquisition activity although
less likely in near-term
•
Attain top 3 market position in 65% of
markets or more longer term
Return to more normal dividend policy*
•
Strong levels of profitability would support
higher dividend than current level
•
Move towards levels more consistent with
Fed’s near-term payout ratio guidance of
30%
•
Potential increase of quarterly dividend in
3Q12 (to $0.10) not objected by FRB in 2Q12
CCAR; considered by BOD in September
Repurchases / Redemptions
*
•
Common share repurchases to limit and
manage growth of excess capital levels
•
Redeemed $1.4bn in TruPS in 3Q12
Ability to increase shareholder distributions with recent
Federal Reserve non-objection to capital plan
Capital Deployment
Capital Return
Manage capital in light of regulatory
environment, other alternatives,
maintenance of desired / required buffers,
stock price
$600MM of potential repurchases through
1Q13 ($350MM ASR entered into in August) |
 14
©
Fifth Third Bank | All Rights Reserved
Capital position remains strong
*The pro forma Tier I common equity ratio is management’s
estimate based upon its current interpretation of the three draft Federal Register notices proposing enhancements to regulatory
capital requirements published in June 2012. The actual impact to the
Bancorp’s Tier I common equity ratio may change significantly due to further clarification of the agencies proposals or
revisions to the agencies final rules, which remain subject to public
comment. Proposed new U.S. capital standards would have manageable impact, if
adopted Primary Basel III Adjustments*
Proposed
fully
phased in
buffered
minimum
of 7.0%
Basel III Impacts
NPR Capital Impact
~50 bps +/-
NPR RWA Impact
~(125 bps) +/-
Total Tier 1 Change
Tier 1 Common Equity
~(75 bps) +/-
9.77%
~9%*
Basel I
Pro forma Basel III
•
2Q12 Tier 1 common equity ratio of
9.77% under Basel I
•
Capital impact increase primarily
from inclusion of AOCI
•
RWA increase primarily from 1-4
family senior and junior lien
residential mortgages,
commitments under one year
•
Pro forma 2Q12 Tier 1 common
equity ratio of ~9%* under Basel III
•
Does not include the effect of any
mitigating actions Fifth Third may
take
Estimated NPR Impact
Current
Pro forma Tier 1 Common Equity |
 15
©
Fifth Third Bank | All Rights Reserved
Fifth Third’s balance sheet and business model
relatively advantaged under new capital standards
Fifth Third’s capital position already well in excess of any established
standards, likely standards, and most peers Unofficial CCAR supervisory
reference minimum 2Q12 Pro forma Tier 1 common / RWA
U.S. proposed Basel III*
2Q12 Tier 1 common / RWA
Basel I
Source: SNL Financial and company reports (financial data as of 2Q12).
* Note: Fifth Third’s pro forma Tier I common equity ratio is
management’s estimate based upon its current interpretation of the three draft Federal Register notices proposing
enhancements to regulatory capital requirements published in June 2012. The actual
impact to the Bancorp’s Tier I common equity ratio may change significantly due to further
clarification of the agencies proposals or revisions to the agencies final rules,
which remain subject to public comment. Not adjusted for potential mitigation efforts.
2019 Basel III buffered minimum
2019 Basel III minimum
Not disclosed |
 16
©
Fifth Third Bank | All Rights Reserved
FITB
“Trillionaire”
Banks
Regional
Banks
Community
Banks
Investment
Banks
Diverse businesses
Efficiencies
of scale
Local market focus
Multi-channel
delivery
Customer-centric
model
Moderate risk
profile
Strong profitability
and well-capitalized
Fifth Third: A differentiated business model
Competitively well-positioned in new landscape
|
 17
©
Fifth Third Bank | All Rights Reserved
Cautionary statement
This report contains statements that we believe are “forward-looking statements” within
the meaning of Section 27A of the Securities Act of 1933, as amended, and Rule 175 promulgated
thereunder, and Section 21E of the Securities Exchange Act of 1934, as amended, and Rule
3b-6 promulgated thereunder. These statements relate to our financial condition, results of operations, plans,
objectives, future performance or business. They usually can be identified by the use of
forward-looking language such as “will likely result,” “may,” “are
expected to,” “is anticipated,” “estimate,” “forecast,” “projected,” “intends to,” or may include other similar words or
phrases such as “believes,” “plans,” “trend,” “objective,”
“continue,” “remain,” or similar expressions, or future or conditional verbs
such as “will,” “would,” “should,” “could,” “might,”
“can,” or similar verbs. You should not place undue reliance on these statements, as
they are subject to risks and uncertainties, including but not limited to the risk factors set forth in our most recent Annual Report
on Form 10-K. When considering these forward-looking statements, you should keep in mind these
risks and uncertainties, as well as any cautionary statements we may make. Moreover, you should
treat these statements as speaking only as of the date they are made and based only on
information then actually known to us.
There are a number of important factors that could cause future results to differ materially from
historical performance and these forward-looking statements. Factors that might cause such
a difference include, but are not limited to: (1) general economic conditions and weakening in
the economy, specifically the real estate market, either nationally or in the states in which Fifth Third,
one or more acquired entities and/or the combined company do business, are less favorable than
expected; (2) deteriorating credit quality; (3) political developments, wars or other
hostilities may disrupt or increase volatility in securities markets or other economic
conditions; (4) changes in the interest rate environment reduce interest margins; (5) prepayment
speeds, loan origination and sale volumes, charge-offs and loan loss provisions; (6) Fifth
Third’s ability to maintain required capital levels and adequate sources of funding and
liquidity; (7) maintaining capital requirements may limit Fifth Third’s operations and potential growth; (8) changes and
trends in capital markets; (9) problems encountered by larger or similar financial institutions may
adversely affect the banking industry and/or Fifth Third; (10) competitive pressures among
depository institutions increase significantly; (11) effects of critical accounting policies
and judgments; (12) changes in accounting policies or procedures as may be required by the Financial
Accounting Standards Board (FASB) or other regulatory agencies; (13) legislative or regulatory changes
or actions, or significant litigation, adversely affect Fifth Third, one or more acquired
entities and/or the combined company or the businesses in which Fifth Third, one or more
acquired entities and/or the combined company are engaged, including the Dodd-Frank Wall Street Reform and
Consumer Protection Act; (14) ability to maintain favorable ratings from rating agencies; (15)
fluctuation of Fifth Third’s stock price; (16) ability to attract and retain key
personnel; (17) ability to receive dividends from its subsidiaries; (18) potentially dilutive effect of
future acquisitions on current shareholders’ ownership of Fifth Third; (19) effects of accounting
or financial results of one or more acquired entities; (20) difficulties from the separation of
Vantiv, LLC, formerly Fifth Third Processing Solutions from Fifth Third; (21) loss of income
from any sale or potential sale of businesses that could have an adverse effect on Fifth Third’s earnings and future
growth; (22) ability to secure confidential information through the use of computer systems and
telecommunications networks; and (23) the impact of reputational risk created by these
developments on such matters as business generation and retention, funding and
liquidity.
You should refer to our periodic and current reports filed with the Securities and Exchange
Commission, or “SEC,” for further information on other factors, which could cause
actual results to be significantly different from those expressed or implied by these
forward-looking statements. |
 18
©
Fifth Third Bank | All Rights Reserved
Appendix |
 19
©
Fifth Third Bank | All Rights Reserved
Diverse business mix
Branch Banking
Consumer Lending
Commercial Banking
Investment Advisors
•
Professionals committed to
understanding customers’
unique needs, providing
options and identifying the
right solution
•
Top 5 market share within
the non-captive prime auto
lending space
•
Top 13
mortgage
origination share
•
$1.0bn total FY11 revenue
•
Holistic approach to branch
banking combined with
mobile convenience to
improve the banking
experience and be the
trusted financial partner for
our customers
•
1,322 full-service banking
centers
•
2,409 full-service ATMs
•
$2.3bn total FY11 revenue
•
Comprehensive product and
service offering including
commercial lending,
treasury management, and
capital markets
•
Innovative products,
advancements in
technology, and exceptional
customer service
•
$2.0bn total FY11 revenue
•
Provide financial insight, a
wide array of leading-edge
products and services, and
a professional team to
help develop a strategy for
clients’
financial success
•
$486MM total FY11
revenue
•
$25bn assets under
management
•
$291bn assets under care
•
39% indirect interest in Vantiv, LLC, formerly Fifth Third Processing Solutions,
LLC |
 20
©
Fifth Third Bank | All Rights Reserved
Deposit simplification:
Checking product design and offerings
All-new, redesigned Fifth Third accounts
Special Access
Just the Basics
Full Relationship Programs
Premium Relationships
eAccess
Essential
Checking
Established
Checking
Enhanced
Checking
Preferred
Checking
N/A
$11 / month
$15 / month
$20 / month
$25 / month
Online access only
$1,500
monthly avg balance in
checking and savings
$5,000
monthly avg balance in checking,
savings, and investments
$20,000
monthly avg balance in checking,
savings, and investments
$100,000
monthly avg balance in checking,
savings, and investments
For those who
never write checks
and do all their
banking online
For those who
want just the
basics
For those who keep
deposits and loans
with Fifth Third
For those who want
investment services
and strategies
For those who want
comprehensive
financial solutions with
dedicated, personalized
service
Monthly service charge
Balance requirements to avoid monthly service charges
All accounts include:
Debit Card
Savings Account(s) with monthly service charges waived
Internet Banking & Online Bill Payment
Mobile Banking & Text Alerts
Fifth Third ATM Access
Online Statements
The
information
on
this
slide
is
for
informational
purposes
only
and
is
not
intended
to
serve
as
initial
product
disclosures.
Please
visit
www.53.com/checking
for details on the benefits and features of these products including terms and
conditions. |
 21
©
Fifth Third Bank | All Rights Reserved
Deposit simplification:
Savings product design and offerings
Simplified and rewarding Fifth Third accounts
Start saving a little at a time
Keep your savings separate from everyday spending
A bonus when you reach your goal
Tiered interest rates
Easy access to your money
Bonus interest every month when you have checking
Our best rates for larger balances
Check access –
write up to 6 checks per month
An even better rate when you have checking
Easy ways to earn out of monthly service charge:
1. Have checking account with us
2. $500 average savings account balance
3. Free for kids and Military Banking members
The
information
on
this
slide
is
for
informational
purposes
only
and
is
not
intended
to
serve
as
initial
product
disclosures.
Please
visit
www.53.com/checking
for details on the benefits and features of these products including terms and
conditions. Relationship Money
Market
best rates -
$25,000+
Relationship Savings
better rates
Goal Setter Savings
competitive rates |
 22
©
Fifth Third Bank | All Rights Reserved
C&I/Total Loans*^
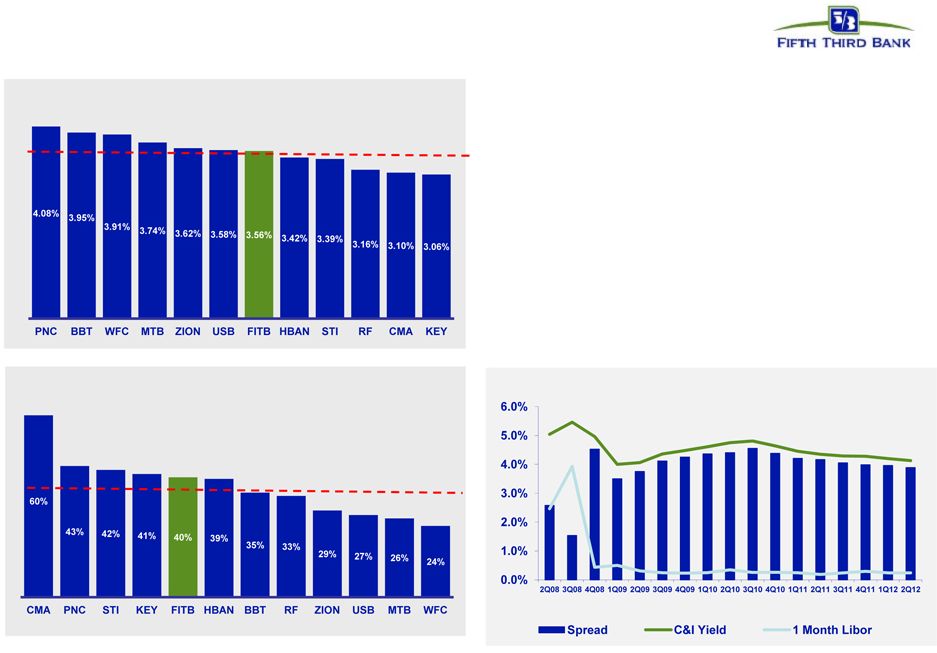
NIM
•
NIM supported by balance sheet and business
mix
–
Heavy emphasis on traditional C&I lending,
much of which is variable
•
Pricing discipline on commercial loans
–
Spreads have narrowed from post-crisis
levels but remain attractive
–
Loan origination rates have stabilized the
past several months
Relatively strong NIM results
due to balance sheet and business mix
Source: SNL Financial and Company Reports. Data as of 2Q12.
*ZION & BBT exclude government guaranteed loans; ZION presented as end of
period data. ^Presented on an average basis; Excluding held-for-sale
loans. C&I Spread to 1-month LIBOR
Peer average: 36%
Peer average: 3.55% |
 23
©
Fifth Third Bank | All Rights Reserved
Core funded balance sheet and pricing discipline
•
Strong, deposit-rich core funding mix supports
relatively low cost of funds
–
High percentage of funding base in low cost
transaction deposits and noninterest-
bearing DDA accounts
–
Low reliance on wholesale funding
SOURCE: SNL Financial and Company Reports. Data as of 2Q12
Transaction deposits defined as DDA, NOW and Savings/MMDA accounts; Cost of Funds
defined as interest incurred on interest-bearing liabilities as a percentage of average noninterest-bearing deposits and interest-
bearing liabilities; Transaction deposits/Total deposits presented on an average
basis; DDA/Total deposits presented on end-of-period basis. Transaction
Deposits / Total Deposits Peer average
83%
Cost of Funds
Peer average
0.57%
DDA/Total Deposits
Peer average
32% |
 24
©
Fifth Third Bank | All Rights Reserved
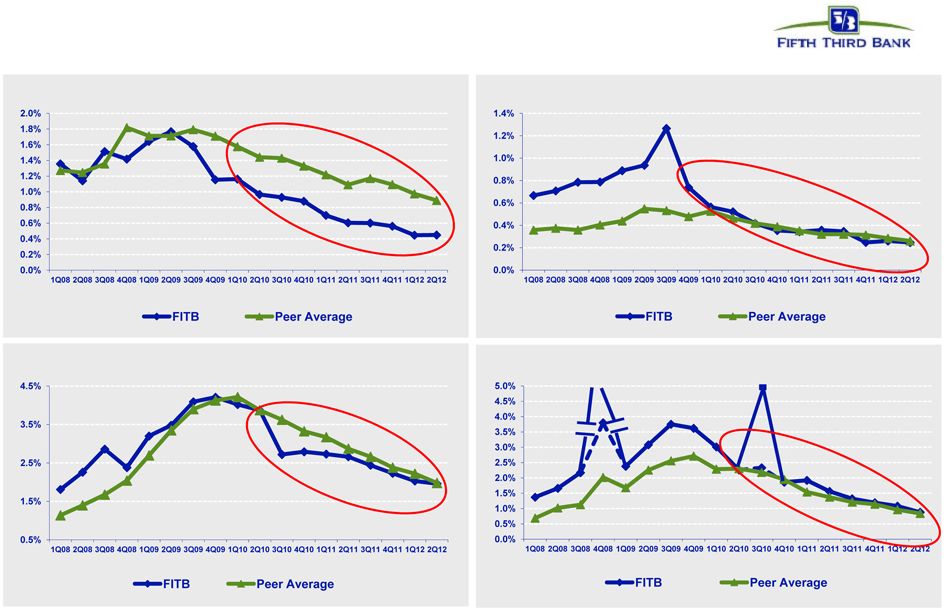
Continued improvement in credit trends
Peer average includes: BBT, CMA, HBAN, KEY, MTB, PNC, RF, STI, USB, WFC, and
ZION Source: SNL Financial and company filings. All ratios exclude loans
held-for-sale and covered assets for peers where appropriate. *
NPA ratio vs. peers
Net charge-off ratio vs. peers
Loans 90+ days delinquent % vs. peers
Loans 30-89 days delinquent % vs. peers
(7.5%)*
(HFS transfer)
3.8%
before credit
actions
5.0%*
2.3%
before credit
actions
FITB credit metrics are in line with or better than peers
4Q08 NCOs included $800mm in NCOs related to commercial loans moved to held-for-sale; 3Q10
NCOs included $510mm in NCOs related to loans sold or moved to held-for-sale |
 25
©
Fifth Third Bank | All Rights Reserved
Mortgage repurchase overview
2Q12 balances of outstanding claims increased 23% from 1Q12
—
Within recent norms of quarterly increases and decreases
Virtually all sold loans and the majority of new claims relate to
agencies
—
99% of outstanding balance of loans sold
—
82% of current quarter outstanding claims
Majority of outstanding balances of the serviced for others
portfolio relates to origination activity in 2009 and later
Private claims and exposure relate to whole loan sales (no
outstanding first mortgage securitizations)
Repurchase Reserves* ($ in millions)
Outstanding Counterparty Claims ($ in millions)
2Q11
3Q11
4Q11
1Q12
2Q12
Beginning balance
$87
$80
$69
$72
$71
Net reserve additions
15
20
20
17
20
Repurchase losses
(23)
(31)
(17)
(17)
(16)
Ending balance
$80
$69
$72
$71
$75
* Includes reps and warranty reserve ($57MM )and reserve for loans sold with
recourse ($19MM) Note: Numbers may not sum due to rounding
% Current
42% 49% 41% 37%
41%
Outstanding Balance of Sold Loans ($ in millions)
Fannie
Freddie
GNMA
Private
Total
2004 and Prior
$825
$3,789
$206
$323
$5,143
2005
295
1,263
55
137
1,750
2006
385
1,038
52
234
1,709
14%
2007
606
1,688
75
203
2,572
2008
792
1,370
595
-
2,575
2009
1,506
7,176
3,404
1
12,087
2010
3,257
7,290
2,847
-
13,395
2011
3,962
7,255
2,361
-
13,578
2012
2,734
4,355
1,555
-
8,644
Grand Total
$14,361
$35,225
$11,150
$899
$61,635
1.5%
2005-2008 vintages account for ~80% of total life to
date losses of $354MM from sold portfolio
—
Preponderance of private sales prior to 2006 |
 26
©
Fifth Third Bank | All Rights Reserved
Regulation G Non-GAAP reconciliation
Fifth Third Bancorp and Subsidiaries
Regulation G Non-GAAP Reconcilation
$ and shares in millions
(unaudited)
June
March
December
September
June
2012
2012
2011
2011
2011
Income before income taxes (U.S. GAAP)
$565
$603
$418
$530
$506
Add:
Provision expense (U.S. GAAP)
71
91
55
87
113
Pre-provision net revenue (a)
636
694
473
617
619
Net income available to common shareholders (U.S. GAAP)
376
421
305
373
328
Add:
Intangible amortization, net of tax
2
3
3
3
4
Tangible net
income available to common shareholders 378
424
308
376
332
Tangible net income available to common
shareholders (annualized) (b) 1,520
1,705
1,222
1,492
1,332
Average Bancorp shareholders' equity (U.S. GAAP)
13,628
13,366
13,147
12,841
12,365
Less:
Average preferred stock
398
398
398
398
398
Average goodwill
2,417
2,417
2,417
2,417
2,417
Average intangible assets
34
38
42
47
52
Average tangible common
equity (c) 10,779
10,513
10,290
9,979
9,498
Total Bancorp shareholders' equity (U.S. GAAP)
13,773
13,560
13,201
13,029
12,572
Less:
Preferred stock
(398)
(398)
(398)
(398)
(398)
Goodwill
(2,417)
(2,417)
(2,417)
(2,417)
(2,417)
Intangible assets
(33)
(36)
(40)
(45)
(49)
Tangible common equity, including
unrealized gains / losses (d) 10,925
10,709
10,346
10,169
9,708
Less: Accumulated other comprehensive income / loss
(454)
(468)
(470)
(542)
(396)
Tangible common equity, excluding unrealized gains /
losses (e) 10,471
10,241
9,876
9,627
9,312
Total assets (U.S. GAAP)
117,543
116,747
116,967
114,905
110,805
Less:
Goodwill
(2,417)
(2,417)
(2,417)
(2,417)
(2,417)
Intangible assets
(33)
(36)
(40)
(45)
(49)
Tangible assets, including
unrealized gains / losses (f) 115,093
114,294
114,510
112,443
108,339
Less: Accumulated other comprehensive income / loss, before tax
(698)
(720)
(723)
(834)
(609)
Tangible assets, excluding unrealized gains / losses
(g) 114,395
113,574
113,787
111,609
107,730
Common shares outstanding (h)
919
920
920
920
920
Net charge-offs (i)
181
220
239
262
304
Ratios:
Return on average tangible common equity (b) / (c)
14.1%
16.2%
11.9%
15.0%
14.0%
Tangible common equity (excluding unrealized gains/losses) (e) / (g)
9.15%
9.02%
8.68%
8.63%
8.64%
Tangible common equity (including unrealized gains/losses) (d) / (f)
9.49%
9.37%
9.04%
9.04%
8.96%
Tangible book value per share (d) / (h)
11.89
11.64
11.25
11.05
10.55
Pre-provision net revenue / net charge-offs (a) / (i)
351%
315%
198%
235%
204%
For the Three Months Ended |
 27
©
Fifth Third Bank | All Rights Reserved
Regulation G Non-GAAP reconciliation
Fifth Third Bancorp and Subsidiaries
Regulation G Non-GAAP Reconcilation
$ and shares in millions
(unaudited)
June
March
December
September
June
2012
2012
2011
2011
2011
Total Bancorp shareholders' equity (U.S. GAAP)
$13,773
$13,560
$13,201
$13,029
$12,572
Goodwill and certain other intangibles
(2,512)
(2,518)
(2,514)
(2,514)
(2,536)
Unrealized gains
(454)
(468)
(470)
(542)
(396)
Qualifying trust preferred securities
2,248
2,248
2,248
2,273
2,312
Other
38
38
38
20
20
Tier I capital
13,093
12,860
12,503
12,266
11,972
Less:
Preferred stock
(398)
(398)
(398)
(398)
(398)
Qualifying trust preferred securities
(2,248)
(2,248)
(2,248)
(2,273)
(2,312)
Qualifying noncontrolling interest in consolidated subsidiaries
(50)
(50)
(50)
(30)
(30)
Tier I common equity (a)
10,397
10,164
9,807
9,565
9,232
Risk-weighted assets, determined in accordance with
prescribed regulatory requirements (b)
106,398
105,412
104,945
102,562
100,320
Ratios:
Tier I common equity (a) / (b)
9.77%
9.64%
9.35%
9.33%
9.20%
For the Three Months Ended |