Attached files
| file | filename |
|---|---|
| 8-K - FORM 8-K - DYCOM INDUSTRIES INC | form8k.htm |
Exhibit 99.1

D.A. Davidson
11th Annual Engineering &
Construction Conference
11th Annual Engineering &
Construction Conference
September 11, 2012

1
Forward-Looking Statements and Non-GAAP
Information
Information
Forward-Looking Statements and Non-GAAP
Information
Information
This presentation contains “forward-looking statements” which are statements relating to future events, future
financial performance, strategies, expectations, and competitive environment. All statements, other than
statements of historical facts, contained in this presentation, including statements regarding our future financial
position, future revenue, prospects, plans and objectives of management, are forward-looking statements.
Words such as “believe,” “expect,” “anticipate,” “estimate,” “intend,” “forecast,” “may,” “should,” “could,” “project,”
“looking ahead” and similar expressions, as well as statements in future tense, identify forward-looking
statements. You should not read forward looking statements as a guarantee of future performance or results.
They will not necessarily be accurate indications of whether or at what time such performance or results will be
achieved. Forward-looking statements are based on information available at the time those statements are
made and/or management’s good faith belief at that time with respect to future events. Such statements are
subject to risks and uncertainties that could cause actual performance or results to differ materially from those
expressed in or suggested by the forward-looking statements. Important factors that could cause such
differences include, but are not limited to factors described under Item 1A, “Risk Factors” of the Company’s
Annual Report on Form 10-K for the year ended July 28, 2012, and other risks outlined in the Company’s
periodic filings with the Securities and Exchange Commission (“SEC”). The forward-looking statements in this
presentation are expressly qualified in their entirety by this cautionary statement. Except as required by law, the
Company may not update forward-looking statements even though its situation may change in the future.
This presentation includes certain “Non-GAAP” financial measures as defined by SEC rules. We believe that the
presentation of certain Non-GAAP financial measures provides information that is useful to investors because it
allows for a more direct comparison of our performance for the period with our performance in the comparable
prior-year periods. As required by the SEC, we have provided a reconciliation of those measures to the most
directly comparable GAAP measures on the Regulation G slides included at the end of this presentation. We
caution that Non-GAAP financial measures should be considered in addition to, but not as a substitute for, our
reported GAAP results.

2
Positioned for strong equity returns
n A leading supplier of specialty contracting services to
telecommunication providers nationwide
telecommunication providers nationwide
n Telecommunications networks fundamental to economic progress
n Firm end market opportunities
Ø Wireless backhaul
Ø Rural fiber networks
Ø Fiber deployments to businesses
Ø Wireless network upgrades
Ø FTTx deployments
n Increased market share as our customers consolidate vendor
relationships and reward scale
relationships and reward scale
n Capital allocation strategy designed to produce strong equity
returns
returns

3
Nationwide Footprint and Significant
Resources
Resources
n Headquartered in Palm Beach Gardens, Florida
n Nationwide footprint
} Operates in 48 states and in Canada
} 31 operating subsidiaries and hundreds of field offices
n Fiscal 2012 fourth quarter revenues of $318.0 million grew organically 9.0% year
over year
over year
n Strong financial profile
} Cash and equivalents $52.6 million at July 28, 2012
} Availability on revolving credit agreement of $186.5 million at July 28, 2012
} 7.125% Senior Subordinated Notes due 2021
n Approximately 8,100 employees
Note: See “Regulation G Disclosure” slides for a reconciliation of GAAP to Non-GAAP financial measures.

4
Services Crucial to Customer Success
Engineering
Underground Facility Locating
Outside Plant & Equipment Installation
Premise Equipment Installation
Wireless Services

5
Intensely Focused on
Telecommunications Market
Telecommunications Market
Contract Revenue $318.0 million
Quarter Ended July 28, 2012

6
Strong Secular Trend
Sources: U.S. Telecom, The Broadband Association
Cisco Visual Networking Index
U.S. National Bureau of Economic Analysis
“When the stability of an entire economy depends on the speed, intelligence, quality
of service, robustness and security of its Internet backbone, will a just good network
be good enough?”
of service, robustness and security of its Internet backbone, will a just good network
be good enough?”
John Chambers, Chairman and CEO, Cisco, Inc.

7
“Our third key strategic initiative is investing in fiber builds to as many towers in our service area as
economically feasible. This initiative supports anticipated long-term growth in data transport, much
of which is driven by wireless data traffic. And expands our addressable customer footprint by
enabling fiber access points to other strategic locations where viable, along these routes. During
second quarter, we completed approximately 1,350 fiber builds. This is in line with expectations. And
we continue to anticipate completing 4,000 to 5,000 builds in 2012, as fiber-to-the-tower construction
continues to ramp up through the remainder of the year.
Glen Post III, CEO & President, CenturyLink, Inc. - August 2012
•Very attractive returns to our customers
•Telephone, cable and other companies aggressively deploying fiber to
provide wireless backhaul services
provide wireless backhaul services
•Continues to provide significant growth opportunities
Sources: FCC OBI Technical Paper 6,
Mobile Broadband: The Benefits of
Additional Spectrum
Mobile Broadband: The Benefits of
Additional Spectrum

8
Key Driver: Rural Fiber Networks
The American Recovery and Reinvestment Act
(ARRA) provided the Department of Commerce’s
National Telecommunications and Information
Administration (NTIA) and the U.S. Department of
Agriculture’s Rural Utilities Service (RUS) with
$7.2 billion to expand broadband services in the
United States.
(ARRA) provided the Department of Commerce’s
National Telecommunications and Information
Administration (NTIA) and the U.S. Department of
Agriculture’s Rural Utilities Service (RUS) with
$7.2 billion to expand broadband services in the
United States.
Cumulatively, total Federal expenditures have now exceeded $1.5 billion
and have been matched by recipient funds of more than $660 million.
and have been matched by recipient funds of more than $660 million.
NTIA BTOP Quarterly Program Status Report - June 2012
•Demand has absorbed significant industry capacity
•Dycom currently working on dozens of projects in multiple states
•Meaningfully increased exposure to rural service providers

9
$3.9 Billion
Addressable Business Services Market
$53.5 Billion
•Emerging as an industry battleground
•Multi-year cap-ex trajectory provides visible revenue opportunities
•Leverages Dycom’s existing cable engineering and construction resources
“…so give or take $700 million a year I think is the number for capital spending for business
services. [….] That $700 million is powering a business that grew 40% the last several years and is
on pace to be a couple billion dollar plus business a year from zero and we can go into the medium-
size and sell backhaul and Metro Ethernet businesses. So first answer is we would love to put more
capital at the business services if we can continue to get 30% IRRs or whatever as we've been
historically getting. It is a 50% margin business, fantastic.”
Brian Roberts, Chairman and CEO, Comcast Corporation - June 2012
Sources: Company Filings
Company Transcripts

10
Key Driver: Wireless Network Upgrades
“…We've had a volume surge that is hard to explain what's transpired. The last five years
we've had literally in the mobile Internet traffic going across our network it's been a 20,000
percent increase in traffic, and we're seeing no signs of that slowing anytime soon. In fact,
we're on a pace this year that it grows another 75 percent, and our current planning
assumption is that that just continues for the next five years after this year.”
Randall Stephenson, CEO, AT&T- July 2012
•Wireless network spending increasing faster than overall spending
•Entered wireless market via NeoCom acquisition in December 2010 and is further
expanding its wireless services to key customers
expanding its wireless services to key customers
•Strong growth opportunities as industry migrates from 3G to 4G technologies
Sources: CTIA
Collins Stewart, LLC

11
Key Driver: FTTx Deployments
“…our Prism TV service represents a very compelling entertainment alternative to
cable TV services in the eight markets where it is currently available. We remain
focused on expanding our Prism TV enabled footprint and in driving additional
subscriber growth in the months ahead.”
cable TV services in the eight markets where it is currently available. We remain
focused on expanding our Prism TV enabled footprint and in driving additional
subscriber growth in the months ahead.”
Glen Post III, CEO & President, CenturyLink, Inc. - May 2012
•A key competitive response by telephone companies to cable MSO’s
•CenturyLink just beginning scale deployments
•Dycom is leveraging prior, extensive FTTx experience with Verizon and AT&T
Sources: Company Filings

12
Subsidiaries
Dycom’s Nationwide Presence
Local Credibility, National Capability

13
Focused on High Value Profitable Growth
n Anticipating emerging technology trends which drive
capital spending
capital spending
n Deliberately targeting high quality, long-term industry
leaders which generate the vast majority of the
industry’s profitable opportunities
leaders which generate the vast majority of the
industry’s profitable opportunities
n Selectively acquiring businesses which complement
our existing footprint and enhance our customer
relationships
our existing footprint and enhance our customer
relationships
n Leveraging our scale and expertise to expand margins
through best practices
through best practices

14
Blue-chip, predominantly investment grade clients comprise the vast majority of revenue
Well Established Customers
Quarter Ended July 28, 2012
Customer Revenue Breakdown
Comcast
AT&T
CenturyLink
Verizon
Windstream
Charter
Ericcson
Other
Frontier
Cablevision

15
Durable Customer Relationships
For comparison purposes, when customers have been combined through acquisition or merger, their revenues have been combined for all periods.

16
n Master Service Agreements (MSA’s)
} Multi-year, multi-million dollar
arrangements covering thousands of
individual work orders
arrangements covering thousands of
individual work orders
n Significant majority of contracts are based on
units of delivery
units of delivery
Revenue By Contract Type
Quarter Ended July 28, 2012
Quarter Ended July 28, 2012
Anchored by Long-Term Agreements
17
Robust Cash Flow - Investing for Growth
$841 million
Cash flow from operations
Cash flow from operations
$238 million
provided by other financing and investing activities and beginning cash on hand
$347 million
Business
acquisitions
Business
acquisitions
$436 million
Capital
expenditures,
net
expenditures,
net
$296 million
Share
repurchases
Share
repurchases
Cumulative Cash Flows Fiscal 2003 - Fiscal 2012
Note: Amounts hereon represent cumulative cash flow amounts for fiscal 2003 - fiscal 2012;
See “Regulation G Disclosure” a summary of amounts.
See “Regulation G Disclosure” a summary of amounts.
$1.079
Billion
Billion
Available
for
Investment
for
Investment

18
Capital Allocated to Maximize
Shareholder Returns
Shareholder Returns
n Organic growth, solid free cash flow and confidence in industry
outlook promotes capital allocation strategy to further expand
shareholder returns
outlook promotes capital allocation strategy to further expand
shareholder returns
n Acquisitions of NeoCom Solutions and Communication Services in
FY 2011 supplement organic growth and contribute to equity returns
FY 2011 supplement organic growth and contribute to equity returns
n Share repurchases of approximately 15% of outstanding shares
during fiscal 2011 and fiscal 2012 creates incremental shareholder
value and reduces equity claims on future earnings
during fiscal 2011 and fiscal 2012 creates incremental shareholder
value and reduces equity claims on future earnings

Financial Update

20
n Organic revenue growth of 9.0% during Q4-2012
n Strong margins and earnings
n Stable balance sheet
n Solid cash flows and liquidity
n Capital structure designed to produce strong equity returns
Financial Overview
21
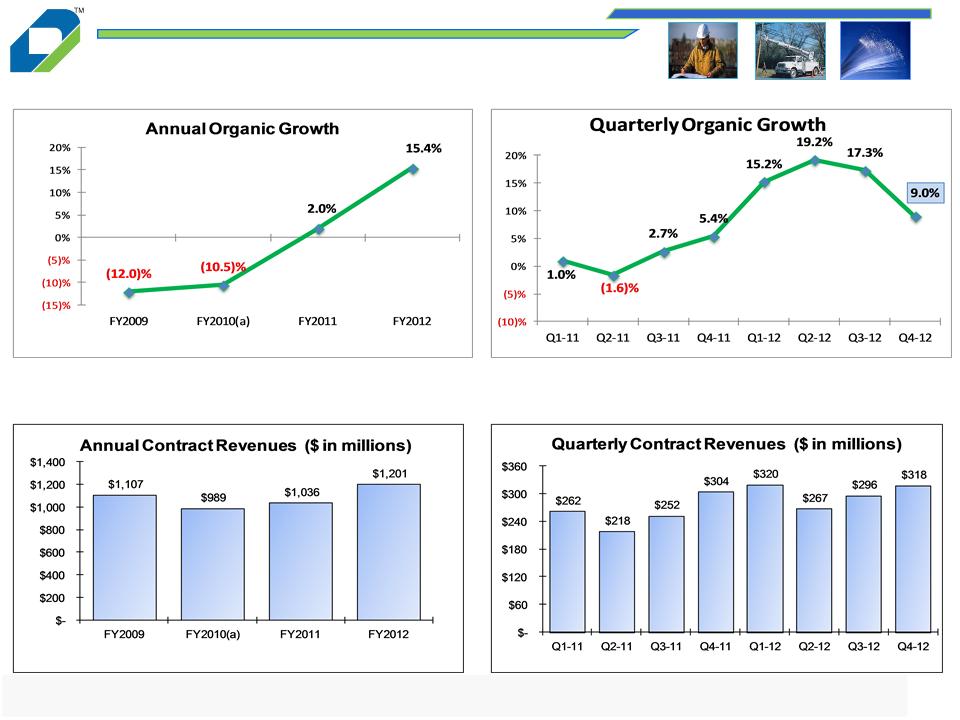
Contract Revenue Growth
Growth within existing contracts and rural
broadband projects driving revenue increases
broadband projects driving revenue increases
Quarterly results exhibit seasonal weather patterns
Organic growth trend since fiscal 2009
Six consecutive quarters of organic growth
Note: See “Regulation G Disclosure” slides for a reconciliation of GAAP to Non-GAAP financial measures.
(a)Fiscal 2010 includes an incremental week as the result of our 52/53 week fiscal year.

22
Margins and Earnings Expansion
Note: See “Regulation G Disclosure” slides for a reconciliation of GAAP to Non-GAAP financial measures.
(a)The amounts and percentages for EBITDA - Adjusted and amounts for Income from continuing operations -Non-
GAAP are Non-GAAP financial measures adjusted to exclude certain items.
GAAP are Non-GAAP financial measures adjusted to exclude certain items.
Adjusted EBITDA expanding in
recent periods as a percentage
of revenue
Earnings growth from higher
revenues and tight cost controls
revenues and tight cost controls

23
Solid Cash Flow
(a) Capital expenditures are presented net of proceeds from the sale of assets.
Solid cash flows support growth
in operations
Targeted capital spending
supports organic growth and
fleet efficiency
supports organic growth and
fleet efficiency

24
Strong Balance Sheet
Financial profile positioned to
address emerging industry
opportunities
address emerging industry
opportunities
n Fiscal 2021 maturity of Senior
Subordinated Notes
Subordinated Notes
n Over $239 million of liquidity from cash
on hand and availability under Senior
Credit agreement
on hand and availability under Senior
Credit agreement
n Repurchased $2.0 million of common
shares during Q4-12
shares during Q4-12
Net debt declines from solid cash
flows in fiscal 2012
flows in fiscal 2012
n Ratio of Net Debt to EBITDA-Adjusted
suitable for growth
suitable for growth
Note: See “Regulation G Disclosure” slides for a reconciliation of GAAP to Non-GAAP financial measures.
(a)The ratio of Net debt to EBITDA-Adjusted is a Non-GAAP financial measure adjusted to exclude certain items.

Supplemental schedules
Regulation G Disclosures

26
Regulation G Disclosure
(a) Year-over-year growth percentage is calculated as follows: (i) revenues in the current twelve month period less (ii) revenues in the comparative prior twelve month period;
divided by (ii) revenues in the comparative prior twelve month period.
divided by (ii) revenues in the comparative prior twelve month period.
(b) Non-GAAP adjustments in FY 2010 reflect adjustments in Q4-10 result from the Company’s 52/53 week fiscal year of $20.1 million. The Q4-10 Non-GAAP adjustments
reflect the impact of the additional week in Q4-10 and are calculated by dividing contract revenues by 14 weeks. The result, representing one week of contract revenues, is
subtracted from the GAAP-contract revenues to calculate 13 weeks of revenue for Q4-10 on a Non-GAAP basis for comparison purposes.
Amounts may not foot due to rounding.

27
(a) Year-over-year growth (decline) percentage is calculated as follows: (i) revenues in the quarterly period less (ii) revenues in the comparative prior year quarter period;
divided by (ii) revenues in the comparative prior year quarter period.
divided by (ii) revenues in the comparative prior year quarter period.
(b) Q4-12 organic growth excludes storm restoration revenues of $2.3 million in Q4-12 and $14.1 million in Q4-11.
(c) For Q3-12, GAAP and Non-GAAP revenue growth percentages are the same as revenues from business acquired in 2011 were included for the full quarter in each period
and there were no other Non-GAAP adjustments in either period. For Q1-11, GAAP and Non-GAAP revenue growth percentages are the same as there were no Non-GAAP
adjustments in either period.
and there were no other Non-GAAP adjustments in either period. For Q1-11, GAAP and Non-GAAP revenue growth percentages are the same as there were no Non-GAAP
adjustments in either period.
(d) Non-GAAP adjustments in Q2-12, Q3-11 and Q2-11 reflect revenues from businesses acquired during Q2-11. Non-GAAP adjustments in Q1-12 reflect storm restoration
revenues ($3.7 million) and revenues from businesses acquired during Q2-11 ($14.5 million). Non-GAAP adjustments in Q4-11 for fiscal 2011 fourth quarter year-over-year
organic growth reflects storm restoration revenues ($14.1 million) and revenues from businesses acquired during Q2-11 ($14.1 million). Non-GAAP adjustments in Q4-10 result
from the Company’s 52/53 week fiscal year. The Q4-10 Non-GAAP adjustments reflect the impact of the additional week in Q4-10 and are calculated by dividing contract
revenues by 14 weeks. The result, representing one week of contract revenues, is subtracted from the GAAP-contract revenues to calculate 13 weeks of revenue for Q4-10 on
a Non-GAAP basis for comparison purposes. Non-GAAP adjustments in Q3-09, Q2-09, and Q1-09 reflect storm restoration revenues recognized during those periods.
Amounts may not foot due to rounding.

28
Regulation G Disclosure
The below table presents the Non-GAAP financial measures of EBITDA and Adjusted EBITDA for the respective periods. EBITDA and Adjusted EBITDA are Non-GAAP financial measures within the meaning of Regulation G
promulgated by the Securities and Exchange Commission. The Company defines EBITDA as earnings before interest, taxes, depreciation and amortization, and defines Adjusted EBITDA as earnings before interest, taxes,
depreciation and amortization, gain on sale of fixed assets, stock-based compensation expense and Adjusting items. The Company believes these Non-GAAP financial measures provide information that is useful to the Company’s
investors. The Company believes that this information is helpful in understanding period-over-period operating results separate and apart from items that may, or could, have a disproportionate positive or negative impact on the
Company’s results of operations in any particular period. Additionally, the Company uses these Non-GAAP financial measures to evaluate its past performance and prospects for future performance. EBITDA and Adjusted EBITDA
are not recognized terms under GAAP and do not purport to be an alternative to net income, operating cash flows, or a measure of earnings. Because all companies do not use identical calculations, this presentation of Non-GAAP
financial measures may not be comparable to other similarly titled measures of other companies. These tables present a reconciliation of EBITDA and Adjusted EBITDA to the most directly comparable GAAP measure.

29
Regulation G Disclosure

D.A. Davidson
11th Annual Engineering &
Construction Conference
11th Annual Engineering &
Construction Conference
September 11, 2012