Attached files
| file | filename |
|---|---|
| 8-K - FORM 8-K - OSH 1 LIQUIDATING Corp | d408182d8k.htm |
| EX-99.1 - PRESS RELEASE - OSH 1 LIQUIDATING Corp | d408182dex991.htm |
 NASDAQ: OSH
September 2012
September 2012
Exhibit 99.2 |
 2
September 2012
This presentation (including information incorporated or deemed incorporated by
reference herein) contains “forward-looking
statements”
within
the
meaning
of
the
Private
Securities
Litigation
Reform
Act
of
1995.
Forward-
looking statements are those involving future events and future results that are
based on current expectations, estimates, forecasts, and projects as well as
the current beliefs and assumptions of our management. Words such as
“outlook”, “believes”, expects”, “appears”, “may”, “will”, “should”, “intend”, “target”, “projects”, “estimates”,
“plans”, “forecast”, “is likely to”,
“anticipates”, or the negative thereof or comparable terminology, are intended to
identify such forward-looking statements. Any statement that is not a
historical fact, including estimates, projections, future trends and the
outcome of events that have not yet occurred, is a forward-looking statement.
Forward-looking statements are only predictions and are subject to risks,
uncertainties and assumptions that are difficult to predict. Therefore
actual results may differ materially and adversely from those expressed in any
forward-looking statements. Factors that might cause or contribute to
such differences include, but are not limited to,
those
discussed
under
the
section
entitled
“Risk
Factors”
in
our
reports
filed
with
the
Securities
and
Exchange
Commission. Many of such factors relate to events and circumstances that are
beyond our control. You should not place undue reliance on
forward-looking statements. Forward-looking statements speak only as of the date
they
are
made.
The
Company
undertakes
no
obligation
to
publicly
update
or
revise
any
forward-looking
statement, whether as a result of new information, future events, or
otherwise. Safe Harbor Statement |
 Business Overview |
 4
September 2012
Strong brand heritage and 80 year history
Neighborhood hardware and garden store focused on paint, repair and
the backyard
Uniquely positioned between big boxes and small independent
hardware stores
Differentiated operating model focuses on high margin categories
High performance management team in place with new vision
Store conversion and opening plans expected to drive growth
About Orchard |
 5
September 2012
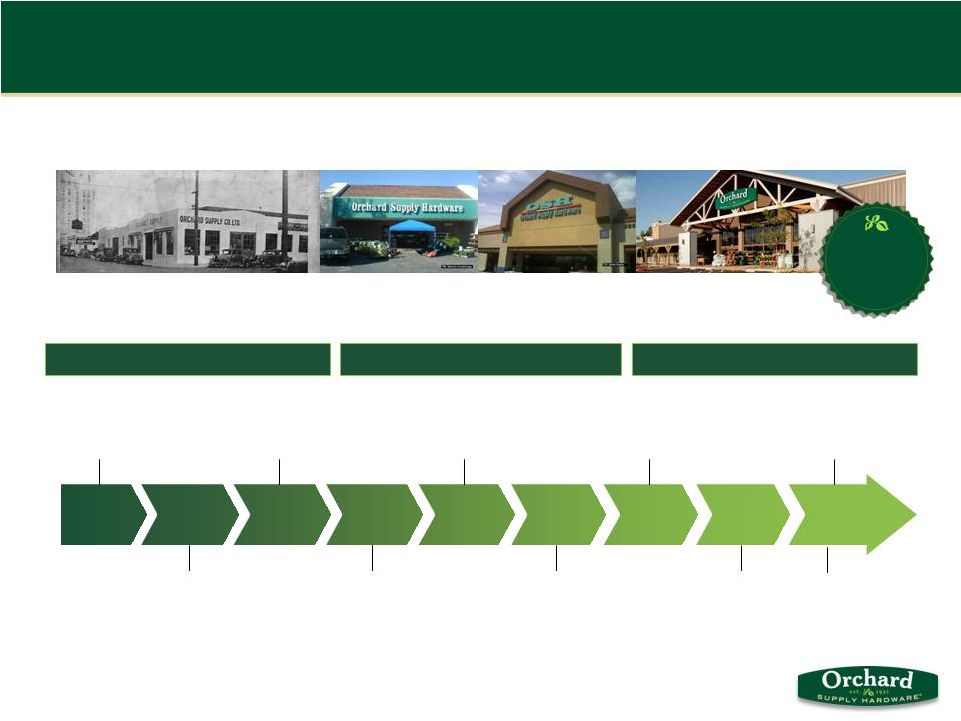
Strong Brand Heritage Over 80 Years
Early Days
Ownership Change
Today
(1931)
(1970’s)
(1990’s)
(2011)
80
YEARS
80
YEARS
Founded as a
Farmer's
Purchasing
Cooperative
W.R. Grace
acquired Orchard
Wickes acquired
Orchard from W.R.
Grace
Freeman Spogli
acquired Orchard
from Wickes
Orchard IPO
Sears acquired
Orchard
Ares acquired 20%
stake
Opened new stores
and launched
e-commerce
New management
team, transition to a
public and standalone
company, new store
design
1931
1979
1986
1989
1993
1996
2005
2009/2010
2011/2012
(34 stores)
(43 stores)
(65 stores)
(85 stores)
(89 stores)
(89 stores)
Spin-off from
Sears |
 6
September 2012
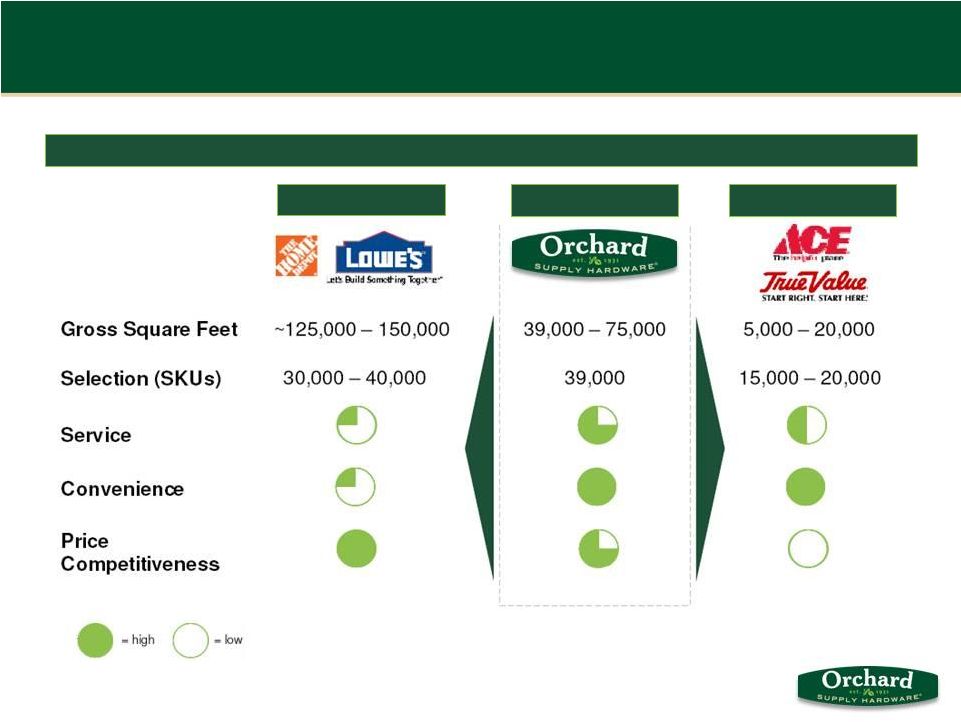
Orchard Owns the Niche Between Small Independents and Big Boxes
Attractive Competitive Positioning
Warehouse
Convenience
Local Hardware |
 7
September 2012
Business Snapshot
Highly attractive niche positioning between big
box home improvement retailers and small
independent hardware stores
Neighborhood hardware and garden store
focused on paint, repair and the backyard
Efficient store footprint focuses on better quality,
higher margin products
Focus on consumers who are highly engaged
and spend on home improvement projects
High quality brands and expert, attentive
service appeal to Orchard’s customer base
Priced at parity to big box retailers on 100
high-visible products
Slight premium in pricing vs. big box retailers
on balance of assortment not as important as
overall shopping experience
New management team focused on leading
Orchard to sustained profitability and growth
Orchard Locations (as of Sept. 1, 2012)
89
locations in California
82
leased; 7
Company-owned
68
in Northern California
21
in Southern California
1
to open in Portland, Oregon
39,000 –
75,000
gross sq. ft.
39,000
SKUs
1
Distribution Center
(458,000 sq ft)
Key Statistics
FY 2011
Sales ($mm)
$660.5
Stores
87
Sales per store ($mm)
$7.6 |
 8
September 2012
Deep
Product
Knowledge
and
Global
Sourcing
Capability
with
Local
Market
Delivery
and
Know
How
Knowledgeable and
experienced associates
Genuine customer
hospitality
Engaging shopping
environment
New floor zone coverage
and 2-way radios
Increased sales training
Extensive selection of
national and regional
brands
Large assortment in
recurring maintenance &
repair items
High in-stock levels
Unique assortments tailored
to customer segments and
geographic location
Prime locations in densely
populated areas
Easy in-and-out
Easy-to-shop format
Efficient checkout and
customer pick-up across all
channels
Service
Selection
Convenience
Powerful and Efficient Operating Model |
 9
September 2012
Focused on Three Core Categories
Backyard
40% of revenue; 36% of margin
contribution
High repeat shopping in garden
category drives traffic
Quick in-and-out
More than 50% of Orchard stores
have direct nursery access from
the parking lot
Repair
40% of revenue; 44% of margin
contribution
Differentiated through service
Rationalized and localized
assortments
Provides solutions
Neighborhood convenience
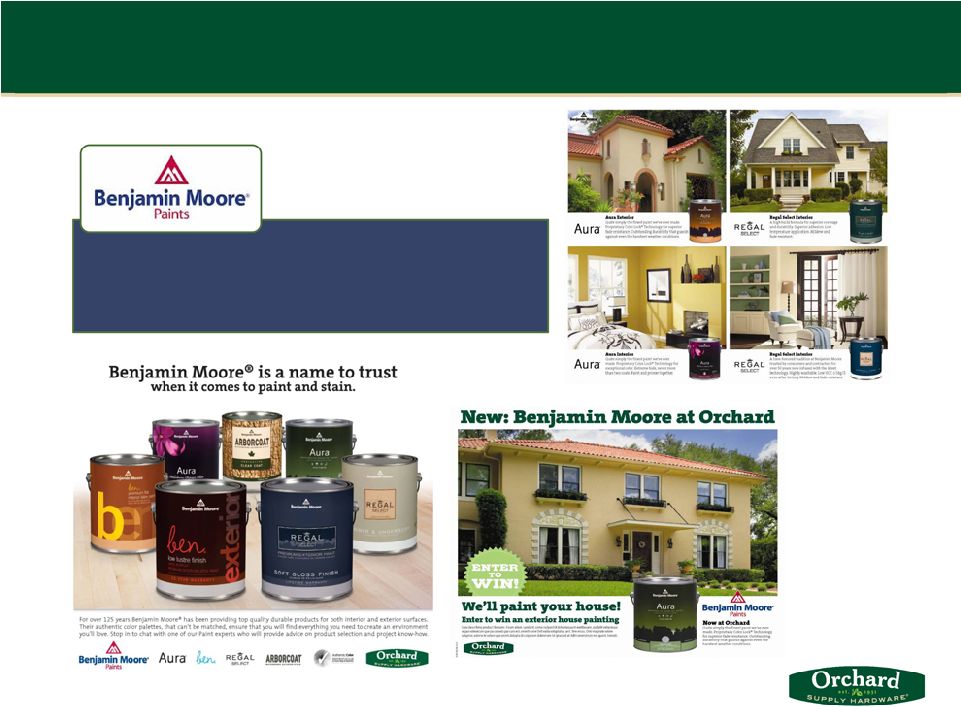
Paint & Home
20% of revenue; 20% of margin
contribution
Key home improvement do-it-
yourself category
Strategic alliance with Benjamin
Moore –
exclusive paint supplier
Orchard stores offer “how-to”
and
project advice |
 10
September 2012
Strategic Alliance with Premier Paint Brand
Benjamin Moore
Exclusive supplier of paint
to all Orchard locations |
 11
September 2012
Differentiated Product Assortment
Breadth
Depth
Value
Offers products across major categories
8,000 sq ft dedicated to an exterior nursery
750
sq
ft
highly
visible
paint
area
–
prominent
placement of high quality Benjamin Moore
paints
39,000 total SKUs
Dominant assortment in key categories
Multiple products and price points within each
product category to appeal to all shoppers
Average ticket: $26
Pricing comparable to big box retailers
Products focused on higher quality at
comparable value prices; not competing to be
low price leader |
 Business Repositioning |
 13
September 2012
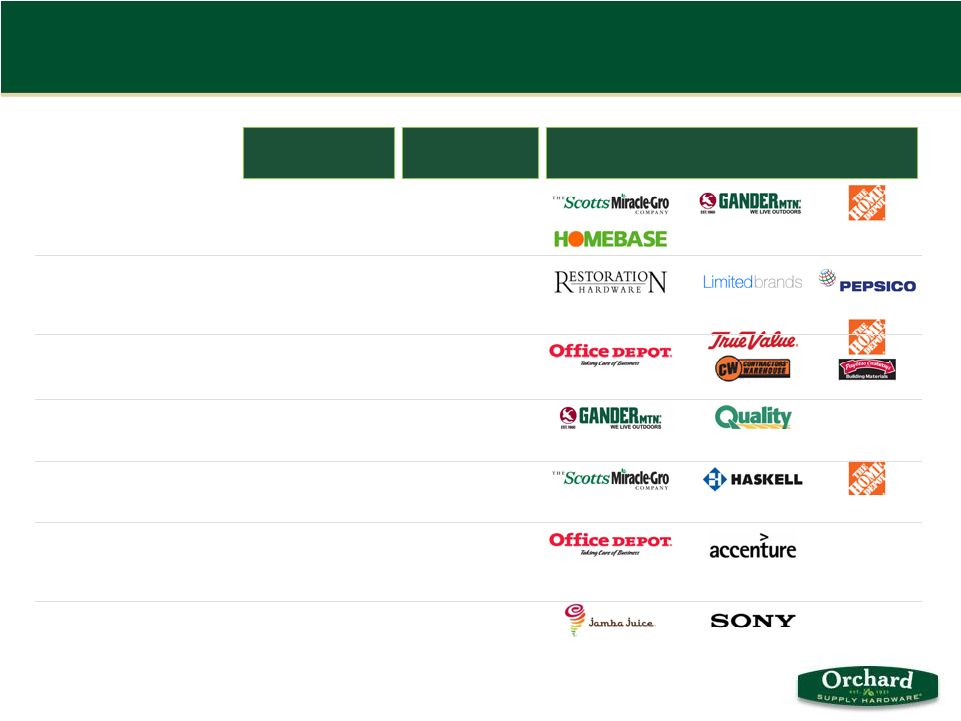
Mark R. Baker
Chief Executive Officer,
President
March 2011
31 years
Chris D. Newman
Executive Vice President,
Chief Financial Officer &
Treasurer
November 2011
13 years
Steven L. Mahurin
Executive Vice President,
Merchandising
May 2011
30 years
Mark A. Bussard
Senior Vice President,
Operations
June 2011
22 years
David I. Bogage
Senior Vice President,
Human Resources
April 2011
17 years
Steve Olsen
Senior Vice President, Supply
Chain, IT and Chief Strategy
Officer
June 2010
15 years
Michael W. Fox
Senior Vice President,
General Counsel & Secretary
October 2011
7 years
Scotty’s Home
Improvement Centers
Knox Hardware
And Lumber
Meridian Point
Properties
# Years Retail
Experience
With Orchard
Since
Prior Retail Experience
New Management Team With Deep Retail and Home
Improvement Experience |
 14
September 2012
Key Accomplishments Under New Management Team
Developed new, highly productive store
format
Enhanced customer service and store
support
Upgraded store and regional
leadership
Implemented new floor zone coverage
and 2-way radios
Improved inventory in-stock levels
Increased average ticket
Heightened morale across the
organization with energized field
personnel |
 15
September 2012
We’re in the Early Stages of Repositioning the
Business
Management is Focused on Five Key Priorities
1)
Project a consistent and compelling brand
identity
2)
Drive sales through merchandising and
marketing initiatives
3)
Improve operational efficiencies
4)
Align resources and talent
5)
Strengthen the Company’s financial position |
 16
September 2012
New Brand (logo, colors, look/feel)
Old Brand
New Brand Identity |
 17
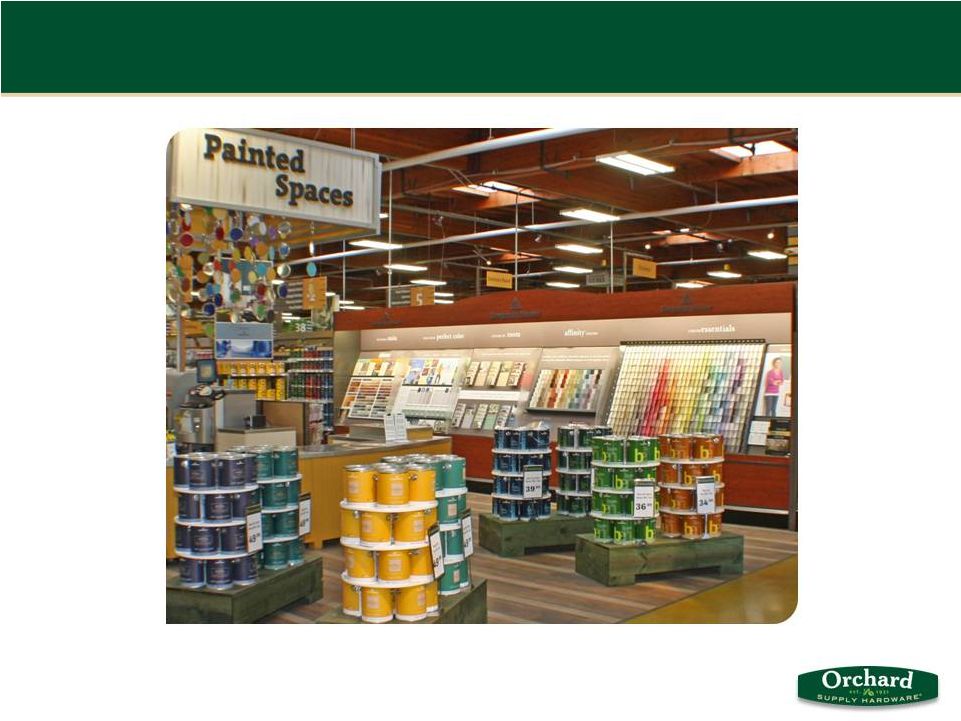
September 2012
New Paint Area |
 18
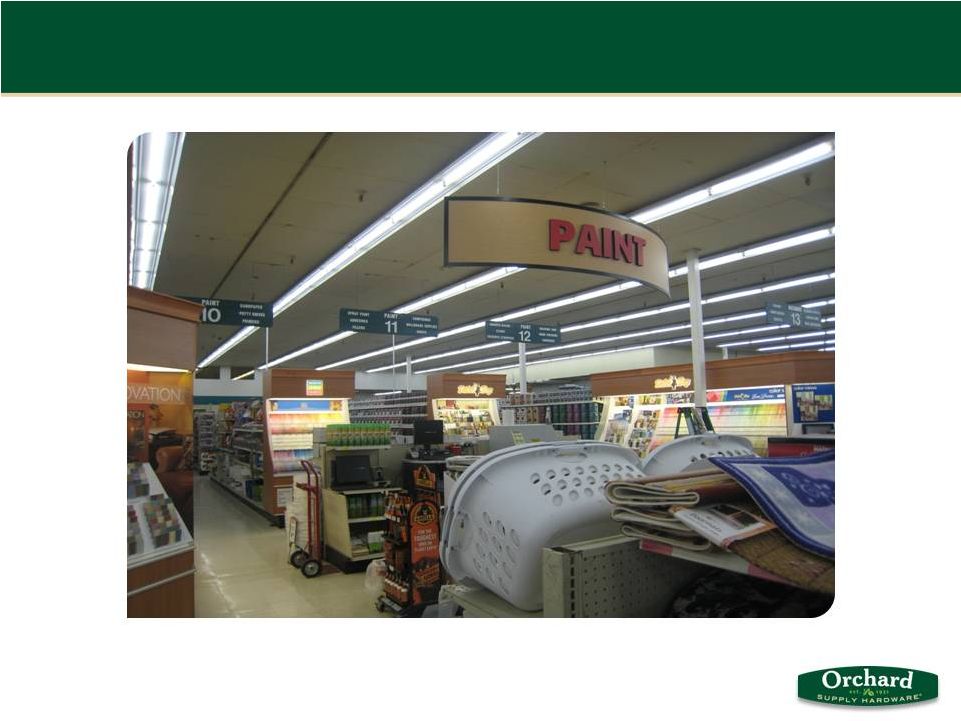
September 2012
Old Paint Area |
 19
September 2012
New Nursery and Garden Center |
 20
September 2012
Old Nursery and Garden Center |
 21
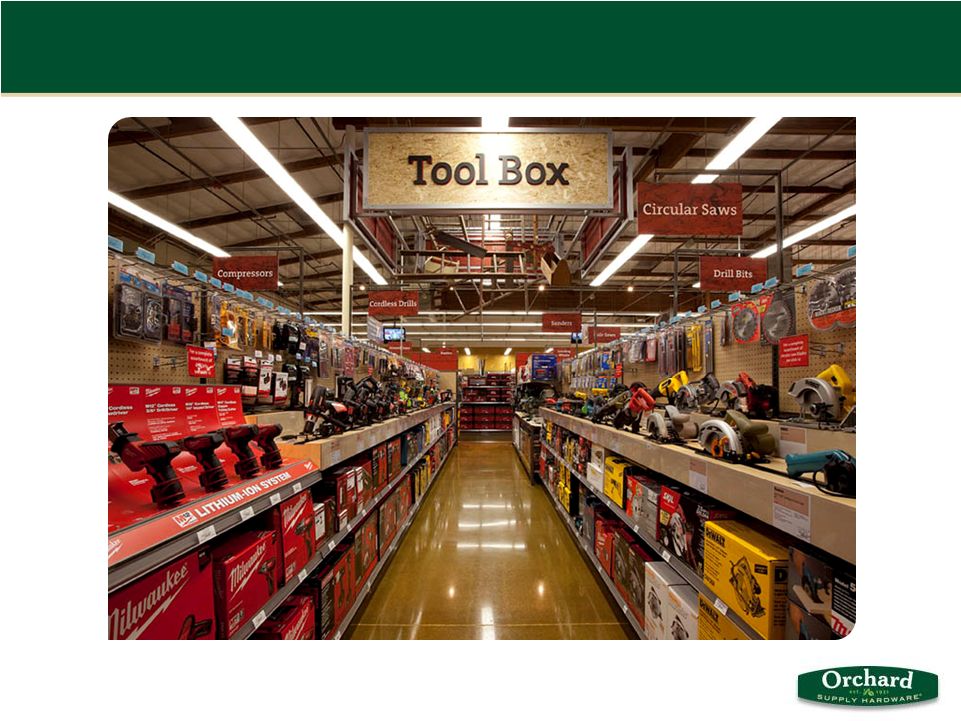
September 2012
New Tools Area |
 22
September 2012
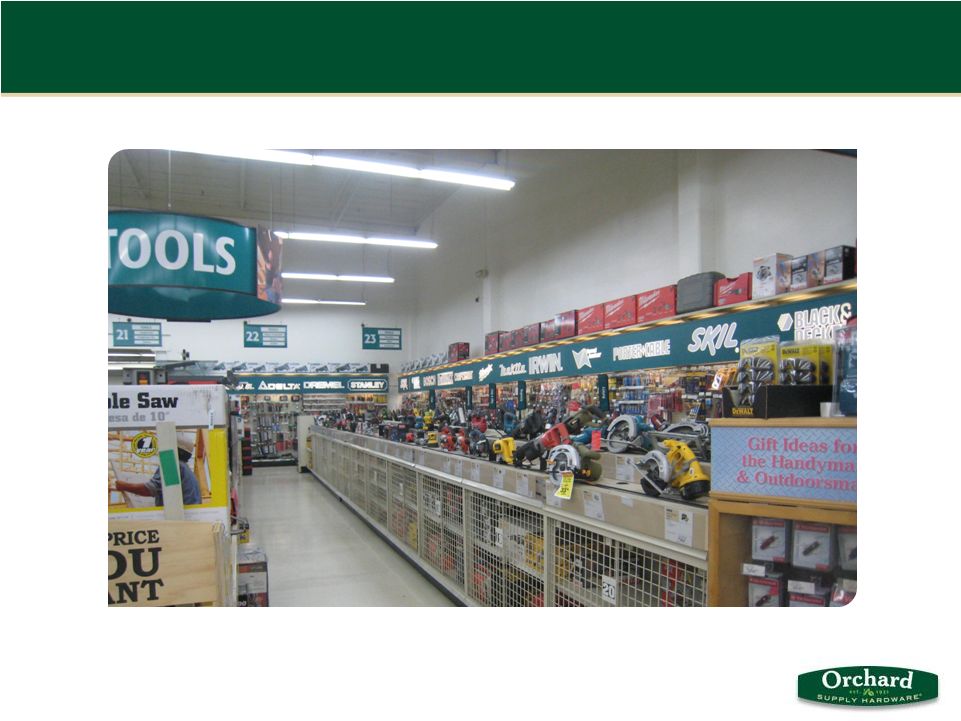
Old Tools Area |
 23
September 2012
New Workbench Area |
 24
September 2012
Reorganized regional leadership team
Moved from 8 districts to 4 regions
Home improvement and specialty retail experience includes Home Depot,
Whole Foods, Office Depot, Safeway, Gander Mountain and Macy’s
Emphasis placed on training
Set higher expectations for store management
New playbook of standards across the store network
Migrating from an operating focus to a sales and service focus among store
teams We are Aligning and Better Managing
Resources and Talent |
 25
September 2012
5 properties in Q3/Q4 2011
•
Generated gross proceeds of $57.8 million
•
Paid down Real Estate Term Loan by $21.6 million
•
Paid down Senior Secured Term Loan by $34.4 million
•
Renegotiated
financing
arrangements
-
enhanced
operating
flexibility
and
extended
term
1 property in Q1 2012, and the sale of a parcel of land
•
Generated gross proceeds of $6.9 million
•
Paid down Real Estate Term Loan by $2.5 million
•
Paid down Senior Secured Term Loan by $1.2 million
6 properties in Q2 2012
•
Generated gross proceeds of $42.8 million
•
Paid off $25.2 million Real Estate Term Loan in its entirety
•
Paid
down
Senior
Secured
Term
Loan
by
$7.6
million
subsequent
to
quarter-end
Reduced total debt, including capital leases, from $338.2 million at year-end
2010 to $226.8 million at July 28, 2012
The Company Strengthened its Financial Position
Deleveraged Through Sale-Leaseback Transactions
|
 26
September 2012
New store design opened in September 2011 at
Princeton Plaza location
Innovative store layout and design
developed by new management team
Race-track layout
Farmer’s market look and feel with
upgraded product assortment
Updated logo, colors and branding
Larger nursery and garden center with direct
parking lot access
Prominent customer service center, the
“Workbench”, concentrates all critical hardware
services into one conveniently located area
Eye-catching and distinct interior upgrades in
easy-to-shop format
Target trade area (3 miles), 100K population,
$30K per capita income, more than 1 mile to big
box competition
New Store Target Model
New Innovative ‘Neighborhood’
Store Format
Description
Store Performance:
Sales
$9.0-$15.0
4-Wall EBITDA Margin
15-25%
Store Investments:
Fixed Asset Investment
$3.2
Less: Landlord Contribution
1.0
Net Investment
$2.2
Inventory, net of Payables
0.9
Total Investment
$3.1
Payback Period:
18 -
36 months
Return on Investment (IRR):
40%+
($ in millions) |
 27
September 2012
Fiscal 2012 Store Opening and Conversion Plans
New Stores
Conversions
Partial Remodels
Three new store openings planned for fiscal 2012
Fig Garden (Fresno) opened in April 2012
Torrance (South Bay) opened in September 2012
Yorba Linda expected to open in second half
Over time, the majority of stores will be converted to the new neighborhood store
format
Six Orchard locations will be remodeled in fiscal 2012
Grand
re-opening
events
scheduled
for
Q3:
Two
in
San
Jose
and
one
in
Los Angeles
Three additional remodels scheduled for Q4
High impact refresh initiatives have been executed at a number of stores
39 stores have new/updated external signage and paint (50% of the portfolio
will be completed by year-end)
46 stores have direct entry to the nursery from the parking lot (65% of the
portfolio will be completed by year-end) |