Attached files
| file | filename |
|---|---|
| 8-K - FORM 8-K - POWERSECURE INTERNATIONAL, INC. | d407382d8k.htm |
| EX-99.1 - EX-99.1 - POWERSECURE INTERNATIONAL, INC. | d407382dex991.htm |

| September 10-12, 2012 |

| Forward Looking Statements Safe Harbor All forward-looking statements made in this presentation are made under the safe harbor provisions of the Private Securities Litigation Reform Act of 1995. Forward-looking statements, which are all statements other than statements of historical facts and include beliefs, opinions, estimates, and projections about future business developments and opportunities and financial guidance, are not guarantees of future performance or events but are subject to risks, uncertainties and other factors that could cause actual results to differ materially from those expressed, projected or implied, including risks and uncertainties set forth in the Company's SEC filings, including but not limited to the Company's most recent Form 10-K and subsequent filings on Form 8-K and 10-Q. Any forward- looking statements in this presentation speak only as of the date hereof, and the Company assumes no duty or obligation to update or revise any forward-looking statements. 2 |

| 3 PowerSecure: Utility Focused Utilities and their Large Customers |

| Electric Utilities 4 Our Products, Services, and Customers Chart shows revenues for the Last 12 Months ("LTM") ended June 2012. Industrial and Military Solutions Commercial and Retail Solutions Healthcare Solutions Data Center Solutions Utility Solutions |

| Our 2015 Goals Our 2015 Goals 5 Driving Mid-Double Digit Operating Margins |

| 6 Revenue Millions of Dollars Our Growth and Diversification |

| 7 Revenue Millions of Dollars Earnings per Share 2011 Strong Progression: Replacing Profit from Divested non-Core Businesses in 3Q-4Q E.P.S. -- Non-GAAP Continuing Ops E.P.S. -- GAAP $0.25 $0.90 $0.05 $0.06 Note: See Non-GAAP Reconciliations in Appendix |

| 8 2Q12 Results Note: See Non-GAAP Reconciliations in Appendix |

| 9 2Q12 Last Twelve Month Revenues |

| 10 We Have a Strong Balance Sheet Cash Revolver Capital Leases/Term Loan $24 million $0 drawn/$20 million available $6 million 2Q12 Key Balance Sheet Metrics |
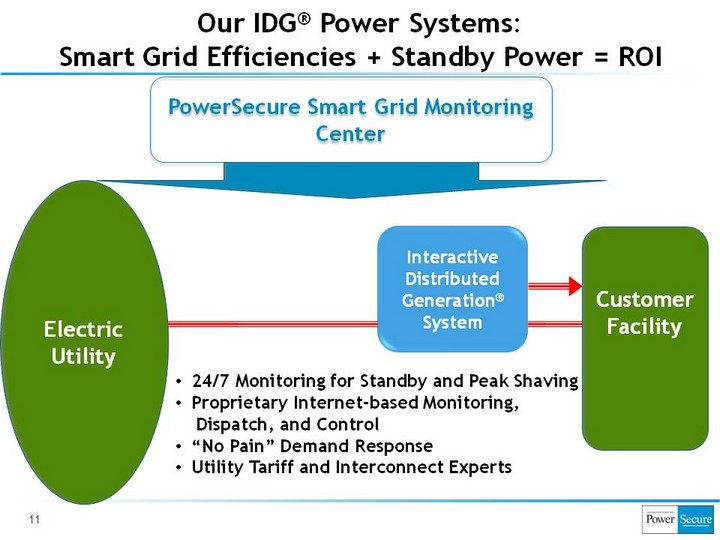
| 11 Our IDG(r) Power Systems: Smart Grid Efficiencies + Standby Power = ROI Electric Utility Customer Facility PowerSecure Smart Grid Monitoring Center Interactive Distributed Generation(r) System 24/7 Monitoring for Standby and Peak Shaving Proprietary Internet-based Monitoring, Dispatch, and Control "No Pain" Demand Response Utility Tariff and Interconnect Experts |

| 12 Wholesale Price per kWh % of Time Price Level Exists 1. Top Figure -- Source: SP 15 California Price for Day Ahead Power, January 2001-March 2008, as reported by EconStats.com. 2. Bottom Figure -- Source: PowerSecure data, utility demand curve for a winter day. Our DG Systems Operated Over 10,000 Times in 2011 Optimizing Cost During 200-250 Hours Annually of Highest Peak Demand Peak Shaving Savings Electricity Demand |

| 13 Recurring Revenue Model PowerSecure-Owned Generation PowerSecure Monitoring Revenue Distributed Generation Business Model: "Customer-Owned" and "PowerSecure- Owned" System Sale (Project-based) Model Customer-Owned Generation PowerSecure Recurring Revenue PowerSecure Revenue Cost of Sales Gross Margin PowerSecure Capital Cost of Sales Operating Margin |

| During 2011 our Customer's Average Power Outage Lasted 3 hrs 49 min The Lack of Backup Power Costs the U.S. $80 Billion Annually(1) Less than 3% of U.S. Commercial and Industrial Power is "Backed Up"(2) Distributed Power Systems are Limited to just 18,160 Generators with 21,000 Megawatts of Capacity(2) (Out of the Total 1,000,000 Megawatts of U.S. Capacity) Distributed Generation Systems Address Growing Security Concerns with U.S. Electric Grid "... the unreliability of generation from wind and solar means that reliable generation must backup every kilowatt-hour..." (Dr. Lester Lave, Carnegie Mellon, U.S. Senate Testimony, Feb 2009) "The main problems with electricity are the fragility, and... vulnerability, of the national grid... It is susceptible to extended outage from natural disaster or sabotage..." (Report of the Defense Science Board Task Force on Department of Defense Energy Strategy, Feb 2008) ... And they Provide Customers with Mission- Critical Backup Power 14 Berkeley Lab Study, 2004 EIA data, and PowerSecure estimates using EIA data |
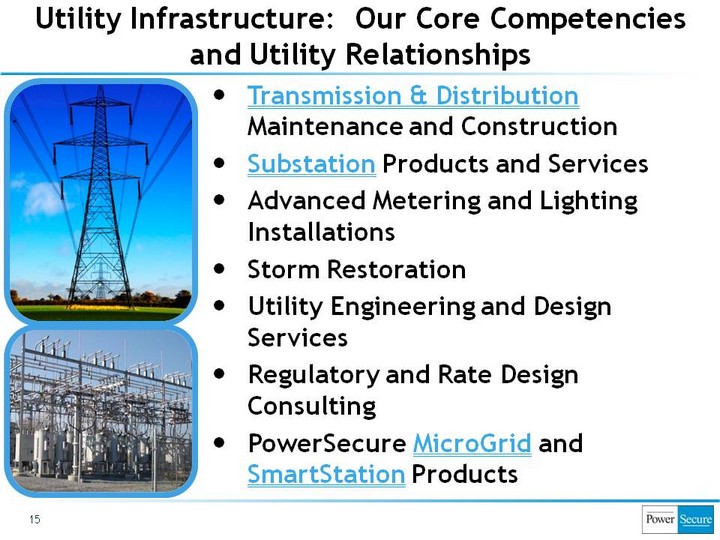
| Utility Infrastructure: Our Core Competencies and Utility Relationships 15 15 Transmission & Distribution Maintenance and Construction Substation Products and Services Advanced Metering and Lighting Installations Storm Restoration Utility Engineering and Design Services Regulatory and Rate Design Consulting PowerSecure MicroGrid and SmartStation Products |

| Utility Infrastructure: Business Progression and Growth 16 Our Utility Infrastructure Investment and Progression 2005 - Launched Utility Engineering Business 2006 - Initiated Larger Scale Infrastructure Projects for Utility Partners and their Federal Customers 2007 - Launched Utility Services Business 2009 - 3 Major Investor-Owned Utilities Initiate PowerSecure UtilityServices Crews 2010 - 1st Major Award: $30 Million, 3-Year Award Serving Major IOU 2011 - Served 9 Investor-Owned Utilities (13 Operating Divisions) Our Goal: $100 Million Business in 5 Years Industry Transmission & Distribution Investment is Estimated to be $890 Billion from 2010-2030(1) (Average of over $40 Billion/Year) Capitalize on our "People Advantage" Investing in "Technology Advantage" - PowerSecure "SmartStation" and "MicroGrid" The Brattle Group, November 2008 - "Transforming America's Power Industry - The Investment Challenge 2010-2030" |

| Energy Efficiency: LED Lighting for Retailers 17 EfficientLights(r) - LED-Based Lighting Grocery, Drug, and Convenience Stores Replaces to Traditional Fluorescent Lighting Reduces Lighting Energy Use by 70% Reduces Maintenance Cost (10 Year LED Light versus 2 Year Fluorescent) Reduces Stores' Carbon Footprint/Eliminates Mercury-containing Fluorescent Lights Increases Life of Perishable Products - Increasing Grocery Margins EfficientLights Product Suite Refrigerated Case Door Light (Flagship Product) Walk-in Cooler Light Open Refrigerated Case Shelf and Canopy Lights Parking Lot Light (Newest Light) The Market: Refrigerated Case Retrofits $1 Billion+, Street Lights $30 Billion |

| SecureLiteTM Area Light -- for Utilities and Municipalities Energy and Maintenance Savings Drive Payback Opportunity: Replace Millions of Area Lights Across U.S PowerLiteTM Street Lights -- for Utilities and Municipalities Power Drivers and Components The Market: Hundreds of Millions -- Power Driver is Major Component in Every LED Light Fortune 500 Lighting Electronics Companies, and OEMs New Commercial and Industrial Lighting SuperTubeTM LED Replacement for T-8 and T- 12 Flourescent Replacements Specialty Products Energy Efficiency: LED Lighting for Utilities, OEMs, Commercial and Industrial Facilities 18 |

| 19 ...As Our Energy Solutions Deliver Value to a Growing List of Utility Partners and Customers |

| NASDAQ: POWR www.PowerSecure.com 20 Questions? |

| Non-GAAP Financial Measures 21 |
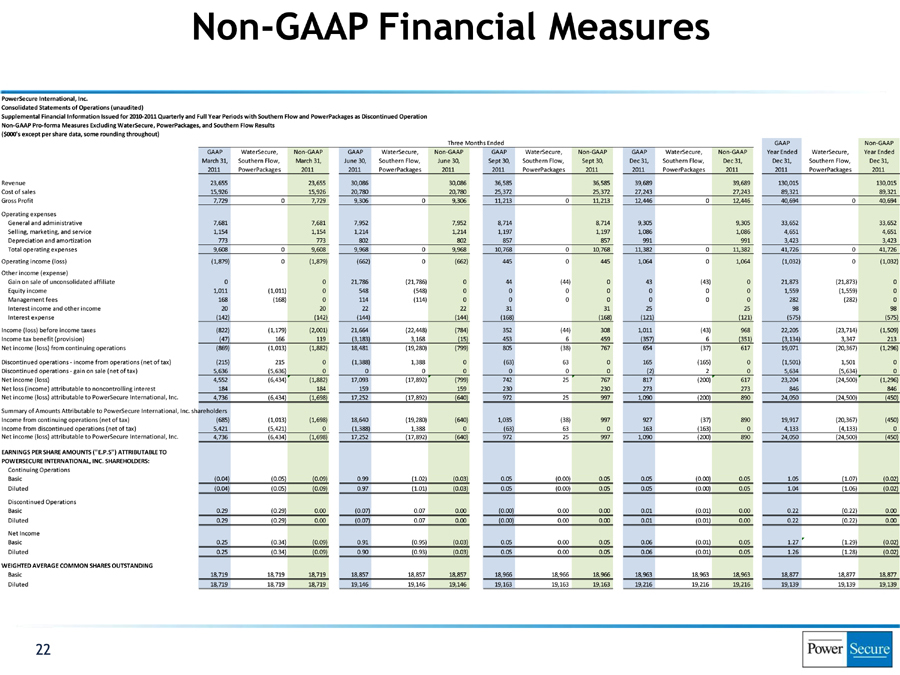
| Non-GAAP Financial Measures PowerSecure International, Inc. Consolidated Statements of Operations (unaudited) Supplemental Financial Information Issued for 2010 2011 Quarterly and Full Year Periods with Southern Flow and PowerPackages as Discontinued Operation Non GAAP Pro forma Measures Excluding WaterSecure, PowerPackages, and Southern Flow Results ($000’s except per share data, some rounding throughout) Three Months Ended GAAP Non GAAP GAAP WaterSecure, Non GAAP GAAP WaterSecure, Non GAAP GAAP WaterSecure, Non GAAP GAAP WaterSecure, Non GAAP Year Ended WaterSecure, Year Ended March 31, Southern Flow, March 31, June 30, Southern Flow, June 30, Sept 30, Southern Flow, Sept 30, Dec 31, Southern Flow, Dec 31, Dec 31, Southern Flow, Dec 31, 2011 PowerPackages 2011 2011 PowerPackages 2011 2011 PowerPackages 2011 2011 PowerPackages 2011 2011 PowerPackages 2011 Revenue 23,655 23,655 30,086 30,086 36,585 36,585 39,689 39,689 130,015 130,015 Cost of sales 15,926 15,926 20,780 20,780 25,372 25,372 27,243 27,243 89,321 89,321 Gross Profit 7,729 0 7,729 9,306 0 9,306 11,213 0 11,213 12,446 0 12,446 40,694 0 40,694 Operating expenses General and administrative 7,681 7,681 7,952 7,952 8,714 8,714 9,305 9,305 33,652 33,652 Selling, marketing, and service 1,154 1,154 1,214 1,214 1,197 1,197 1,086 1,086 4,651 4,651 Depreciation and amortization 773 773 802 802 857 857 991 991 3,423 3,423 Total operating expenses 9,608 0 9,608 9,968 0 9,968 10,768 0 10,768 11,382 0 11,382 41,726 0 41,726 Operating income (loss) (1,879) 0 (1,879) (662) 0 (662) 445 0 445 1,064 0 1,064 (1,032) 0 (1,032) Other income (expense) Gain on sale of unconsolidated affiliate 0 0 21,786 (21,786) 0 44 (44) 0 43 (43) 0 21,873 (21,873) 0 Equity income 1,011 (1,011) 0 548 (548) 0 0 0 0 0 0 0 1,559 (1,559) 0 Management fees 168 (168) 0 114 (114) 0 0 0 0 0 0 0 282 (282) 0 Interest income and other income 20 20 22 22 31 31 25 25 98 98 Interest expense (142) (142) (144) (144) (168) (168) (121) (121) (575) (575) Income (loss) before income taxes (822) (1,179) (2,001) 21,664 (22,448) (784) 352 (44) 308 1,011 (43) 968 22,205 (23,714) (1,509) Income tax benefit (provision) (47) 166 119 (3,183) 3,168 (15) 453 6 459 (357) 6 (351) (3,134) 3,347 213 Net income (loss) from continuing operations (869) (1,013) (1,882) 18,481 (19,280) (799) 805 (38) 767 654 (37) 617 19,071 (20,367) (1,296) Discontinued operations income from operations (net of tax) (215) 215 0 (1,388) 1,388 0 (63) 63 0 165 (165) 0 (1,501) 1,501 0 Discontinued operations gain on sale (net of tax) 5,636 (5,636) 0 0 0 0 0 0 0 (2) 2 0 5,634 (5,634) 0 Net income (loss) 4,552 (6,434) (1,882) 17,093 (17,892) (799) 742 25 767 817 (200) 617 23,204 (24,500) (1,296) Net loss (income) attributable to noncontrolling interest 184 184 159 159 230 230 273 273 846 846 Net income (loss) attributable to PowerSecure International, Inc. 4,736 (6,434) (1,698) 17,252 (17,892) (640) 972 25 997 1,090 (200) 890 24,050 (24,500) (450) Summary of Amounts Attributable to PowerSecure International, Inc. shareholders Income from continuing operations (net of tax) (685) (1,013) (1,698) 18,640 (19,280) (640) 1,035 (38) 997 927 (37) 890 19,917 (20,367) (450) Income from discontinued operations (net of tax) 5,421 (5,421) 0 (1,388) 1,388 0 (63) 63 0 163 (163) 0 4,133 (4,133) 0 Net income (loss) attributable to PowerSecure International, Inc. 4,736 (6,434) (1,698) 17,252 (17,892) (640) 972 25 997 1,090 (200) 890 24,050 (24,500) (450) EARNINGS PER SHARE AMOUNTS (“E.P.S”) ATTRIBUTABLE TO POWERSECURE INTERNATIONAL, INC. SHAREHOLDERS: Continuing Operations Basic (0.04) (0.05) (0.09) 0.99 (1.02) (0.03) 0.05 (0.00) 0.05 0.05 (0.00) 0.05 1.05 (1.07) (0.02) Diluted (0.04) (0.05) (0.09) 0.97 (1.01) (0.03) 0.05 (0.00) 0.05 0.05 (0.00) 0.05 1.04 (1.06) (0.02) Discontinued Operations Basic 0.29 (0.29) 0.00 (0.07) 0.07 0.00 (0.00) 0.00 0.00 0.01 (0.01) 0.00 0.22 (0.22) 0.00 Diluted 0.29 (0.29) 0.00 (0.07) 0.07 0.00 (0.00) 0.00 0.00 0.01 (0.01) 0.00 0.22 (0.22) 0.00 Net Income Basic 0.25 (0.34) (0.09) 0.91 (0.95) (0.03) 0.05 0.00 0.05 0.06 (0.01) 0.05 1.27 (1.29) (0.02) Diluted 0.25 (0.34) (0.09) 0.90 (0.93) (0.03) 0.05 0.00 0.05 0.06 (0.01) 0.05 1.26 (1.28) (0.02) WEIGHTED AVERAGE COMMON SHARES OUTSTANDING Basic 18,719 18,719 18,719 18,857 18,857 18,857 18,966 18,966 18,966 18,963 18,963 18,963 18,877 18,877 18,877 Diluted 18,719 18,719 18,719 19,146 19,146 19,146 19,163 19,163 19,163 19,216 19,216 19,216 19,139 19,139 19,139 |
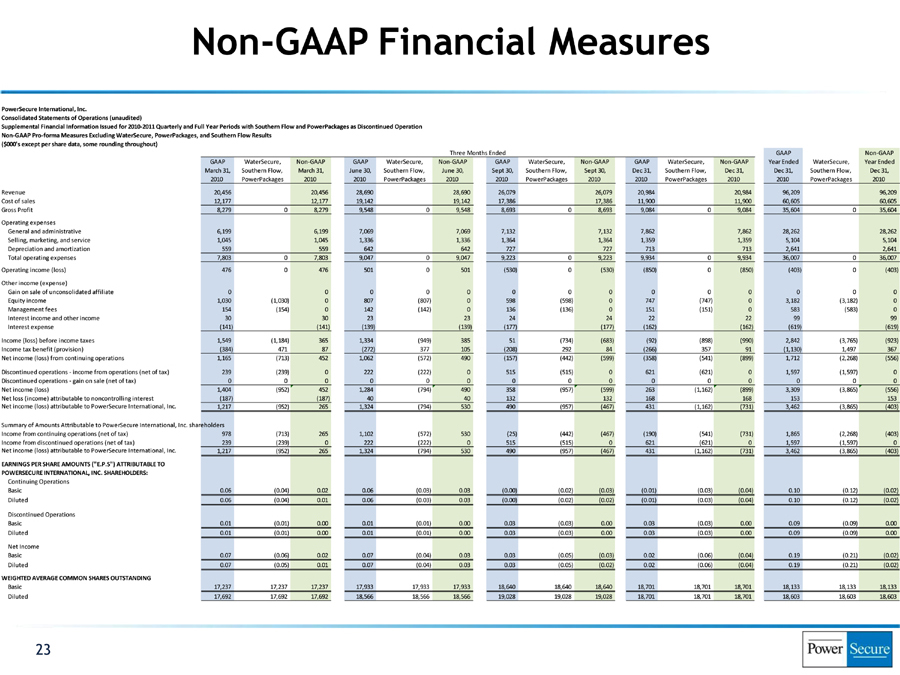
| Non-GAAP Financial Measures PowerSecure International, Inc. Consolidated Statements of Operations (unaudited) Supplemental Financial Information Issued for 2010?2011 Quarterly and Full Year Periods with Southern Flow and PowerPackages as Discontinued Operation Non?GAAP Pro?forma Measures Excluding WaterSecure, PowerPackages, and Southern Flow Results ($000’s except per share data, some rounding throughout) Three Months Ended GAAP Non?GAAP GAAP WaterSecure, Non?GAAP GAAP WaterSecure, Non?GAAP GAAP WaterSecure, Non?GAAP GAAP WaterSecure, Non?GAAP Year Ended WaterSecure, Year Ended March 31, Southern Flow, March 31, June 30, Southern Flow, June 30, Sept 30, Southern Flow, Sept 30, Dec 31, Southern Flow, Dec 31, Dec 31, Southern Flow, Dec 31, 2010 PowerPackages 2010 2010 PowerPackages 2010 2010 PowerPackages 2010 2010 PowerPackages 2010 2010 PowerPackages 2010 Revenue 20,456 20,456 28,690 28,690 26,079 26,079 20,984 20,984 96,209 96,209 Cost of sales 12,177 12,177 19,142 19,142 17,386 17,386 11,900 11,900 60,605 60,605 Gross Profit 8,279 0 8,279 9,548 0 9,548 8,693 0 8,693 9,084 0 9,084 35,604 0 35,604 Operating expenses General and administrative 6,199 6,199 7,069 7,069 7,132 7,132 7,862 7,862 28,262 28,262 Selling, marketing, and service 1,045 1,045 1,336 1,336 1,364 1,364 1,359 1,359 5,104 5,104 Depreciation and amortization 559 559 642 642 727 727 713 713 2,641 2,641 Total operating expenses 7,803 0 7,803 9,047 0 9,047 9,223 0 9,223 9,934 0 9,934 36,007 0 36,007 Operating income (loss) 476 0 476 501 0 501 (530) 0 (530) (850) 0 (850) (403) 0 (403) Other income (expense) Gain on sale of unconsolidated affiliate 0 0 0 0 0 0 0 0 0 0 0 0 0 0 Equity income 1,030 (1,030) 0 807 (807) 0 598 (598) 0 747 (747) 0 3,182 (3,182) 0 Management fees 154 (154) 0 142 (142) 0 136 (136) 0 151 (151) 0 583 (583) 0 Interest income and other income 30 30 23 23 24 24 22 22 99 99 Interest expense (141) (141) (139) (139) (177) (177) (162) (162) (619) (619) Income (loss) before income taxes 1,549 (1,184) 365 1,334 (949) 385 51 (734) (683) (92) (898) (990) 2,842 (3,765) (923) Income tax benefit (provision) (384) 471 87 (272) 377 105 (208) 292 84 (266) 357 91 (1,130) 1,497 367 Net income (loss) from continuing operations 1,165 (713) 452 1,062 (572) 490 (157) (442) (599) (358) (541) (899) 1,712 (2,268) (556) Discontinued operations ? income from operations (net of tax) 239 (239) 0 222 (222) 0 515 (515) 0 621 (621) 0 1,597 (1,597) 0 Discontinued operations ? gain on sale (net of tax) 0 0 0 0 0 0 0 0 0 0 0 0 0 0 0 Net income (loss) 1,404 (952) 452 1,284 (794) 490 358 (957) (599) 263 (1,162) (899) 3,309 (3,865) (556) Net loss (income) attributable to noncontrolling interest (187) (187) 40 40 132 132 168 168 153 153 Net income (loss) attributable to PowerSecure International, Inc. 1,217 (952) 265 1,324 (794) 530 490 (957) (467) 431 (1,162) (731) 3,462 (3,865) (403) Summary of Amounts Attributable to PowerSecure International, Inc. shareholders Income from continuing operations (net of tax) 978 (713) 265 1,102 (572) 530 (25) (442) (467) (190) (541) (731) 1,865 (2,268) (403) Income from discontinued operations (net of tax) 239 (239) 0 222 (222) 0 515 (515) 0 621 (621) 0 1,597 (1,597) 0 Net income (loss) attributable to PowerSecure International, Inc. 1,217 (952) 265 1,324 (794) 530 490 (957) (467) 431 (1,162) (731) 3,462 (3,865) (403) EARNINGS PER SHARE AMOUNTS (“E.P.S”) ATTRIBUTABLE TO POWERSECURE INTERNATIONAL, INC. SHAREHOLDERS: Continuing Operations Basic 0.06 (0.04) 0.02 0.06 (0.03) 0.03 (0.00) (0.02) (0.03) (0.01) (0.03) (0.04) 0.10 (0.12) (0.02) Diluted 0.06 (0.04) 0.01 0.06 (0.03) 0.03 (0.00) (0.02) (0.02) (0.01) (0.03) (0.04) 0.10 (0.12) (0.02) Discontinued Operations Basic 0.01 (0.01) 0.00 0.01 (0.01) 0.00 0.03 (0.03) 0.00 0.03 (0.03) 0.00 0.09 (0.09) 0.00 Diluted 0.01 (0.01) 0.00 0.01 (0.01) 0.00 0.03 (0.03) 0.00 0.03 (0.03) 0.00 0.09 (0.09) 0.00 Net Income Basic 0.07 (0.06) 0.02 0.07 (0.04) 0.03 0.03 (0.05) (0.03) 0.02 (0.06) (0.04) 0.19 (0.21) (0.02) Diluted 0.07 (0.05) 0.01 0.07 (0.04) 0.03 0.03 (0.05) (0.02) 0.02 (0.06) (0.04) 0.19 (0.21) (0.02) WEIGHTED AVERAGE COMMON SHARES OUTSTANDING Basic 17,237 17,237 17,237 17,933 17,933 17,933 18,640 18,640 18,640 18,701 18,701 18,701 18,133 18,133 18,133 Diluted 17,692 17,692 17,692 18,566 18,566 18,566 19,028 19,028 19,028 18,701 18,701 18,701 18,603 18,603 18,603 |
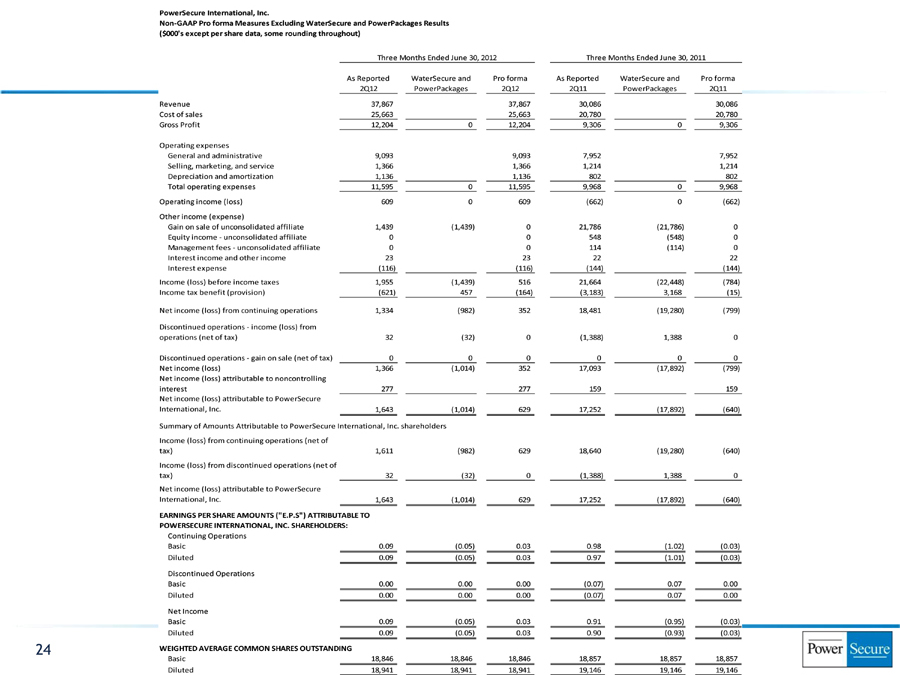
| PowerSecure International, Inc. Non GAAP Pro forma Measures Excluding WaterSecure and PowerPackages Results ($000’s except per share data, some rounding throughout) Three Months Ended June 30, 2012 Three Months Ended June 30, 2011 As Reported WaterSecure and Pro forma As Reported WaterSecure and Pro forma 2Q12 PowerPackages 2Q12 2Q11 PowerPackages 2Q11 Revenue 37,867 37,867 30,086 30,086 Cost of sales 25,663 25,663 20,780 20,780 Gross Profit 12,204 0 12,204 9,306 0 9,306 Operating expenses General and administrative 9,093 9,093 7,952 7,952 Selling, marketing, and service 1,366 1,366 1,214 1,214 Depreciation and amortization 1,136 1,136 802 802 Total operating expenses 11,595 0 11,595 9,968 0 9,968 Operating income (loss) 609 0 609 (662) 0 (662) Other income (expense) Gain on sale of unconsolidated affiliate 1,439 (1,439) 0 21,786 (21,786) 0 Equity income unconsolidated affiliate 0 0 548 (548) 0 Management fees unconsolidated affiliate 0 0 114 (114) 0 Interest income and other income 23 23 22 22 Interest expense (116) (116) (144) (144) Income (loss) before income taxes 1,955 (1,439) 516 21,664 (22,448) (784) Income tax benefit (provision) (621) 457 (164) (3,183) 3,168 (15) Net income (loss) from continuing operations 1,334 (982) 352 18,481 (19,280) (799) Discontinued operations income (loss) from operations (net of tax) 32 (32) 0 (1,388) 1,388 0 Discontinued operations gain on sale (net of tax) 0 0 0 0 0 0 Net income (loss) 1,366 (1,014) 352 17,093 (17,892) (799) Net income (loss) attributable to noncontrolling interest 277 277 159 159 Net income (loss) attributable to PowerSecure International, Inc. 1,643 (1,014) 629 17,252 (17,892) (640) Summary of Amounts Attributable to PowerSecure International, Inc. shareholders Income (loss) from continuing operations (net of tax) 1,611 (982) 629 18,640 (19,280) (640) Income (loss) from discontinued operations (net of tax) 32 (32) 0 (1,388) 1,388 0 Net income (loss) attributable to PowerSecure International, Inc. 1,643 (1,014) 629 17,252 (17,892) (640) EARNINGS PER SHARE AMOUNTS (“E.P.S”) ATTRIBUTABLE TO POWERSECURE INTERNATIONAL, INC. SHAREHOLDERS: Continuing Operations Basic 0.09 (0.05) 0.03 0.98 (1.02) (0.03) Diluted 0.09 (0.05) 0.03 0.97 (1.01) (0.03) Discontinued Operations Basic 0.00 0.00 0.00 (0.07) 0.07 0.00 Diluted 0.00 0.00 0.00 (0.07) 0.07 0.00 Net Income Basic 0.09 (0.05) 0.03 0.91 (0.95) (0.03) Diluted 0.09 (0.05) 0.03 0.90 (0.93) (0.03) WEIGHTED AVERAGE COMMON SHARES OUTSTANDING Basic 18,846 18,846 18,846 18,857 18,857 18,857 Diluted 18,941 18,941 18,941 19,146 19,146 19,146 |