Attached files
| file | filename |
|---|---|
| 8-K - 8-K - COMERICA INC /NEW/ | barclaysform8-k.htm |
Comerica IncorporatedBarclays Capital Global Financial Services ConferenceSeptember 11, 2012Ralph W. Babb, Jr. Karen Parkhill Chairman and CEO Vice Chairman and CFO Lars Anderson Vice Chairman – The Business Bank Safe Harbor Statement 2 Any statements in this presentation that are not historical facts are forward-looking statements as defined in the Private Securities Litigation ReformAct of 1995. Words such as “anticipates,” “believes,” “contemplates,” “feels,” “expects,” “estimates,” “seeks,” “strives,” “plans,” “intends,” “outlook,”“forecast,” “position,” “target,” “mission,” “assume,” “achievable,” “potential,” “strategy,” “goal,” “aspiration,” “opportunity,” “initiative,” “outcome,”“continue,” “remain,” “maintain,” “on course,” “trend,” “objective,” “looks forward” and variations of such words and similar expressions, or future orconditional verbs such as “will,” “would,” “should,” “could,” “might,” “can,” “may” or similar expressions, as they relate to Comerica or its management,are intended to identify forward-looking statements. These forward-looking statements are predicated on the beliefs and assumptions of Comerica'smanagement based on information known to Comerica's management as of the date of this presentation and do not purport to speak as of any otherdate. Forward-looking statements may include descriptions of plans and objectives of Comerica's management for future or past operations,products or services, and forecasts of Comerica's revenue, earnings or other measures of economic performance, including statements ofprofitability, business segments and subsidiaries, estimates of credit trends and global stability. Such statements reflect the view of Comerica'smanagement as of this date with respect to future events and are subject to risks and uncertainties. Should one or more of these risks materialize orshould underlying beliefs or assumptions prove incorrect, Comerica's actual results could differ materially from those discussed. Factors that couldcause or contribute to such differences are changes in general economic, political or industry conditions; changes in monetary and fiscal policies,including the interest rate policies of the Federal Reserve Board; volatility and disruptions in global capital and credit markets; changes in Comerica'scredit rating; the interdependence of financial service companies; changes in regulation or oversight; unfavorable developments concerning creditquality; the acquisition of Sterling Bancshares, Inc., or any future acquisitions; the effects of more stringent capital or liquidity requirements; declinesor other changes in the businesses or industries of Comerica's customers; the implementation of Comerica's strategies and business models,including the implementation of revenue enhancements and efficiency improvements; Comerica's ability to utilize technology to efficiently andeffectively develop, market and deliver new products and services; operational difficulties, failure of technology infrastructure or information securityincidents; changes in the financial markets, including fluctuations in interest rates and their impact on deposit pricing; competitive product and pricingpressures among financial institutions within Comerica's markets; changes in customer behavior; management's ability to maintain and expandcustomer relationships; management's ability to retain key officers and employees; the impact of legal and regulatory proceedings; the effectivenessof methods of reducing risk exposures; the effects of terrorist activities and other hostilities; the effects of catastrophic events including, but notlimited to, hurricanes, tornadoes, earthquakes, fires, droughts and floods; changes in accounting standards and the critical nature of Comerica'saccounting policies. Comerica cautions that the foregoing list of factors is not exclusive. For discussion of factors that may cause actual results todiffer from expectations, please refer to our filings with the Securities and Exchange Commission. In particular, please refer to “Item 1A. RiskFactors” beginning on page 12 of Comerica's Annual Report on Form 10-K for the year ended December 31, 2011. Forward-looking statementsspeak only as of the date they are made. Comerica does not undertake to update forward-looking statements to reflect facts, circumstances,assumptions or events that occur after the date the forward-looking statements are made. For any forward-looking statements made in thispresentation or in any documents, Comerica claims the protection of the safe harbor for forward-looking statements contained in the PrivateSecurities Litigation Reform Act of 1995.

Comerica: A Brief Overview Among the top 25 U.S. bank holding companies $63 billion in assets Strong presence in Texas, California, and Michigan Three primary lines of business: Business Bank, Retail Bank, and Wealth Management Founded over 160 years ago Strong capital position• Tier 1 Common Ratio 10.38%3 3 Business Segment Revenue1 Business Bank $92859% Retail Bank $417 27% WM $22414% Market Segment Revenue2 Other Markets $1238% Western$41827% International $55 4% Texas$35623% Florida$282% Midwest$58936% At 6/30/12; $ in millions (MM) 1YTD 6/30/12; YTD revenues (FTE) of $1,569MM from major business segments ($1,296MM from continuing operations (FTE) including Finance & Other Businesses); 2YTD 6/30/12: YTD revenues (FTE) of $1,569MM from major geographic markets ($1,296MM from continuing operations (FTE) including Finance & Other Businesses) based on office of origination; Midwest includes: MI, OH, IL; Western includes: CA, AZ, NV, CO, WA; Other Markets include markets not separately identified above in addition to businesses with a national perspective. 3See Supplemental Financial Data slides for reconciliation of non-GAAP financial measures Well Positioned in Growth Markets 4 1Source: Census Bureau: Top 15 cities w/ population increase between 4/1/10 and 7/1/11. 2Source: Comerica Economics forecast of nonfarm payroll data based on Bureau of Labor Statistics, as compiled by Moody’s Analytics. Analysis as of August 2012. 3Comerica average also includes the Miami MSA. 0 20 40 60 80 San Jose, CAWashington El Paso, TXFort Worth, TX New OrleansSan Diego Charlotte, NCDenver PhoenixDallas Los AngelesAustin, TX San AntonioHouston New York Comerica Markets U.S. Census BureauTop 15 Growth Cities1 Population Increase (in 000’s) 1.5 1.1 2.7 3.3 2.2 1.9 2.3 1.8 1.3 1.7 1.5 3.1 3.6 2.2 1.9 2.5 2.7 1.3 0.0 1.0 2.0 3.0 4.0 Central W. MI Detroit Austin Houston North Texas San Antonio Phoenix No. CA So. CA 2012f 2013f 2013 U.S. Average 1.1% 2012 CMA Market Avg.3 2.1%2013 CMA Market Avg.3 1.9% Year Over Year Projected Job GrowthIn Comerica Metro Areas2 2012 U.S. Average 1.4%
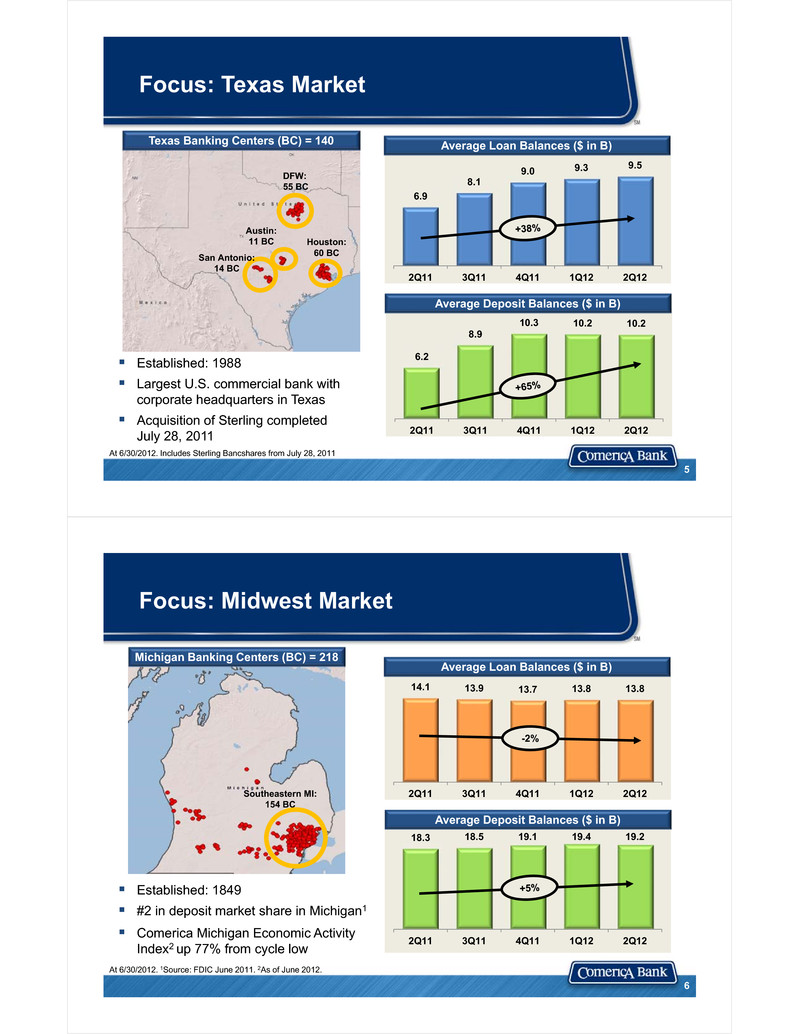
Established: 1988 Largest U.S. commercial bank with corporate headquarters in Texas Acquisition of Sterling completed July 28, 2011 Focus: Texas Market 6.2 8.9 10.3 10.2 10.2 2Q11 3Q11 4Q11 1Q12 2Q12 Average Deposit Balances ($ in B) 5 6.9 8.1 9.0 9.3 9.5 2Q11 3Q11 4Q11 1Q12 2Q12 Average Loan Balances ($ in B) DFW: 55 BC Houston: 60 BC Austin: 11 BC San Antonio: 14 BC Texas Banking Centers (BC) = 140 At 6/30/2012. Includes Sterling Bancshares from July 28, 2011 Focus: Midwest Market Established: 1849 #2 in deposit market share in Michigan1 Comerica Michigan Economic Activity Index2 up 77% from cycle low 18.3 18.5 19.1 19.4 19.2 2Q11 3Q11 4Q11 1Q12 2Q12 Average Deposit Balances ($ in B) At 6/30/2012. 1Source: FDIC June 2011. 2As of June 2012. 6 14.1 13.9 13.7 13.8 13.8 2Q11 3Q11 4Q11 1Q12 2Q12 Average Loan Balances ($ in B) Southeastern MI: 154 BC Michigan Banking Centers (BC) = 218 -2%

Focus: Western Market Established: 1991 Comerica California Economic Activity Index1 up 41% from cycle low 12.5 13.0 13.7 13.9 14.4 2Q11 3Q11 4Q11 1Q12 2Q12 Average Deposit Balances ($ in B) At 6/30/2012. 1As of June 2012. 7 12.1 11.9 12.0 12.4 12.9 2Q11 3Q11 4Q11 1Q12 2Q12 Average Loan Balances ($ in B) Northern CA: 45 BC BC = Banking Centers Phoenix AZ: 18 BCSouthern CA: 60 BC Western Banking Centers (BC) = 123 Loan Growth Outpacing Peers & Industry 8 1Source: SNL Financial. First half of 2012 average calculated as the simple average of 1Q12 and 2Q12 average loans. Includes Sterling Bancshares loans from July 28, 2011. 2Source: Federal Reserve H.8 as of 8/15/12. Large banks are defined as the top 25 domestically chartered commercial banks, ranked by domestic assets. -2% 0% 2% 4% 6% 3Q11 4Q11 1Q12 2Q12 3Q12 ComericaCMA Excluding Mortgage BankerAll Banks Average Quarterly Total Loan Growth2 -4.7 % -3.9 % 0.0% 0.0% 2.1 % 4.7% 4.8 % 4.9% 6.2% 6.5 % 6.7% 8.8% Peer Average: 3.0% Total Average Loan Growth1(FY11 vs. 1H12)

Commercial Loans Drive Growth 1All Other: Wealth Management (-$160MM), Small Business (+$118), Personal Banking (-$53MM), Commercial Real Estate (-$32MM), and the remaining components of specialty businesses not discussed above (-$29MM). 2Outlook as of September 7, 2012. 9 FY11 vs. 1H12Average Loans ($ in MM) TotalFY11 1H12 $40,074 $42,749 $332 $386 $566 $583 $762 $202-$156 July and August average loan trends: • Mortgage Banker Finance, Tech & Life Sciences, Energy increasing • National Dealer Services stable –seasonal decline has not yet materialized • Commercial Real Estate continues to decline, as expected Management 2012 Outlook2 Full-year 2012 compared to full-year 2011 Average loans Around +7% Net interest income +4 - 5% Loan Yields Positioned for Growth with Floating Rate, Faster Growing Commercial Loans At 6/30/12.Source: SNL Financial. 1Peer Banks include BBT, BOKF, FITB, FHN, HBAN, KEY, MTB, RF, STI, ZION. 2Excludes BBT and ZION as amounts were not reported. 4Excludes SNV and ZION as amounts were not reported. Loan yields reflect: Approx. 85% of loans are floating rate with 75% LIBOR based Rate floors are minimal (<10% of loans) Credit quality among the best of peers Focused on pricing discipline 10 3.00 3.50 4.00 4.50 5.00 2Q11 3Q11 4Q11 1Q12 2Q12 Average of Peer Banks CMA Loan Yield Differential Narrows from 2Q11 (%)1 0.95 0.69 0% 20% 40% 60% 80% 100% CMA BOKF KEY FHN FITB STI HBAN RF SNV MTB C&I Commercial RE All Other Large Proportion of C&I Loans2 0% 20% 40% 60% 80% 100% CMA FHN KEY RF MTB HBAN STI BOKF FITB BBT 3 Months or Less Greater Than 3 Months Faster Re-pricing or Maturity Date4
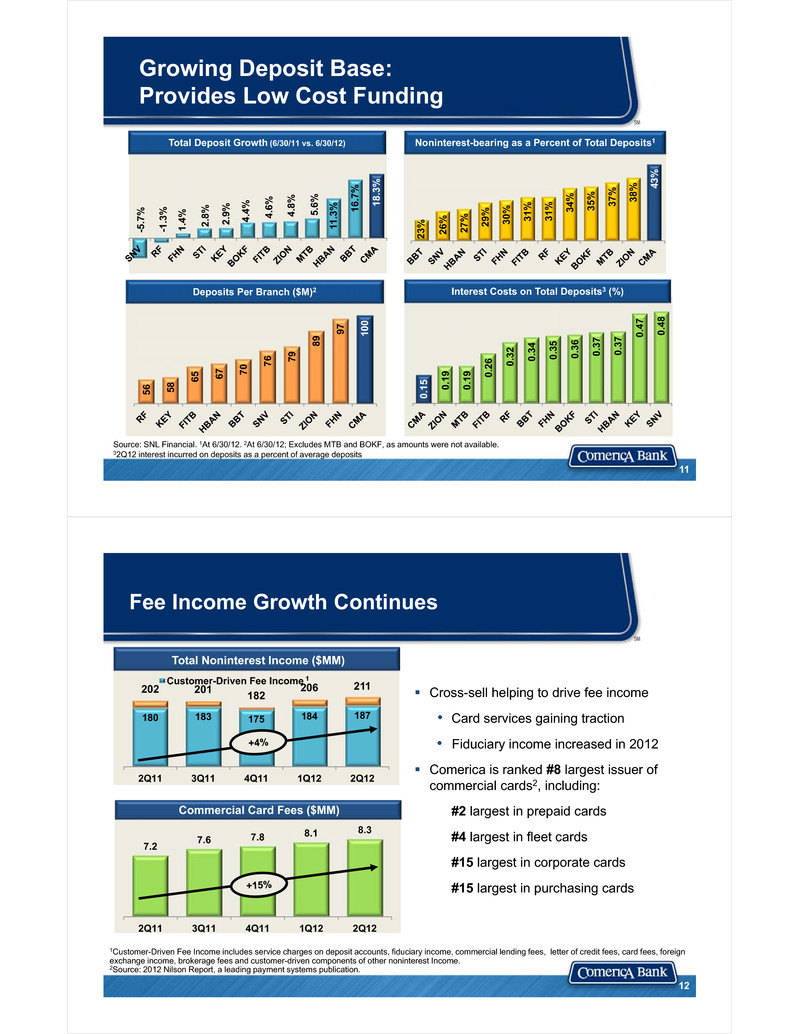
Growing Deposit Base: Provides Low Cost Funding 11 23% 26% 27 % 29% 30% 31 % 31% 34 % 35% 37% 38 % 43% Noninterest-bearing as a Percent of Total Deposits1 0.15 0. 19 0.19 0 .26 0.3 2 0.34 0.35 0.3 6 0.37 0.37 0.47 0.48 -5.7 % -1.3 % 1.4% 2.8 % 2.9% 4.4 % 4.6% 4.8% 5.6 % 11.3 % 16.7 % 18.3 % Total Deposit Growth (6/30/11 vs. 6/30/12) 56 58 6 5 67 70 7 6 79 8 9 97 100 Interest Costs on Total Deposits3 (%)Deposits Per Branch ($M)2 Source: SNL Financial. 1At 6/30/12. 2At 6/30/12; Excludes MTB and BOKF, as amounts were not available. 32Q12 interest incurred on deposits as a percent of average deposits Fee Income Growth Continues 1Customer-Driven Fee Income includes service charges on deposit accounts, fiduciary income, commercial lending fees, letter of credit fees, card fees, foreign exchange income, brokerage fees and customer-driven components of other noninterest Income. 2Source: 2012 Nilson Report, a leading payment systems publication. 12 Cross-sell helping to drive fee income • Card services gaining traction • Fiduciary income increased in 2012 Comerica is ranked #8 largest issuer of commercial cards2, including: #2 largest in prepaid cards #4 largest in fleet cards #15 largest in corporate cards #15 largest in purchasing cards 7.2 7.6 7.8 8.1 8.3 2Q11 3Q11 4Q11 1Q12 2Q12 Commercial Card Fees ($MM) 180 183 175 184 187 202 201 182 206 211 2Q11 3Q11 4Q11 1Q12 2Q12 Customer-Driven Fee Income Total Noninterest Income ($MM) 1
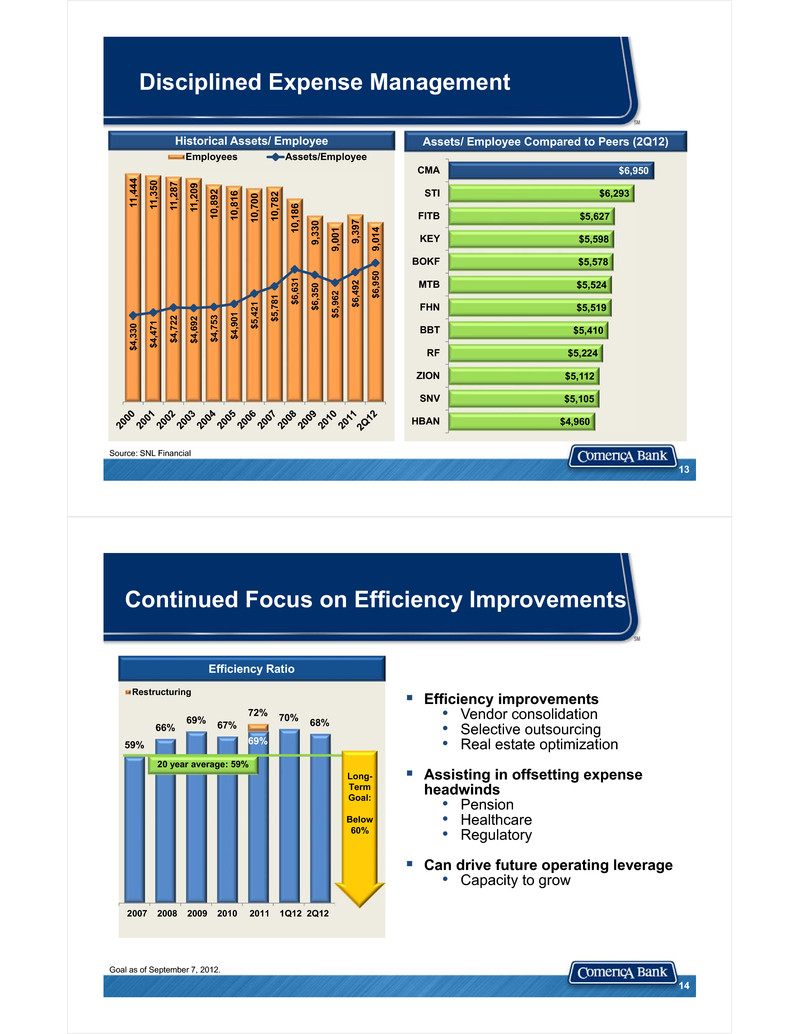
Disciplined Expense Management 13 11,4 44 11,3 50 11,2 87 11,2 09 10,8 92 10,8 16 10,7 00 10,7 82 10,1 86 9,33 0 9,00 1 9,39 7 9,01 4 $4,3 30 $4,4 71 $4,7 22 $4,6 92 $4,7 53 $4,9 01 $5,4 21 $5,7 81 $6,6 31 $6,3 50 $5,9 62 $6,4 92 $6,9 50 Employees Assets/EmployeeHistorical Assets/ Employee $4,960 $5,105 $5,112 $5,224 $5,410 $5,519 $5,524 $5,578 $5,598 $5,627 $6,293 $6,950 HBAN SNV ZION RF BBT FHN MTB BOKF KEY FITB STI CMA Assets/ Employee Compared to Peers (2Q12) Source: SNL Financial Continued Focus on Efficiency Improvements 69%59% 66% 69% 67% 72% 70% 68% Restructuring 2007 2008 2009 2010 2011 1Q12 2Q12 20 year average: 59% Efficiency Ratio Goal as of September 7, 2012. Long-TermGoal: Below 60% 14 Efficiency improvements• Vendor consolidation• Selective outsourcing• Real estate optimization Assisting in offsetting expense headwinds• Pension• Healthcare• Regulatory Can drive future operating leverage• Capacity to grow

15 2Q12 Tier 1Capital Ratio Estimated2Q12 Basel IIITier 1 Capital Basel III Estimate 10.38% ≈ 9.30-9.50% Capital Position Remains StrongEven Under Proposed Rules Regulatory Standard38.5% in 2019 1Source: Company 10-Q’s as of 6/30/12, except for FHN and ZION, which was sourced from 6/30/12 earnings releases. Excludes MTB and SNV as amounts were not available. Peer ratios may be estimates. Peer impact may be calculated using different assumptions and may not be comparable. Impact is estimated. 2Impact on Comerica is estimated and subject to final rulemaking. Comerica may be affected by other changes due to Basel III.3Final 2019 fully phased in Tier 1 plus a conservation buffer without the SIFI Buffer which has not yet been announced. Change in Capital Definition ≈ 50 - 55 bps Changes to Risk-weighted Assets ≈ 40 - 55 bps Total Tier 1 Change ≈ 90 - 110 bps Primary Basel III Adjustments2 12.8% 10.9% 9.4% 9.0% 8.6% 8.2% 8.2% 8.0% 8.0% 7.8% 13.4% 11.6% 10.4% 9.8% 10.1% 10.6% 9.7% 10.0% 9.4% 9.8% BOKF KEY CMA FITB HBAN FHN BBT RF STI ZION Basel III Tier 1 CommonBasel III ImpactBasel I Tier 1 Common Basel III Capital Ratios – CMA and Peer Banks1 + Active Capital Manager:Highest Payout Among Peers 16 Source: SNL Financial 1Excludes FHN as not reported on SNL. 2The net payout yield is the combination of the dividend yield and the net buyback yield added together to calculate the yield returned to shareholders as of 6/30/2012. 81% 57% 50% 41% 33% 29% 27% 20% 10% 5% 3% Dividend Shares Repurchased Payout Ratio1 (2Q12) 5.8% 6.8% 4.6% 2.9% 0.2% 7.8% 7.3% 7.2% 5.4% 3.4% 2.8%2.6%2.4%2.0% 0.8% 0.6% 0.2% Dividend Shares Repurchased Net Payout Yield2 (2Q12)
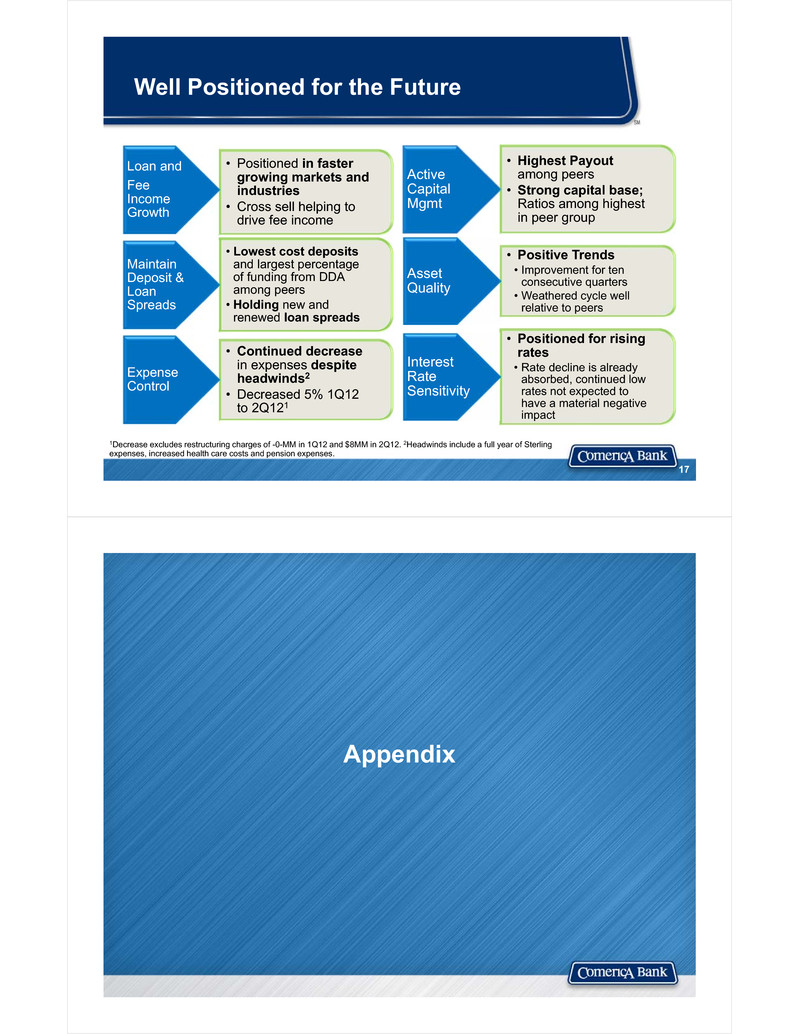
• Highest Payout among peers• Strong capital base; Ratios among highest in peer group Active Capital Mgmt • Positive Trends• Improvement for ten consecutive quarters• Weathered cycle well relative to peers Asset Quality • Positioned for rising rates• Rate decline is already absorbed, continued low rates not expected to have a material negative impact Interest Rate Sensitivity • Positioned in faster growing markets andindustries• Cross sell helping to drive fee income Loan and Fee Income Growth • Lowest cost deposits and largest percentage of funding from DDA among peers• Holding new and renewed loan spreads Maintain Deposit & Loan Spreads • Continued decrease in expenses despite headwinds2• Decreased 5% 1Q12 to 2Q121 Expense Control 17 Well Positioned for the Future 1Decrease excludes restructuring charges of -0-MM in 1Q12 and $8MM in 2Q12. 2Headwinds include a full year of Sterling expenses, increased health care costs and pension expenses. Appendix
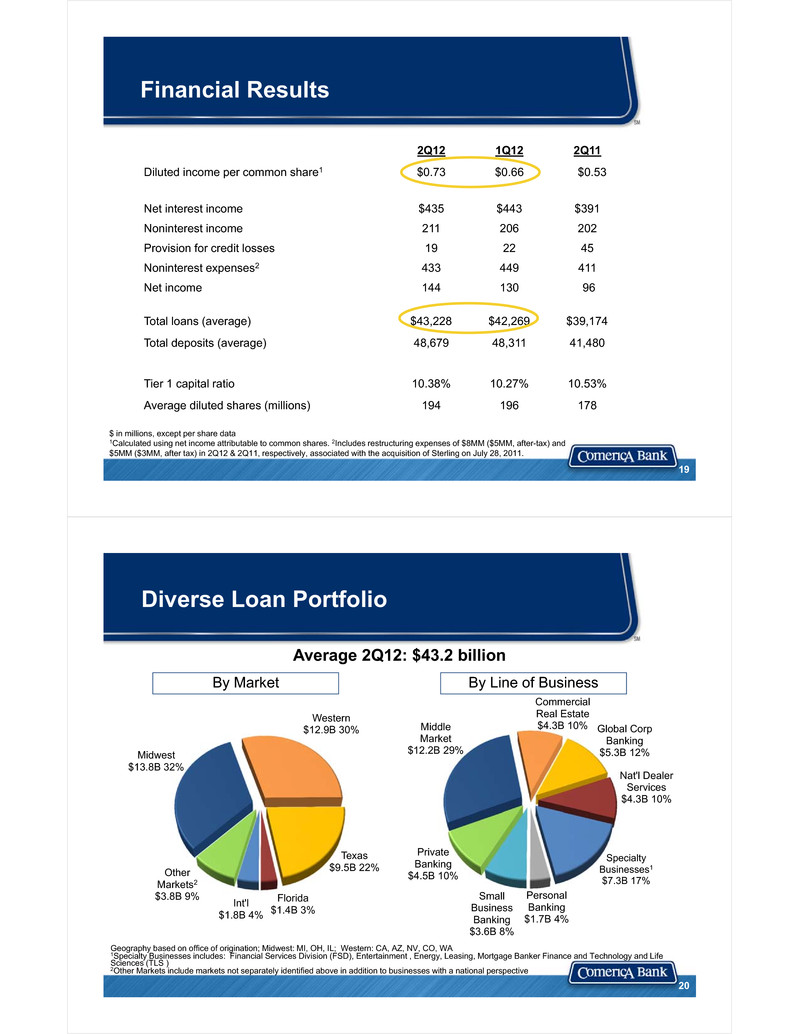
Financial Results $ in millions, except per share data1Calculated using net income attributable to common shares. 2Includes restructuring expenses of $8MM ($5MM, after-tax) and $5MM ($3MM, after tax) in 2Q12 & 2Q11, respectively, associated with the acquisition of Sterling on July 28, 2011. 2Q12 1Q12 2Q11 Diluted income per common share1 $0.73 $0.66 $0.53 Net interest income $435 $443 $391 Noninterest income 211 206 202 Provision for credit losses 19 22 45 Noninterest expenses2 433 449 411 Net income 144 130 96 Total loans (average) $43,228 $42,269 $39,174 Total deposits (average) 48,679 48,311 41,480 Tier 1 capital ratio 10.38% 10.27% 10.53% Average diluted shares (millions) 194 196 178 19 Diverse Loan Portfolio Geography based on office of origination; Midwest: MI, OH, IL; Western: CA, AZ, NV, CO, WA1Specialty Businesses includes: Financial Services Division (FSD), Entertainment , Energy, Leasing, Mortgage Banker Finance and Technology and Life Sciences (TLS )2Other Markets include markets not separately identified above in addition to businesses with a national perspective Midwest$13.8B 32% Western$12.9B 30% Texas $9.5B 22% Florida $1.4B 3%Int'l$1.8B 4% Other Markets2$3.8B 9% Middle Market$12.2B 29% CommercialReal Estate$4.3B 10% Global CorpBanking$5.3B 12% Nat'l DealerServices$4.3B 10% SpecialtyBusinesses1$7.3B 17%Personal Banking$1.7B 4% Small Business Banking $3.6B 8% Private Banking$4.5B 10% Average 2Q12: $43.2 billion By Market By Line of Business 20
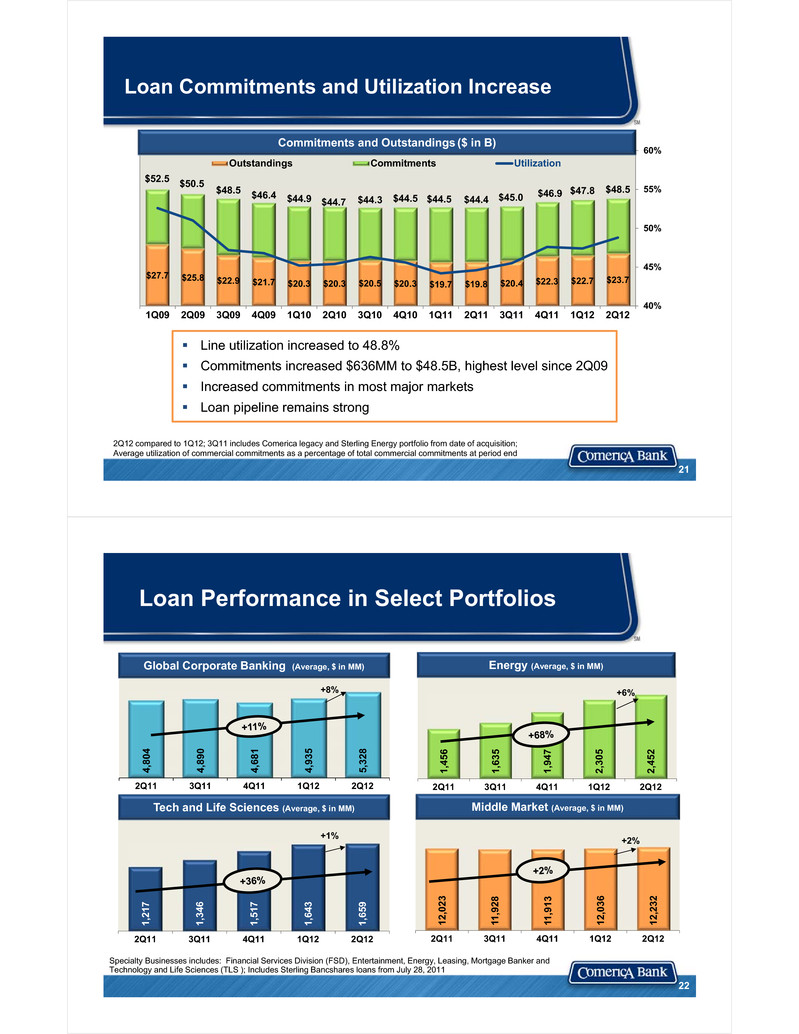
Loan Commitments and Utilization Increase $27.7 $25.8 $22.9 $21.7 $20.3 $20.3 $20.5 $20.3 $19.7 $19.8 $20.4 $22.3 $22.7 $23.7 $52.5 $50.5 $48.5 $46.4 $44.9 $44.7 $44.3 $44.5 $44.5 $44.4 $45.0 $46.9 $47.8 $48.5 40% 45% 50% 55% 60% 1Q09 2Q09 3Q09 4Q09 1Q10 2Q10 3Q10 4Q10 1Q11 2Q11 3Q11 4Q11 1Q12 2Q12 Outstandings Commitments Utilization Commitments and Outstandings ($ in B) 2Q12 compared to 1Q12; 3Q11 includes Comerica legacy and Sterling Energy portfolio from date of acquisition; Average utilization of commercial commitments as a percentage of total commercial commitments at period end Line utilization increased to 48.8% Commitments increased $636MM to $48.5B, highest level since 2Q09 Increased commitments in most major markets Loan pipeline remains strong 21 1,45 6 1,63 5 1,94 7 2,30 5 2,45 2 2Q11 3Q11 4Q11 1Q12 2Q12 +6% 12,0 23 11,9 28 11,9 13 12,0 36 12,2 32 2Q11 3Q11 4Q11 1Q12 2Q12 +2% Loan Performance in Select Portfolios Specialty Businesses includes: Financial Services Division (FSD), Entertainment, Energy, Leasing, Mortgage Banker and Technology and Life Sciences (TLS ); Includes Sterling Bancshares loans from July 28, 2011 Middle Market (Average, $ in MM) Energy (Average, $ in MM) 1,21 7 1,34 6 1,51 7 1,64 3 1,65 9 2Q11 3Q11 4Q11 1Q12 2Q12 +1% Tech and Life Sciences (Average, $ in MM) 22 4,80 4 4,89 0 4,68 1 4,93 5 5,32 8 2Q11 3Q11 4Q11 1Q12 2Q12 +8% Global Corporate Banking (Average, $ in MM)
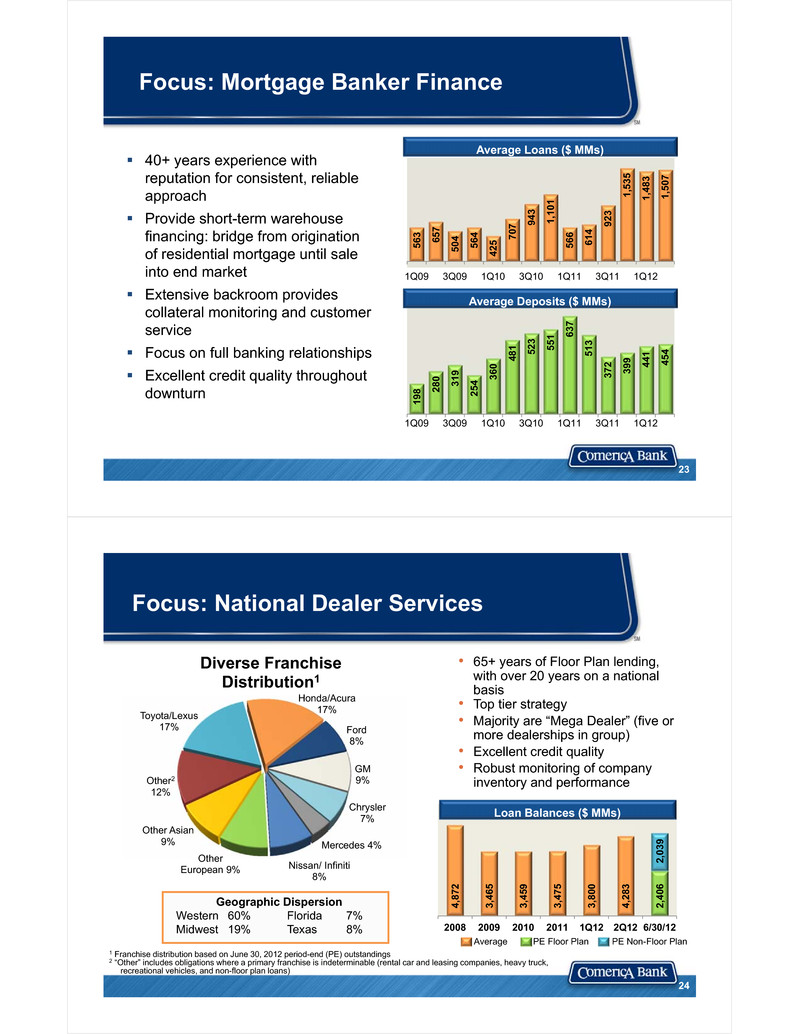
Focus: Mortgage Banker Finance 23 40+ years experience with reputation for consistent, reliable approach Provide short-term warehouse financing: bridge from origination of residential mortgage until sale into end market Extensive backroom provides collateral monitoring and customer service Focus on full banking relationships Excellent credit quality throughout downturn 563 65 7 504 564 425 707 9 43 1,10 1 566 614 923 1,53 5 1,48 3 1,50 7 1Q09 3Q09 1Q10 3Q10 1Q11 3Q11 1Q12 Average Loans ($ MMs) 198 2 80 319 254 360 481 52 3 551 6 37 513 372 399 4 41 454 1Q09 3Q09 1Q10 3Q10 1Q11 3Q11 1Q12 Average Deposits ($ MMs) Toyota/Lexus 17% Honda/Acura 17% Ford 8% GM 9% Chrysler 7% Mercedes 4% Nissan/ Infiniti 8% Other European 9% Other Asian 9% Other212% Diverse Franchise Distribution1 Focus: National Dealer Services Geographic DispersionWestern 60% Florida 7%Midwest 19% Texas 8% 1 Franchise distribution based on June 30, 2012 period-end (PE) outstandings2 “Other” includes obligations where a primary franchise is indeterminable (rental car and leasing companies, heavy truck, recreational vehicles, and non-floor plan loans) • 65+ years of Floor Plan lending, with over 20 years on a national basis • Top tier strategy• Majority are “Mega Dealer” (five or more dealerships in group)• Excellent credit quality• Robust monitoring of company inventory and performance Average PE Floor Plan PE Non-Floor Plan 4,87 2 3,46 5 3,45 9 3,47 5 3,80 0 4,28 3 2,40 6 2,03 9 2008 2009 2010 2011 1Q12 2Q12 6/30/12 24 Loan Balances ($ MMs)
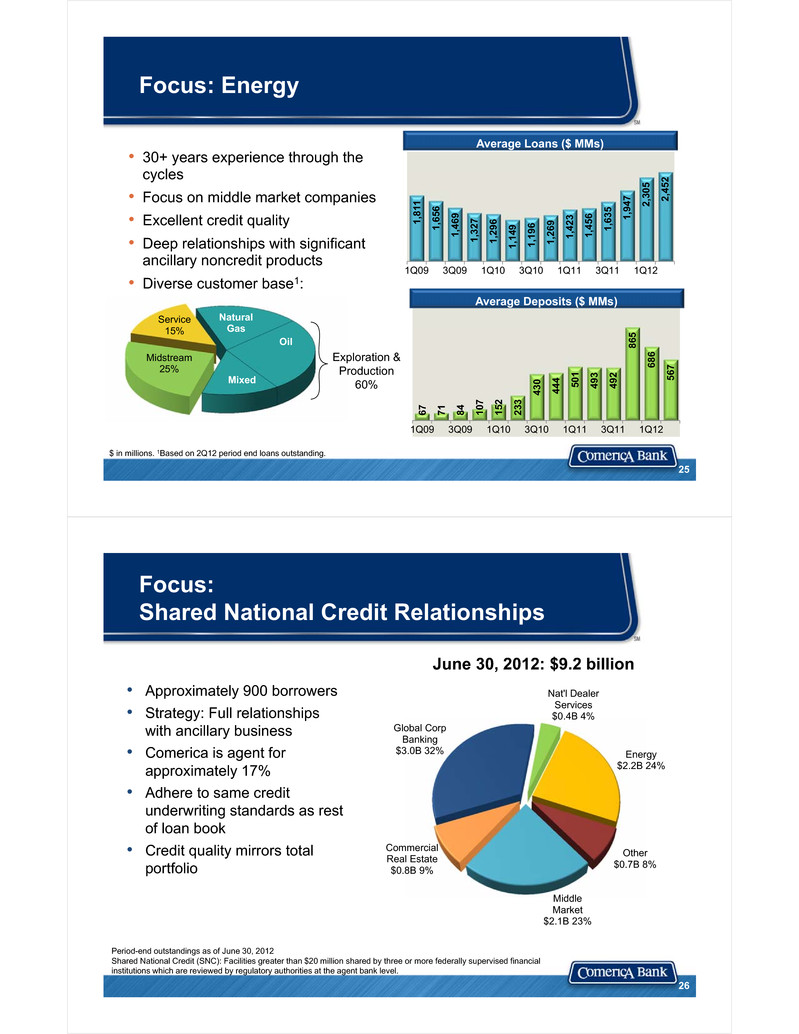
Focus: Energy • 30+ years experience through the cycles • Focus on middle market companies• Excellent credit quality• Deep relationships with significant ancillary noncredit products • Diverse customer base1: Natural Gas Oil Mixed Midstream 25% Service 15% Exploration & Production 60% $ in millions. 1Based on 2Q12 period end loans outstanding. 1,81 1 1,65 6 1,46 9 1,32 7 1,29 6 1,14 9 1,19 6 1,26 9 1,42 3 1,45 6 1,63 5 1,94 7 2,30 5 2,45 2 1Q09 3Q09 1Q10 3Q10 1Q11 3Q11 1Q12 Average Loans ($ MMs) 67 71 84 107 152 233 430 444 50 1 493 492 865 686 567 1Q09 3Q09 1Q10 3Q10 1Q11 3Q11 1Q12 Average Deposits ($ MMs) 25 • Approximately 900 borrowers• Strategy: Full relationships with ancillary business• Comerica is agent for approximately 17%• Adhere to same credit underwriting standards as rest of loan book • Credit quality mirrors total portfolio June 30, 2012: $9.2 billion Period-end outstandings as of June 30, 2012Shared National Credit (SNC): Facilities greater than $20 million shared by three or more federally supervised financial institutions which are reviewed by regulatory authorities at the agent bank level. Commercial Real Estate $0.8B 9% Global Corp Banking $3.0B 32% Nat'l Dealer Services $0.4B 4% Energy $2.2B 24% Other $0.7B 8% Middle Market $2.1B 23% 26 Focus:Shared National Credit Relationships
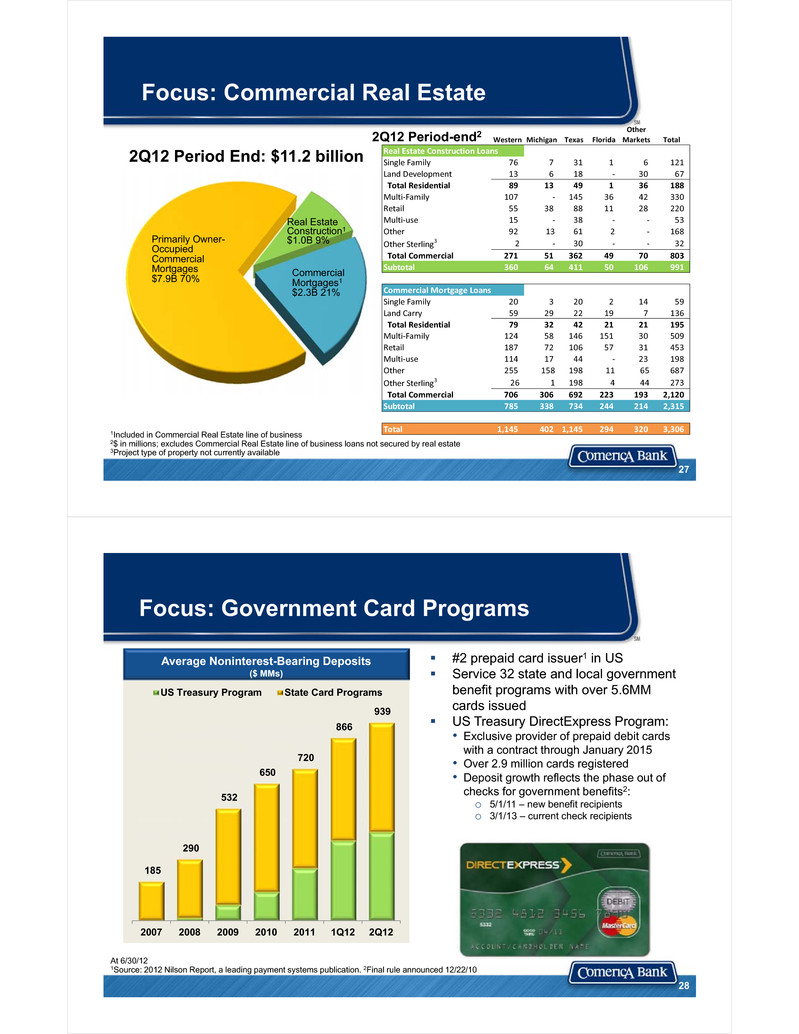
Focus: Commercial Real Estate 1Included in Commercial Real Estate line of business2$ in millions; excludes Commercial Real Estate line of business loans not secured by real estate3Project type of property not currently available 2Q12 Period End: $11.2 billion Primarily Owner-Occupied Commercial Mortgages$7.9B 70% Real Estate Construction1 $1.0B 9% Commercial Mortgages1 $2.3B 21% 2Q12 Period-end2 27 Western Michigan Texas Florida Other Markets Total Single Family 76 7 31 1 6 121Land Development 13 6 18 ‐ 30 67Total Residential 89 13 49 1 36 188Multi‐Family 107 ‐ 145 36 42 330Retail 55 38 88 11 28 220Multi‐use 15 ‐ 38 ‐ ‐ 53Other 92 13 61 2 ‐ 168Other Sterling3 2 ‐ 30 ‐ ‐ 32Total Commercial 271 51 362 49 70 803Subtotal 360 64 411 50 106 991 Single Family 20 3 20 2 14 59Land Carry 59 29 22 19 7 136Total Residential 79 32 42 21 21 195Multi‐Family 124 58 146 151 30 509Retail 187 72 106 57 31 453Multi‐use 114 17 44 ‐ 23 198Other 255 158 198 11 65 687Other Sterling3 26 1 198 4 44 273Total Commercial 706 306 692 223 193 2,120Subtotal 785 338 734 244 214 2,315 Total 1,145 402 1,145 294 320 3,306 Real Estate Construction Loans Commercial Mortgage Loans At 6/30/121Source: 2012 Nilson Report, a leading payment systems publication. 2Final rule announced 12/22/10 Focus: Government Card Programs #2 prepaid card issuer1 in US Service 32 state and local government benefit programs with over 5.6MM cards issued US Treasury DirectExpress Program:• Exclusive provider of prepaid debit cards with a contract through January 2015• Over 2.9 million cards registered• Deposit growth reflects the phase out of checks for government benefits2:o 5/1/11 – new benefit recipientso 3/1/13 – current check recipients 28 185 290 532 650 720 866 939 2007 2008 2009 2010 2011 1Q12 2Q12 US Treasury Program State Card Programs Average Noninterest-Bearing Deposits ($ MMs)
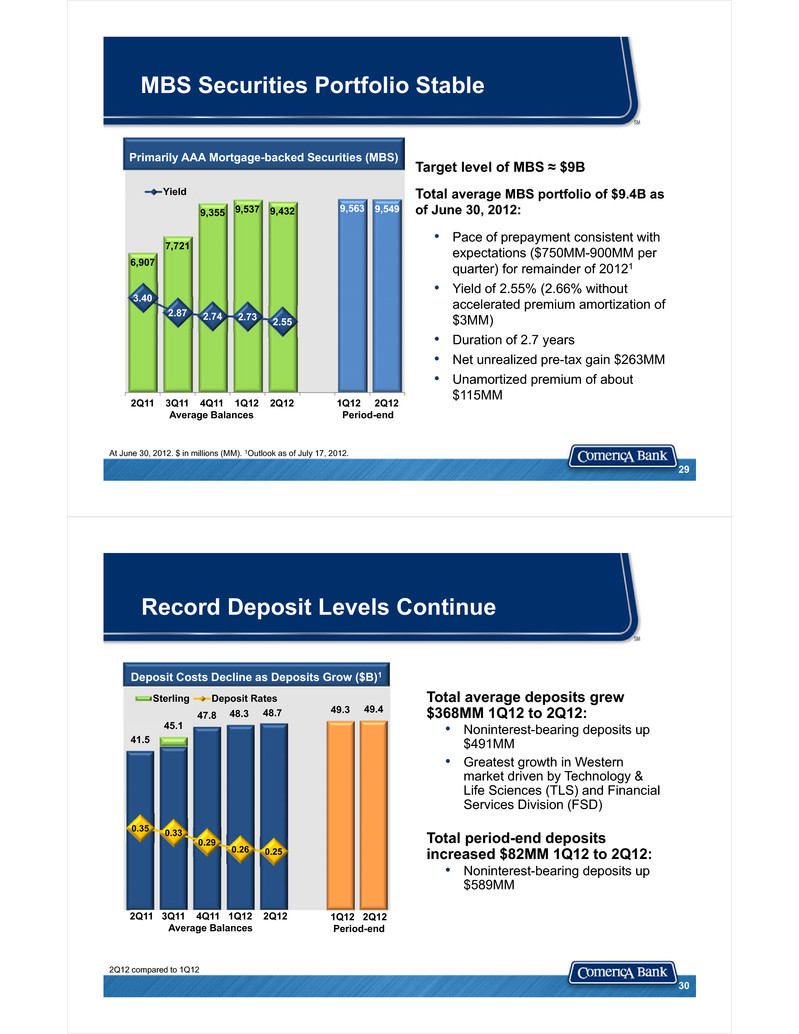
MBS Securities Portfolio Stable Target level of MBS ≈ $9B Total average MBS portfolio of $9.4B as of June 30, 2012: • Pace of prepayment consistent with expectations ($750MM-900MM per quarter) for remainder of 20121• Yield of 2.55% (2.66% without accelerated premium amortization of $3MM)• Duration of 2.7 years • Net unrealized pre-tax gain $263MM• Unamortized premium of about $115MM At June 30, 2012. $ in millions (MM). 1Outlook as of July 17, 2012. 29 6,907 7,721 9,355 9,537 9,432 9,563 9,549 3.40 2.87 2.74 2.73 2.55 2Q11 3Q11 4Q11 1Q12 2Q12 1Q12 2Q12 Yield Average Balances 1Q12 Period-end Primarily AAA Mortgage-backed Securities (MBS) Record Deposit Levels Continue 2Q12 compared to 1Q12 Total average deposits grew $368MM 1Q12 to 2Q12:• Noninterest-bearing deposits up $491MM• Greatest growth in Western market driven by Technology & Life Sciences (TLS) and Financial Services Division (FSD) Total period-end deposits increased $82MM 1Q12 to 2Q12:• Noninterest-bearing deposits up $589MM 30 41.5 45.1 47.8 48.3 48.7 49.3 49.4 0.35 0.33 0.29 0.26 0.25 Sterling Deposit Rates 2Q11 3Q11 4Q11 1Q12 2Q12Average Balances 1Q12 2Q12Period-end Deposit Costs Decline as Deposits Grow ($B)1
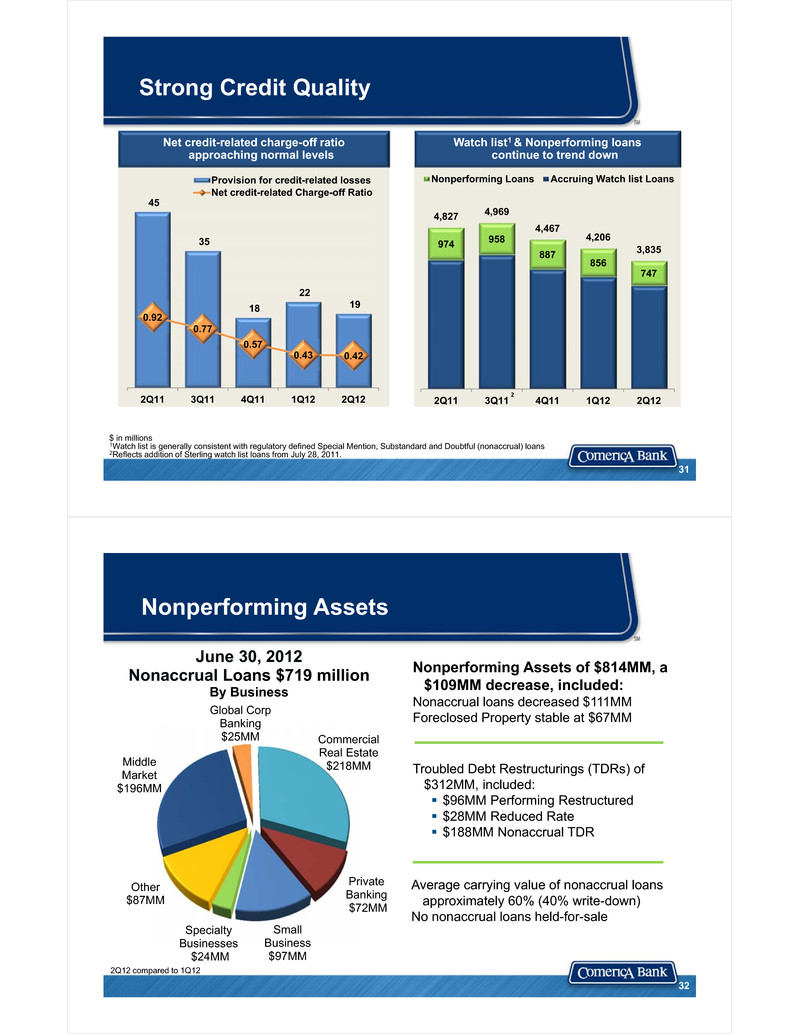
Strong Credit Quality $ in millions1Watch list is generally consistent with regulatory defined Special Mention, Substandard and Doubtful (nonaccrual) loans2Reflects addition of Sterling watch list loans from July 28, 2011. 1 31 45 35 18 22 19 0.92 0.77 0.57 0.43 0.42 2Q11 3Q11 4Q11 1Q12 2Q12 Provision for credit-related lossesNet credit-related Charge-off Ratio Net credit-related charge-off ratio approaching normal levels 974 958 887 856 747 4,827 4,969 4,467 4,206 3,835 2Q11 3Q11 4Q11 1Q12 2Q12 Nonperforming Loans Accruing Watch list Loans 2 Watch list1 & Nonperforming loans continue to trend down Average carrying value of nonaccrual loans approximately 60% (40% write-down)No nonaccrual loans held-for-sale 2Q12 compared to 1Q12 Nonperforming Assets Nonperforming Assets of $814MM, a $109MM decrease, included:Nonaccrual loans decreased $111MMForeclosed Property stable at $67MM Troubled Debt Restructurings (TDRs) of $312MM, included: $96MM Performing Restructured $28MM Reduced Rate $188MM Nonaccrual TDR June 30, 2012Nonaccrual Loans $719 millionBy Business Middle Market$196MM CommercialReal Estate$218MM Global Corp Banking$25MM Other $87MM Small Business$97MM Specialty Businesses$24MM Private Banking$72MM 32
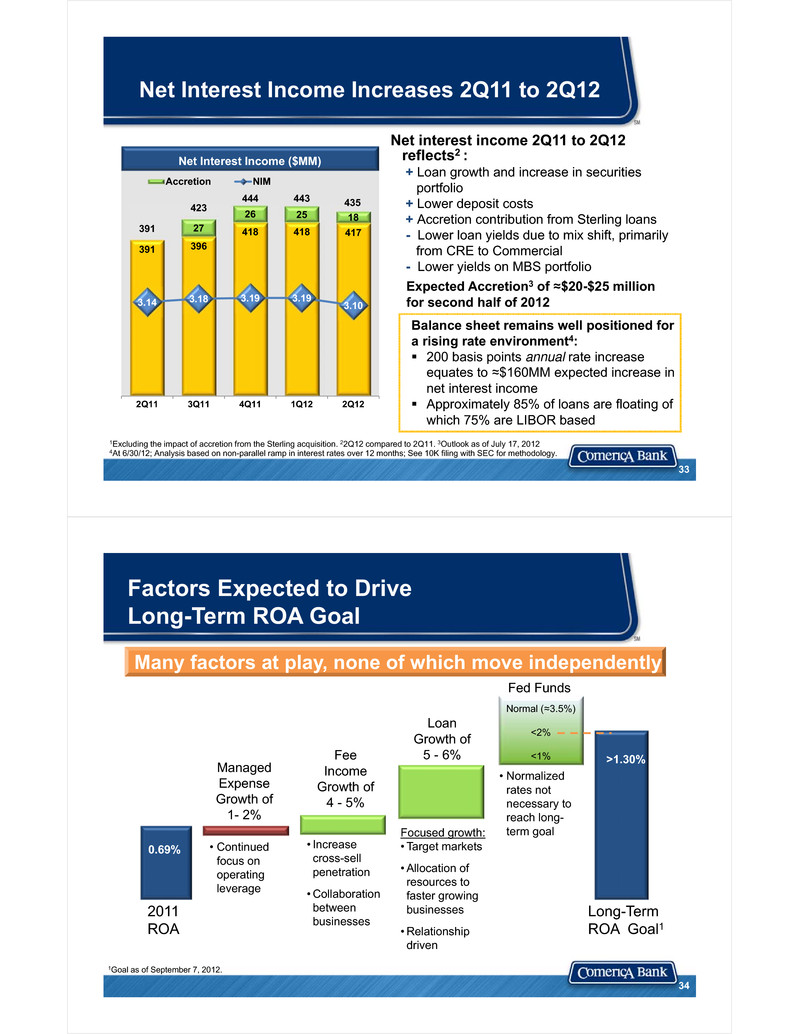
Net Interest Income Increases 2Q11 to 2Q12 1Excluding the impact of accretion from the Sterling acquisition. 22Q12 compared to 2Q11. 3Outlook as of July 17, 20124At 6/30/12; Analysis based on non-parallel ramp in interest rates over 12 months; See 10K filing with SEC for methodology. Net interest income 2Q11 to 2Q12 reflects2 :+ Loan growth and increase in securities portfolio + Lower deposit costs + Accretion contribution from Sterling loans- Lower loan yields due to mix shift, primarily from CRE to Commercial- Lower yields on MBS portfolio Balance sheet remains well positioned for a rising rate environment4: 200 basis points annual rate increase equates to ≈$160MM expected increase in net interest income Approximately 85% of loans are floating of which 75% are LIBOR based 391 396 418 418 41727 26 25 18391 423 444 443 435 3.14 3.18 3.19 3.19 3.10 2Q11 3Q11 4Q11 1Q12 2Q12 Accretion NIM Net Interest Income ($MM) 33 Expected Accretion3 of ≈$20-$25 million for second half of 2012 34 Factors Expected to DriveLong-Term ROA Goal 2011 ROA Long-Term ROA Goal1 0.69% >1.30%Managed Expense Growth of 1- 2% Fee Income Growth of 4 - 5% Loan Growth of 5 - 6% • Increase cross-sell penetration • Collaboration between businesses Focused growth:• Target markets • Allocation of resources to faster growing businesses • Relationship driven • Normalized rates not necessary to reach long-term goal Fed Funds Many factors at play, none of which move independently • Continued focus on operating leverage 1Goal as of September 7, 2012. Normal (≈3.5%) <2% <1%
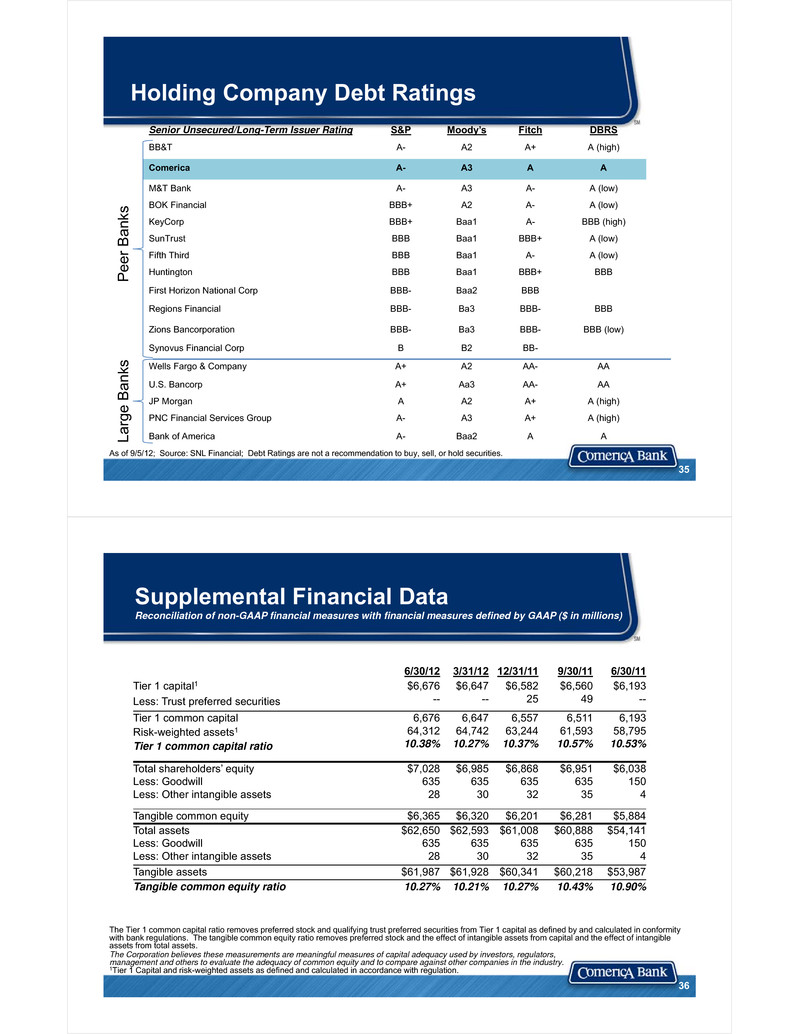
Senior Unsecured/Long-Term Issuer Rating S&P Moody’s Fitch DBRS BB&T A- A2 A+ A (high) Comerica A- A3 A A M&T Bank A- A3 A- A (low) BOK Financial BBB+ A2 A- A (low) KeyCorp BBB+ Baa1 A- BBB (high) SunTrust BBB Baa1 BBB+ A (low) Fifth Third BBB Baa1 A- A (low) Huntington BBB Baa1 BBB+ BBB First Horizon National Corp BBB- Baa2 BBB Regions Financial BBB- Ba3 BBB- BBB Zions Bancorporation BBB- Ba3 BBB- BBB (low) Synovus Financial Corp B B2 BB- Wells Fargo & Company A+ A2 AA- AA U.S. Bancorp A+ Aa3 AA- AA JP Morgan A A2 A+ A (high) PNC Financial Services Group A- A3 A+ A (high) Bank of America A- Baa2 A A Holding Company Debt Ratings As of 9/5/12; Source: SNL Financial; Debt Ratings are not a recommendation to buy, sell, or hold securities. 35 Pee r Ba nks Larg e Ba nks Supplemental Financial DataReconciliation of non-GAAP financial measures with financial measures defined by GAAP ($ in millions) The Tier 1 common capital ratio removes preferred stock and qualifying trust preferred securities from Tier 1 capital as defined by and calculated in conformity with bank regulations. The tangible common equity ratio removes preferred stock and the effect of intangible assets from capital and the effect of intangible assets from total assets.The Corporation believes these measurements are meaningful measures of capital adequacy used by investors, regulators, management and others to evaluate the adequacy of common equity and to compare against other companies in the industry.1Tier 1 Capital and risk-weighted assets as defined and calculated in accordance with regulation. 6/30/12 3/31/12 12/31/11 9/30/11 6/30/11Tier 1 capital1Less: Trust preferred securities $6,676-- $6,647-- $6,58225 $6,56049 $6,193--Tier 1 common capitalRisk-weighted assets1Tier 1 common capital ratio 6,67664,31210.38% 6,64764,74210.27% 6,55763,24410.37% 6,51161,59310.57% 6,19358,79510.53% Total shareholders’ equityLess: GoodwillLess: Other intangible assets $7,02863528 $6,98563530 $6,86863532 $6,95163535 $6,0381504 Tangible common equity $6,365 $6,320 $6,201 $6,281 $5,884Total assetsLess: GoodwillLess: Other intangible assets $62,65063528 $62,59363530 $61,00863532 $60,88863535 $54,1411504Tangible assets $61,987 $61,928 $60,341 $60,218 $53,987Tangible common equity ratio 10.27% 10.21% 10.27% 10.43% 10.90% 36
