Attached files
| file | filename |
|---|---|
| 8-K - 8-K - Addus HomeCare Corp | d407370d8k.htm |
Exhibit 99.1
Addus Dual AdvantageTM Integrated Personal & Home Health Care A pre-acute solution to the post-acute problemSM Baird’s Healthcare Conference September 6, 2012
Forward-Looking Statements The following information contains, or may be deemed to contain, forward-looking statements. By their nature, forward-looking statements involve risks and uncertainties because they relate to events and depend on circumstances that may or may not occur in the future. The future results of Addus may vary from the results expressed in, or implied by, the following forward-looking statements, possibly to a material degree, and historical results may not be an indication of future performance. For a discussion of some of the important factors that could cause Addus’ results to differ from those expressed in, or implied by, the following forward-looking statements, please refer to Addus’ most recent Annual Report on Form 10-K, and its Quarterly reports on Form 10-Q, each of which is available at www.SEC.gov, particularly the Sections entitled “Risk Factors”. Addus undertakes no obligation to update or revise any forward-looking statements, except as may be required by law.
Mission It is the primary mission of Addus HealthCare to improve the health and well being of our consumers through the provision of quality, cost-effective health care services. We will accomplish our goals by fostering an environment in which our employees enthusiastically support and advance our mission. Reward for accomplishing our mission includes pride in our organization, contribution to the community and a reasonable profit.
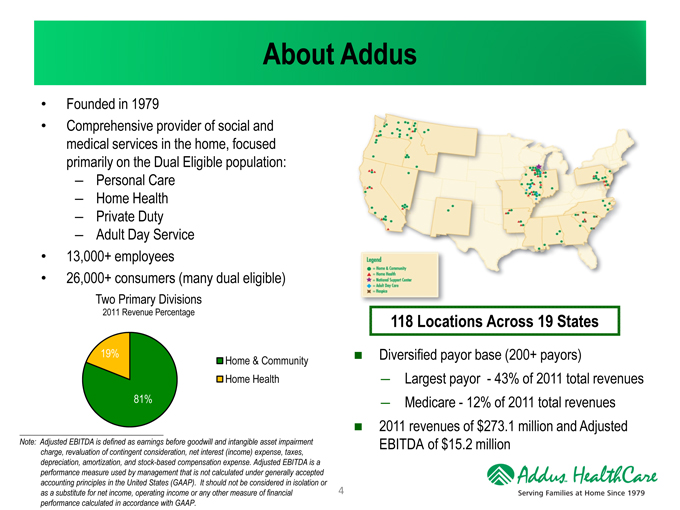
About Addus Founded in 1979 Comprehensive provider of social and medical services in the home, focused primarily on the Dual Eligible population: – Personal Care – Home Health – Private Duty – Adult Day Service 13,000+ employees 26,000+ consumers (many dual eligible) Two Primary Divisions 118 Locations Across 19 States 2011 Revenue Percentage n Diversified payor base (200+ payors) 19% Home & Community ¯ Largest payor - 43% of 2011 total revenues Home Health ¯ Medicare - 12% of 2011 total revenues 81% n 2011 revenues of $273.1 million and Adjusted EBITDA of $15.2 million Note: Adjusted EBITDA is defined as earnings before goodwill and intangible asset impairment charge, revaluation of contingent consideration, net interest (income) expense, taxes, depreciation, amortization, and stock-based compensation expense. Adjusted EBITDA is a performance measure used by management that is not calculated under generally accepted accounting principles in the United States (GAAP). It should not be considered in isolation or as a substitute for net income, operating income or any other measure of financial performance calculated in accordance with 4 GAAP.
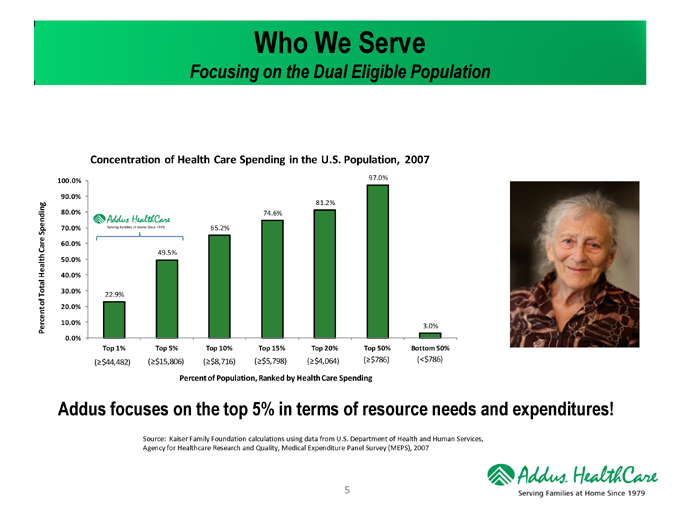
Who We Serve Focusing on the Dual Eligible Population Concentration of Health Care Spending in the U.S. Population, 2007 97.0% 100.0% 90.0% g 81.2% i n 80.0% 74.6% en d p 70.0% 65.2% S Care 60.0% 49.5% 50.0% Health 40.0% a l o t 30.0% T 22.9% f o cent 20.0% r 10.0% Pe 3.0% 0.0% Top 1% Top 5% Top 10% Top 15% Top 20% Top 50% Bottom 50% (=$44,482) (=$15,806) (=$8,716) (=$5,798) (=$4,064) (=$786) (<$786) Percentof Population, Ranked by Health Care Spending Addus focuses on the top 5% in terms of resource needs and expenditures! Source: Kaiser Family Foundation calculations using data from U.S. Department of Health and Human Services, Agency for Healthcare Research and Quality, Medical Expenditure Panel Survey (MEPS), 2007
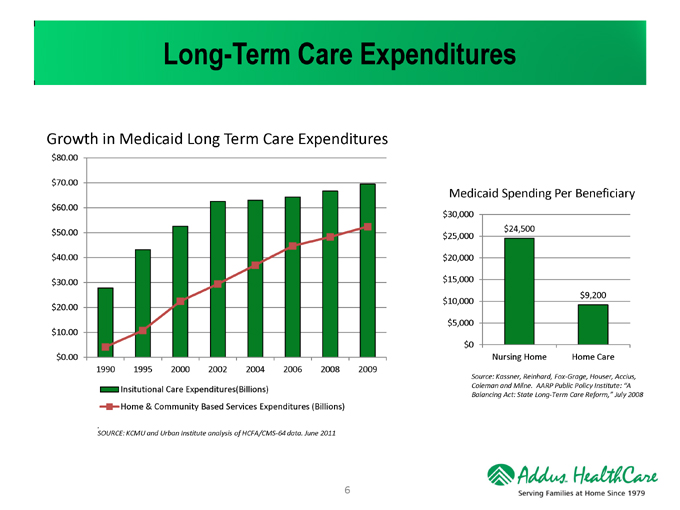
Long-Term Care Expenditures Growth in Medicaid Long Term Care Expenditures $80.00 $70.00 Medicaid Spending Per Beneficiary $60.00 $30,000 $24,500 $50.00 $25,000 $40.00 $20,000 $30.00 $15,000 $9,200 $10,000 $20.00 $5,000 $10.00 $0 $0.00 Nursing Home Home Care 1990 1995 2000 2002 2004 2006 2008 2009 Source: Kassner, Reinhard, Fox-Grage, Houser, Accius, Coleman and Milne. AARP Public Policy Institute: “A Insitutional Care Expenditures(Billions) Balancing Act: State Long-Term Care Reform,” July 2008 Home & Community Based Services Expenditures (Billions) . SOURCE: KCMU and Urban Institute analysis of HCFA/CMS-64 data. June 2011
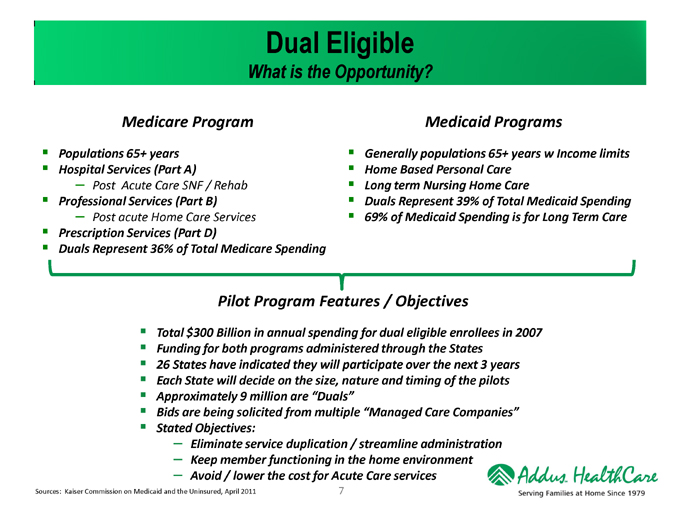
Dual Eligible What is the Opportunity? Medicare Program Medicaid Programs Populations 65+ years Generally populations 65+ years w Income limits Hospital Services (Part A) Home Based Personal Care – Post Acute Care SNF / Rehab Long term Nursing Home Care Professional Services (Part B) Duals Represent 39% of Total Medicaid Spending – Post acute Home Care Services 69% of Medicaid Spending is for Long Term Care Prescription Services (Part D) Duals Represent 36% of Total Medicare Spending Pilot Program Features / Objectives Total $300 Billion in annual spending for dual eligible enrollees in 2007 Funding for both programs administered through the States 26 States have indicated they will participate over the next 3 years Each State will decide on the size, nature and timing of the pilots Approximately 9 million are “Duals” Bids are being solicited from multiple “Managed Care Companies” Stated Objectives: – Eliminate service duplication / streamline administration – Keep member functioning in the home environment – Avoid / lower the cost for Acute Care services Sources: Kaiser Commission on Medicaid and the Uninsured, April 2011 7
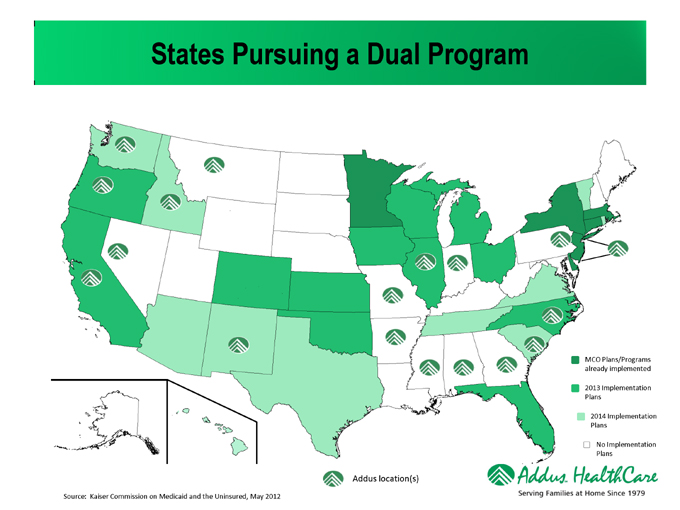
States Pursuing a Dual Program MCO Plans/Programs already implemented 2013 Implementation Plans 2014 Implementation Plans No Implementation Plans Addus location(s) Source: Kaiser Commission on Medicaid and the Uninsured, May 2012
Addus Dual AdvantageTM The New Paradigm Long-term care risk makes it essential that health plan dual eligible members live safely and healthfully at home as long as possible… 9
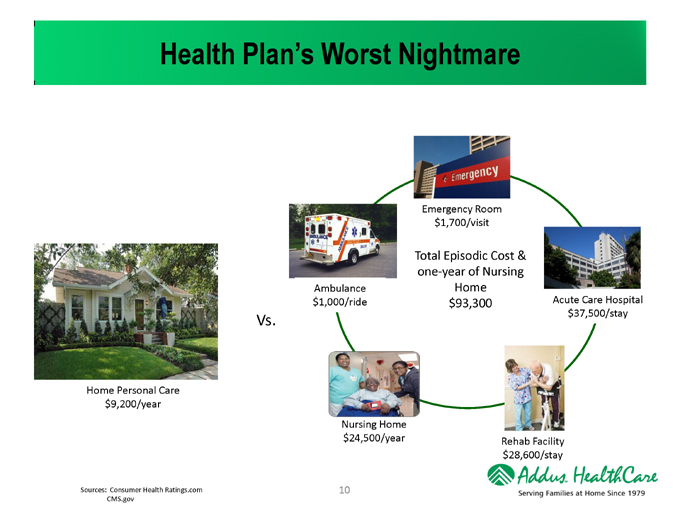
Health Plan’s Worst Nightmare Emergency Room $1,700/visit Total Episodic Cost & one-year of Nursing Ambulance Home $1,000/ride $93,300 Acute Care Hospital $37,500/stay Vs. Home Personal Care $9,200/year Nursing Home $24,500/year Rehab Facility $28,600/stay Sources: Consumer Health Ratings.com 10 CMS.gov
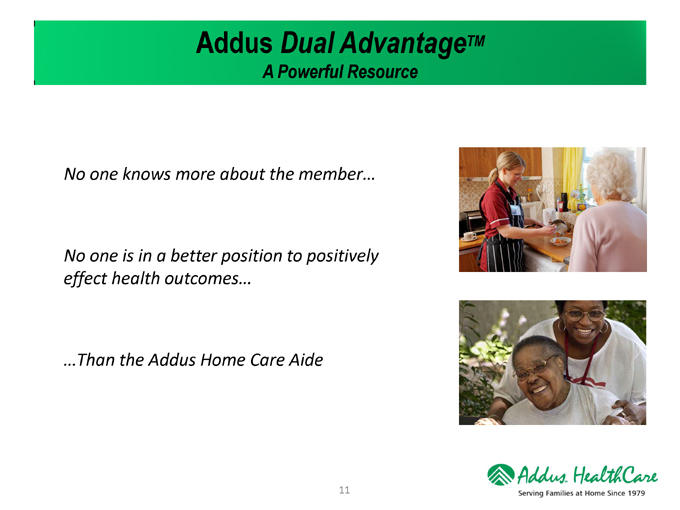
Addus Dual AdvantageTM A Powerful Resource No one knows more about the member… No one is in a better position to positively effect health outcomes… …Than the Addus Home Care Aide
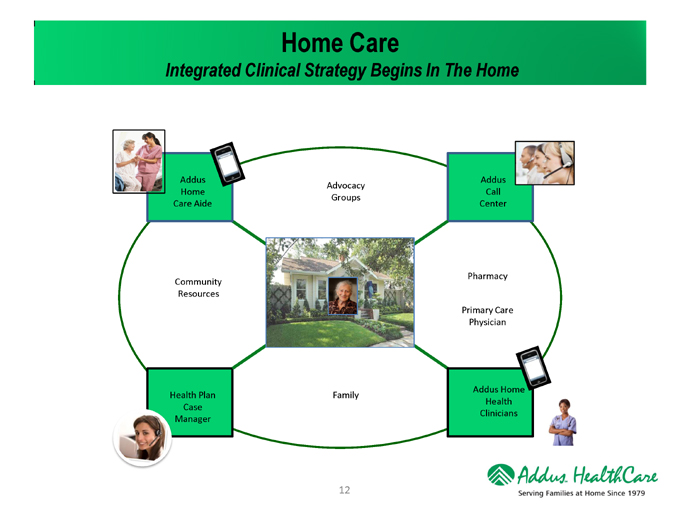
Home Care Integrated Clinical Strategy Begins In The Home Addus Addus Advocacy Home Call Groups Care Aide Center Pharmacy Community Resources Primary Care Physician Addus Hom Health Plan Family Health Case Clinicians Manager
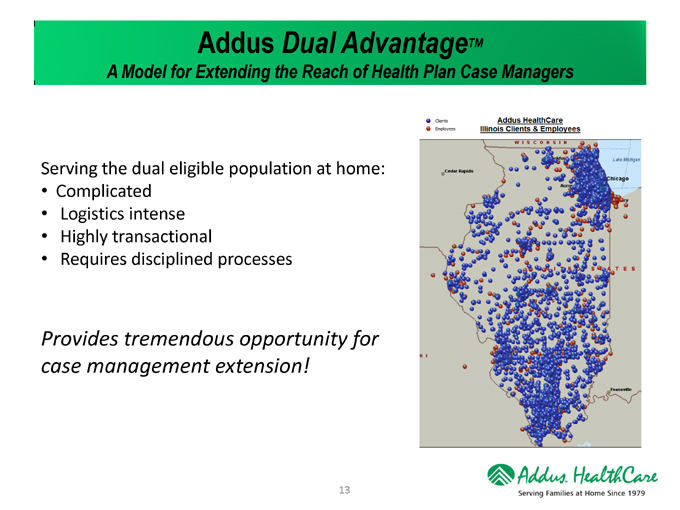
Addus Dual AdvantageTM A Model for Extending the Reach of Health Plan Case Managers Serving the dual eligible population at home: Complicated Logistics intense Highly transactional Requires disciplined processes Provides tremendous opportunity for case management extension!
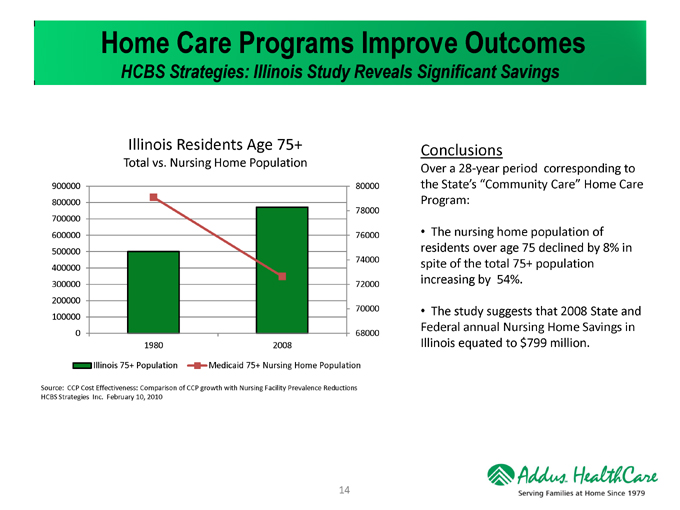
Home Care Programs Improve Outcomes HCBS Strategies: Illinois Study Reveals Significant Savings Illinois Residents Age 75+ Conclusions Total vs. Nursing Home Population Over a 28-year period corresponding to 900000 80000 the State’s “Community Care” Home Care 800000 Program: 78000 700000 600000 76000 The nursing home population of 500000 residents over age 75 declined by 8% in 74000 spite of the total 75+ population 400000 increasing by 54%. 300000 72000 200000 70000 The study suggests that 2008 State and 100000 Federal annual Nursing Home Savings in 0 68000 1980 2008 Illinois equated to $799 million. Illinois 75+ Population Medicaid 75+ Nursing Home Population Source: CCP Cost Effectiveness: Comparison of CCP growth with Nursing Facility Prevalence Reductions HCBS Strategies Inc. February 10, 2010
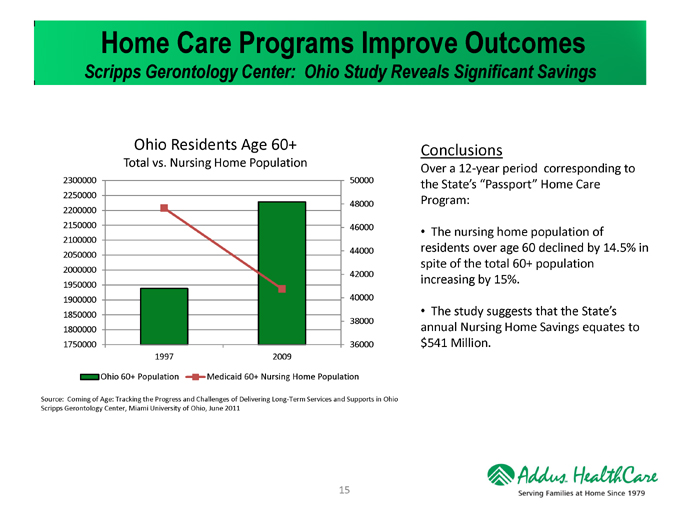
Home Care Programs Improve Outcomes Scripps Gerontology Center: Ohio Study Reveals Significant Savings Ohio Residents Age 60+ Conclusions Total vs. Nursing Home Population Over a 12-year period corresponding to 2300000 50000 the State’s “Passport” Home Care 2250000 Program: 48000 2200000 2150000 46000 2100000 The nursing home population of 44000 residents over age 60 declined by 14.5% in 2050000 spite of the total 60+ population 2000000 42000 increasing by 15%. 1950000 1900000 40000 1850000 The study suggests that the State’s 38000 1800000 annual Nursing Home Savings equates to 1750000 36000 $541 Million. 1997 2009 Ohio 60+ Population Medicaid 60+ Nursing Home Population Source: Coming of Age: Tracking the Progress and Challenges of Delivering Long-Term Services and Supports in Ohio Scripps Gerontology Center, Miami University of Ohio, June 2011
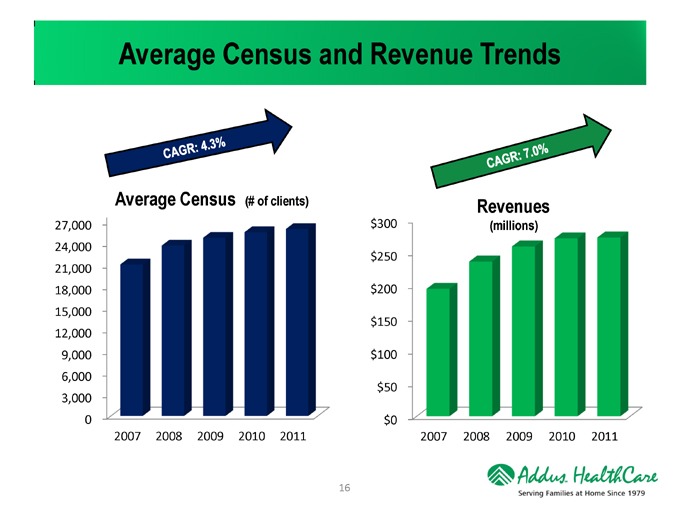
Average Census and Revenue Trends Average Census (# of clients) Revenues 27,000 $300 24,000 $250 21,000 18,000 $200 15,000 $150 12,000 9,000 $100 6,000 $50 3,000 0 $0 2007 2008 2009 2010 2011 2007 2008 2009 2010 2011
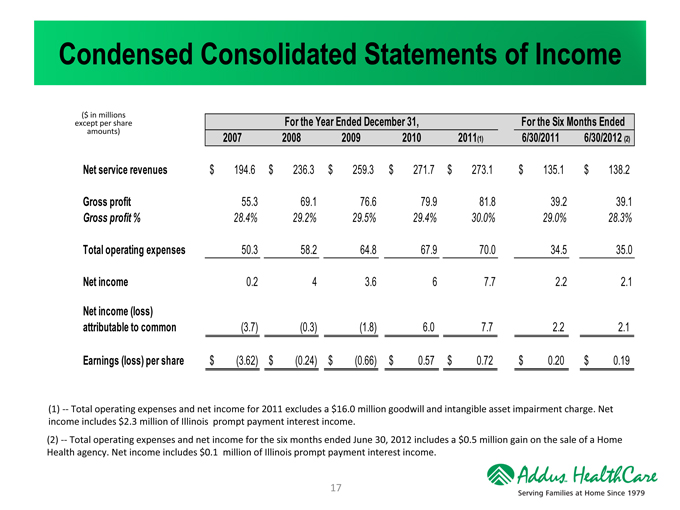
Condensed Consolidated Statements of Income ($ in millions except per share For the Year Ended December 31, For the Six Months Ended amounts) 2007 2008 2009 2010 2011(1) 6/30/2011 6/30/2012 (2) Net service revenues $ 194.6 $ 236.3 $ 259.3 $ 271.7 $ 273.1 $ 135.1 $ 138.2 Gross profit 55.3 69.1 76.6 79.9 81.8 39.2 39.1 Gross profit % 28.4% 29.2% 29.5% 29.4% 30.0% 29.0% 28.3% Total operating expenses 50.3 58.2 64.8 67.9 70.0 34.5 35.0 Net income 0.2 4 3.6 6 7.7 2.2 2.1 Net income (loss) attributable to common (3.7) (0.3) (1.8) 6.0 7.7 2.2 2.1 Earnings (loss) per share $ (3.62) $ (0.24) $ (0.66) $ 0.57 $ 0.72 $ 0.20 $ 0.19 (1) -- Total operating expenses and net income for 2011 excludes a $16.0 million goodwill and intangible asset impairment charge. Net income includes $2.3 million of Illinois prompt payment interest income. (2) -- Total operating expenses and net income for the six months ended June 30, 2012 includes a $0.5 million gain on the sale of a Home Health agency. Net income includes $0.1 million of Illinois prompt payment interest income.
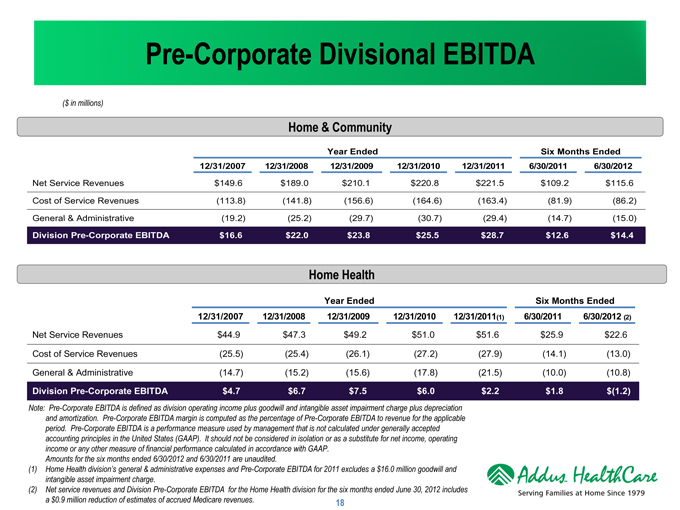
Pre-Corporate Divisional EBITDA ($ in millions) Home & Community Year Ended Six Months Ended 12/31/2007 12/31/2008 12/31/2009 12/31/2010 12/31/2011 6/30/2011 6/30/2012 Net Service Revenues $149.6 $189.0 $210.1 $220.8 $221.5 $109.2 $115.6 Cost of Service Revenues (113.8) (141.8) (156.6) (164.6) (163.4) (81.9) (86.2) General & Administrative (19.2) (25.2) (29.7) (30.7) (29.4) (14.7) (15.0) Division Pre-Corporate EBITDA $16.6 $22.0 $23.8 $25.5 $28.7 $12.6 $14.4 Home Health Year Ended Six Months Ended 12/31/2007 12/31/2008 12/31/2009 12/31/2010 12/31/2011(1) 6/30/2011 6/30/2012 (2) Net Service Revenues $44.9 $47.3 $49.2 $51.0 $51.6 $25.9 $22.6 Cost of Service Revenues (25.5) (25.4) (26.1) (27.2) (27.9) (14.1) (13.0) General & Administrative (14.7) (15.2) (15.6) (17.8) (21.5) (10.0) (10.8) Division Pre-Corporate EBITDA $4.7 $6.7 $7.5 $6.0 $2.2 $1.8 $(1.2) Note: Pre-Corporate EBITDA is defined as division operating income plus goodwill and intangible asset impairment charge plus depreciation and amortization. Pre-Corporate EBITDA margin is computed as the percentage of Pre-Corporate EBITDA to revenue for the applicable period. Pre-Corporate EBITDA is a performance measure used by management that is not calculated under generally accepted accounting principles in the United States (GAAP). It should not be considered in isolation or as a substitute for net income, operating income or any other measure of financial performance calculated in accordance with GAAP. Amounts for the six months ended 6/30/2012 and 6/30/2011 are unaudited. (1) Home Health division’s general & administrative expenses and Pre-Corporate EBITDA for 2011 excludes a $16.0 million goodwill and intangible asset impairment charge. (2) Net service revenues and Division Pre-Corporate EBITDA for the Home Health division for the six months ended June 30, 2012 includes a $0.9 million reduction of estimates of accrued Medicare revenues. 18
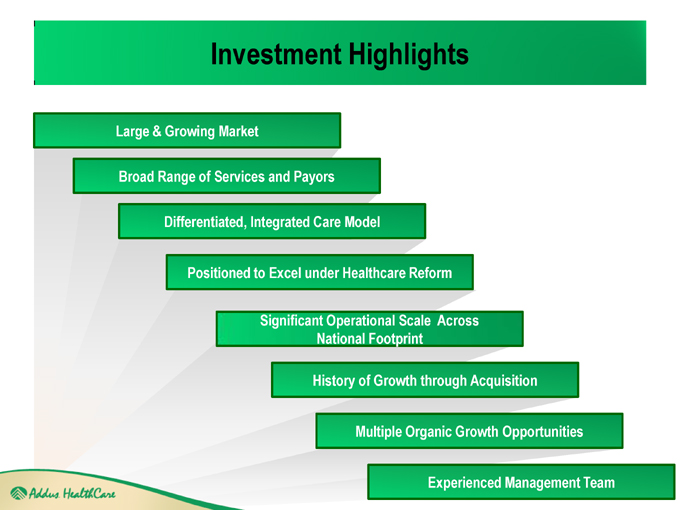
Investment Highlights Large & Growing Market Broad Range of Services and Payors Differentiated, Integrated Care Model Positioned to Excel under Healthcare Reform Significant Operational Scale Across National Footprint History of Growth through Experienced Management Team
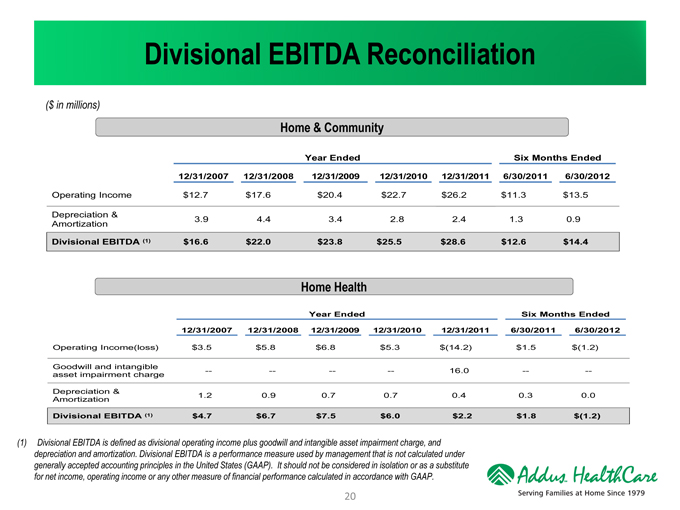
Divisional EBITDA Reconciliation ($ in millions) Home & Community Year Ended Six Months Ended 12/31/2007 12/31/2008 12/31/2009 12/31/2010 12/31/2011 6/30/2011 6/30/2012 Operating Income $12.7 $17.6 $20.4 $22.7 $26.2 $11.3 $13.5 Depreciation & 3.9 4.4 3.4 2.8 2.4 1.3 0.9 Amortization Divisional EBITDA (1) $16.6 $22.0 $23.8 $25.5 $28.6 $12.6 $14.4 Home Health Year Ended Six Months Ended 12/31/2007 12/31/2008 12/31/2009 12/31/2010 12/31/2011 6/30/2011 6/30/2012 Operating Income(loss) $3.5 $5.8 $6.8 $5.3 $(14.2) $1.5 $(1.2) Goodwill and intangible - 16.0 asset impairment charge Depreciation & 1.2 0.9 0.7 0.7 0.4 0.3 0.0 Amortization Divisional EBITDA (1) $4.7 $6.7 $7.5 $6.0 $2.2 $1.8 $(1.2) (1) Divisional EBITDA is defined as divisional operating income plus goodwill and intangible asset impairment charge, and depreciation and amortization. Divisional EBITDA is a performance measure used by management that is not calculated under generally accepted accounting principles in the United States (GAAP). It should not be considered in isolation or as a substitute for net income, operating income or any other measure of financial performance calculated in accordance with GAAP. 2 0