Attached files
| file | filename |
|---|---|
| 8-K - FORM8K - PPL Corp | form8k.htm |

©PPL Corporation 2012
Barclays CEO Energy-Power
Conference
Conference
September 6, 2012
©PPL Corporation 2012
Exhibit 99.1

©PPL Corporation 2012
2
Cautionary Statements and Factors
That May Affect Future Results
That May Affect Future Results
Any statements made in this presentation about future
operating results or other future events are forward-looking
statements under the Safe Harbor Provisions of the Private
Securities Litigation Reform Act of 1995. Actual results may
differ materially from such forward-looking statements. A
discussion of factors that could cause actual results or events
to vary is contained in the Appendix to this presentation and
in the Company’s SEC filings.

©PPL Corporation 2012
3
PPL Well-Positioned for Future Success
Rate-regulated business provides earnings and dividend stability in weak
economic environment
economic environment
Approximately 70% of projected 2012 EPS from regulated businesses
Substantial organic growth in rate base: ~8% CAGR from 2012-2016
Business Risk Profile rated “Excellent” by S&P
Secure dividend with strong platform for continued growth
Highly attractive competitive generation fleet with diverse fuel mix allows
for significant upside when power markets recover
for significant upside when power markets recover
Strong baseload footprint in PJM complemented by flexible gas-fired units
No major exposure to currently proposed environmental regulations
Strong management team with track record of execution
U.K. team best-in-class among U.K. peers
ECR approval received in Kentucky
Successfully hedging competitive generation and locking in margins in a challenging
market
market

©PPL Corporation 2012
4
U.K. Regulated Segment
Investment Highlights
Investment Highlights
Highly attractive rate-regulated business with significant growth
prospects
prospects
Regulator-approved 5-year forward-looking revenues based on future business plan,
including capital expenditures and O&M plus adjustments for inflation
including capital expenditures and O&M plus adjustments for inflation
Real-time return of and return on capital investment - no lag
No volumetric risk
Additional incentives for operational efficiency and high-quality service
Top performing electricity distribution business in the U.K.
Leader in capital and operating cost efficiency, customer service and reliability
Over $380 million in incentive revenues earned over past 7 years
Highest percentage of bonus revenue among peers
Best-in-class U.K. management team
Experienced team with record of delivering results
Completely transformed acquired Midlands operation in 9 months
Strong potential to earn additional incentive revenues
Awarded Customer Service Excellence Standard
Consistent pattern of dividend repatriation to U.S. parent
©PPL Corporation 2012
5
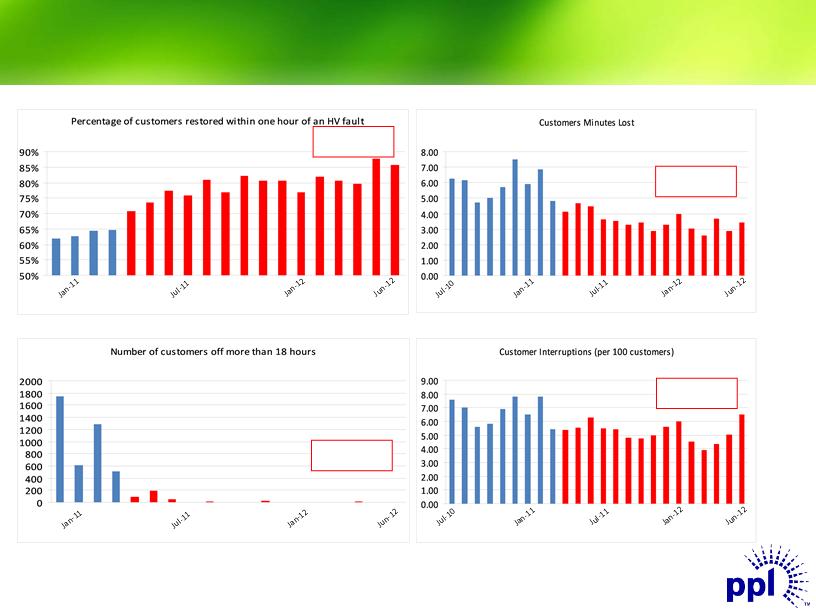
Midlands Integration - Improved
Network Performance
Network Performance
Customer Minutes Lost
Customer Interruptions (per 100 customers)
25.9%
Improvement
Improvement
39.7%
Improvement
Improvement
96%
Improvement
Improvement
21.6%
Improvement
Improvement
18 Hour Standard
Target 60

©PPL Corporation 2012
6
U.K. Regulatory Framework Change
|
|
DPCR5
|
RIIO-ED1
|
|
Revenue
Determination |
RPI - X
(cost efficiency model)
|
RIIO
(Revenue = Incentives +
Innovation + Outputs) |
|
Price Control Period
|
5 years
|
8 years
|
|
Financeability
|
WACC
(fixed for price control period)
|
WACC
(annual debt adjustments based
on iBoxx 10+ year index) |
|
Recovery Period
|
20 years
|
20 years, existing assets; 45
years, new assets |
|
Incentives
|
Rewards / Penalties for output
delivery |
Rewards / Penalties for output
delivery |
|
Innovation
|
Low Carbon Network (LCN)
Fund |
LCN Fund supplemented
|
|
Stakeholders
|
Customer Engagement
|
Expanded Stakeholder
Engagement |

©PPL Corporation 2012
7
Ofgem 2012 Initial Proposal Comparison
|
|
Electricity
Transmission (RIIO-T1) |
Gas
Transmission (RIIO-T1) |
Gas
Distribution (RIIO-GD1) |
Electricity
Distribution (DPCR5) |
|
Price Control Period
|
8 years
(1 April 2013 - 2021)
|
8 years
(1 April 2013 - 2021)
|
8 years
(1 April 2013 - 2021)
|
5 years
(1 April 2010 - 2015)
|
|
WACC (real):
Cost of debt (pre-tax)
Cost of equity
Gearing (leverage)
“Vanilla” WACC
|
3.0%
7.0%
60%
4.6%
|
3.0%
6.8%
62.5%
4.4%
|
3.0%
6.7%
65%
4.3%
|
3.6%
6.7%
65%
4.7% (4.3% with
3.0% debt cost) |
|
Recovery Period
|
20 years, existing
assets; 45 years, new assets |
45 years
(no change)
|
45 years; new
assets front-end loaded |
20 years
|
|
Incentives
|
Rewards /
Penalties for output delivery |
Rewards /
Penalties for output delivery |
Rewards /
Penalties for output delivery |
Rewards /
Penalties for output delivery |
|
Innovation
|
Low Carbon
Network Fund equivalent |
Low Carbon
Network Fund equivalent |
Low Carbon
Network Fund equivalent |
Low Carbon
Network Fund |

©PPL Corporation 2012
8
Kentucky Regulated Segment
Investment Highlights
Investment Highlights
Efficient, well-run utility focused on safety, reliability and customer
service
service
Projected rate base CAGR of 9.6% through 2016
Constructive regulatory environment that provides a timely return on a
substantial amount of planned capex over the next 5 years
substantial amount of planned capex over the next 5 years
Environmental Cost Recovery (ECR): ~$2.3 billion plan approved by the KPSC with a
10.1% ROE; ~$500 million remaining under prior plan at 10.63% ROE - virtually no
regulatory lag
10.1% ROE; ~$500 million remaining under prior plan at 10.63% ROE - virtually no
regulatory lag
Other supportive recovery mechanisms include Construction Work In Process, Fuel
Adjustment Clause, Gas Supply Clause Adjustment and Demand Side Management
recovery
Adjustment Clause, Gas Supply Clause Adjustment and Demand Side Management
recovery
Very competitive retail rates that attract energy-intensive businesses

©PPL Corporation 2012
9
Pennsylvania Regulated Segment
Investment Highlights
Investment Highlights
Significant growth in transmission portion of business which earns a
favorable rate of return on a near real-time basis
favorable rate of return on a near real-time basis
CAGR of 22.3% in transmission rate base through 2016 driven by initiatives to
improve aging infrastructure
improve aging infrastructure
ROE of 11.68% earned through FERC Formula Rate Mechanism
ROE of 12.93% and return on CWIP for $560 million Susquehanna-Roseland project
Pending FERC request for 100 basis point incentive and return on CWIP for $200
million Northeast Pocono project
million Northeast Pocono project
Projected CAGR of 6.5% in distribution rate base through 2016 driven
by reliability initiatives
by reliability initiatives
Act 11 - Alternative ratemaking legislation provides for more timely
recovery of eligible distribution plant costs that improve and maintain
safety and reliability
recovery of eligible distribution plant costs that improve and maintain
safety and reliability

©PPL Corporation 2012
10
Supply Segment
Investment Highlights
Investment Highlights
Very well-positioned competitive generation
PJM assets:
Low marginal cost nuclear and hydro facilities
Efficient supercritical coal units with fuel switching optionality
Attractive gas-fired assets that capture market opportunity and back-stop base load unit availability
Montana assets:
Low marginal cost coal and hydro units that are critical to infrastructure supporting load in the Northwest
Considerable upside from potential expansion of export capability to Alberta and the Dakotas in support of
rapidly growing unconventional oil production activities
rapidly growing unconventional oil production activities
Substantially in compliance with new emissions standards without further major
investments
investments
Generation fleet will benefit from multiple factors
Tightening reserve margins
Forced retirement of less efficient stations due to tightening emissions standards
Firming of demand driven by general economic recovery
General firming of natural gas prices
Among the strongest forward hedge profiles in industry
Wholesale generation increasingly augmented by growing competitive retail
activities across commercial, industrial and residential customer classes
activities across commercial, industrial and residential customer classes
©PPL Corporation 2012
11
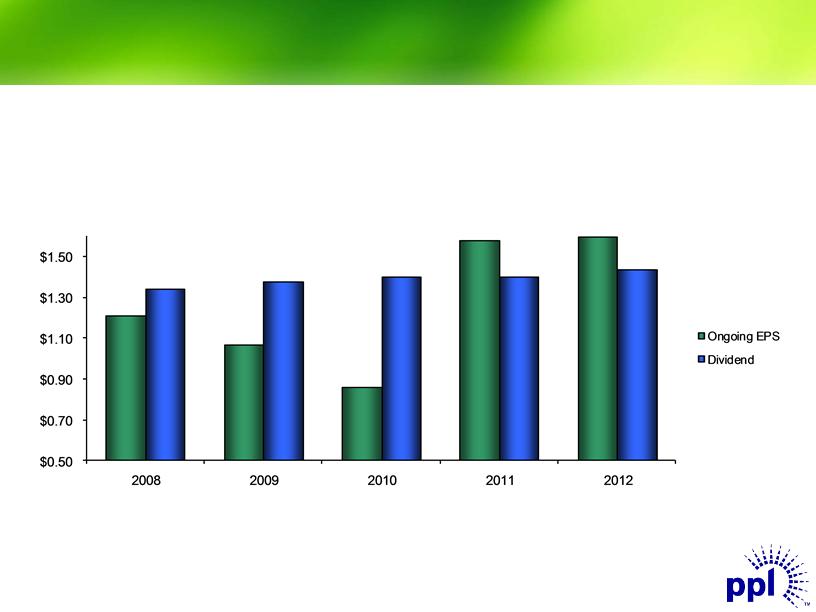
Dividend Profile
A significantly more rate-regulated business mix provides strong
support for current dividend and a platform for future growth
support for current dividend and a platform for future growth
(1) Ongoing EPS based on mid-point of forecast. Annualized dividend based on 2nd quarter declaration. Actual dividends to be determined by Board of Directors.
(2) From only regulated segments.
$/Share
Annualized
(2)
(1)

©PPL Corporation 2012
12
Appendix
©PPL Corporation 2012
13
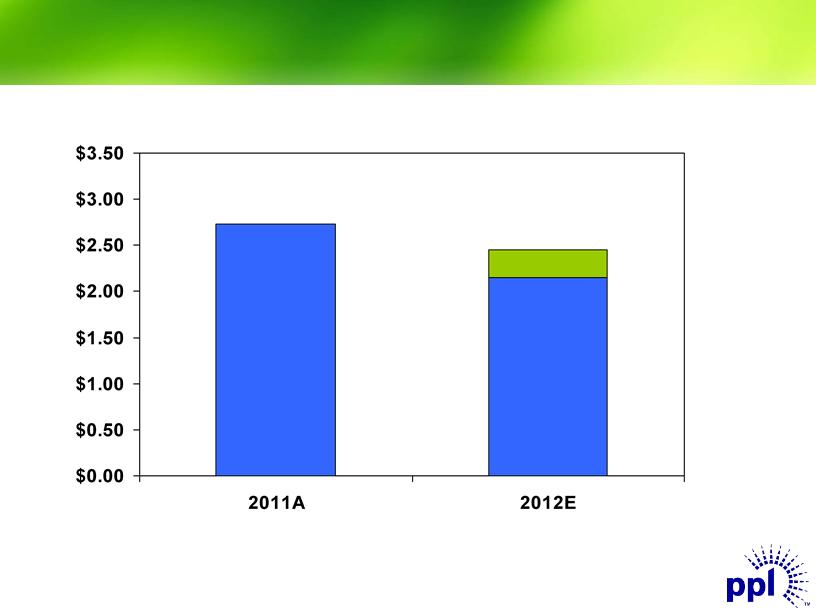
Reaffirmed 2012 Ongoing Earnings Forecast
$2.73
$/Share
Note: See Appendix for the reconciliation of earnings from ongoing operations to reported earnings.
$2.45
$2.15

©PPL Corporation 2012
14
U.K. Electricity Distribution Price Control Review
|
RIIO-ED1 Tentative Schedule
|
|
|
Provisional Timing
|
Milestone
|
|
September 2012
|
Publication of Strategy Consultation
|
|
February 2013
|
Publication of Strategy Decision
|
|
End May 2013
|
DNOs submit business plans
|
|
September 2013
|
Publication of Initial Assessment of companies business plans
|
|
November 2013
|
Publication of Fast Track Proposals
|
|
March 2014
|
Publication of Fast Track Decision
|
|
June 2014
|
Publication of Initial Proposals Consultation for non fast tracked companies
|
|
November 2014
|
Publication of Final Proposals for non fast tracked companies
|
|
December 2014
|
Issue statutory consultation on new license conditions
|
|
April 1, 2015
|
Price control commences
|
Source: Ofgem Press Release dated February 6, 2012

©PPL Corporation 2012
15
LG&E and KU Rate Case Facts
Complete filings available at www.lge-ku.com/regulatory.asp
(1) Represents total utility capitalization
|
|
LG&E
|
KU
|
|
|
|
Electric
|
Gas
|
Electric
|
|
Revenue Increase Requested
|
$62.1 million
|
$17.2 million
|
$82.4 million
|
|
Test Year
|
12-months ended
3/31/2012 |
12-months ended
3/31/2012 |
12-months ended
3/31/2012 |
|
Requested ROE
|
11.00%
|
11.00%
|
11.00%
|
|
Rate Base (1)
|
$1.97 billion
|
$0.52 billion
|
$3.98 billion
|
|
Common Equity Ratio
|
55.64%
|
55.64%
|
53.74%
|
|
1% Change in ROE =
|
~$18 million in
revenue |
~$5 million in
revenue |
~$28 million in
revenue |
|
Docket No.
|
2012-00222
|
2012-00222
|
2012-00221
|

©PPL Corporation 2012
16
LG&E and KU Rate Case Schedules
1st Request for information received July 31, 2012
LG&E and KU responses filed August 14, 2012
Supplemental request for information received August 28, 2012
LG&E and KU responses filed September 12, 2012
Intervenor testimony filed September 25, 2012
Request to intervenors submitted October 9, 2012
Intervenor responses filed October 22, 2012
LG&E/KU rebuttal testimony filed November 5, 2012
Public meetings across the state TBD
Public hearing in Frankfort TBD
Order issued (tentative) Early January 2013
New rates effective January 2013
Completed
P
P
P
P

©PPL Corporation 2012
17
PPL Electric Utilities Distribution Rate Case Facts
Distribution Revenue Increase Requested $104.6 million
Test Year 2012
Requested ROE 11.25%
2012 Distribution Rate Base $2.42 billion
2012 Common Equity Ratio 51.03%
1% Change in ROE = ~$23 million in revenue
Docket No. R-2012-2290597
Complete filing available at www.pplelectric.com/rateinfo

©PPL Corporation 2012
18
PPL Electric Utilities Distribution Rate Case Schedule
Completed
P
P
Direct testimony of other parties June 22, 2012
Rebuttal testimony July 16, 2012
Sur-rebuttal testimony August 1, 2012
Evidentiary hearings August 6, 7, 9 and 10, 2012
Close of record August 10, 2012
Main briefs August 29, 2012
Reply briefs September 14, 2012
Recommended Decision October 2012
Order issued (tentative) Mid-December 2012
New rates effective January 2013
P
P
P
P
P
©PPL Corporation 2012
19
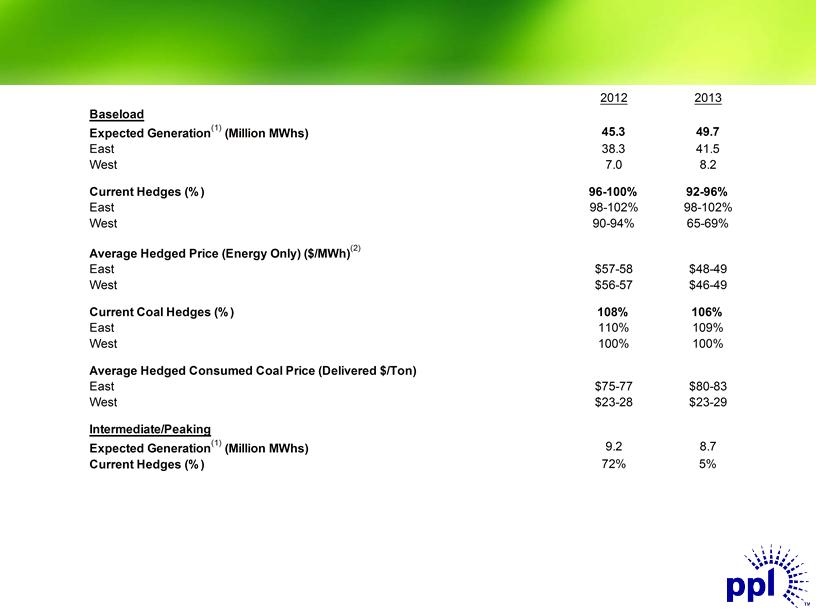
Enhancing Value Through Active Hedging
Capacity revenues are expected to be $385 million and $590 million for 2012 and 2013, respectively.
As of June 30, 2012
(1) Represents expected sales of Supply segment based on current business plan assumptions.
(2) The 2013 ranges of average energy prices for existing hedges were estimated by determining the impact on the existing collars resulting from 2013 power prices at the 5th and 95th
percentile confidence levels.
Enhancing Value Through Active Hedging Enhancing Value Through Active Hedging 2012 2013 Baseload Expected Generation(1) (Million MWhs) 45.3 49.7 East 38.3 41.5 West 7.0 8.2 Current Hedges ( % ) 96- 100% 92- 96% East 98- 102% 98- 102% West 90- 94% 65- 69% Average Hedged Price ( Energy Only) ( $ /MWh) (2) East $57-58 $48-49 West $56-57 $46-49 Current Coal Hedges ( % ) 108% 106% East 110% 109% West 100% 100% Average Hedged Consumed Coal Price ( Delivered $ /Ton) East $75-77 $80-83 West $23-28 $23-29 Intermediate/Peaking Expected Generation(1) (Million MWhs) 9.2 8.7 Current Hedges ( % ) 72% 5% Capacity revenues are expected to be $385 million and $590 million for 2012 and 2013, respectively. As of June 30, 2012 (1) Represents expected sales of Supply segment based on current business plan assumptions. (2) The 2013 ranges of average energy prices for existing hedges were estimated by determining the impact on the existing collars resulting from 2013 power prices at the 5th and 95th percentile confidence levels. ©PPL Corporation 2012 19
©PPL Corporation 2012
20
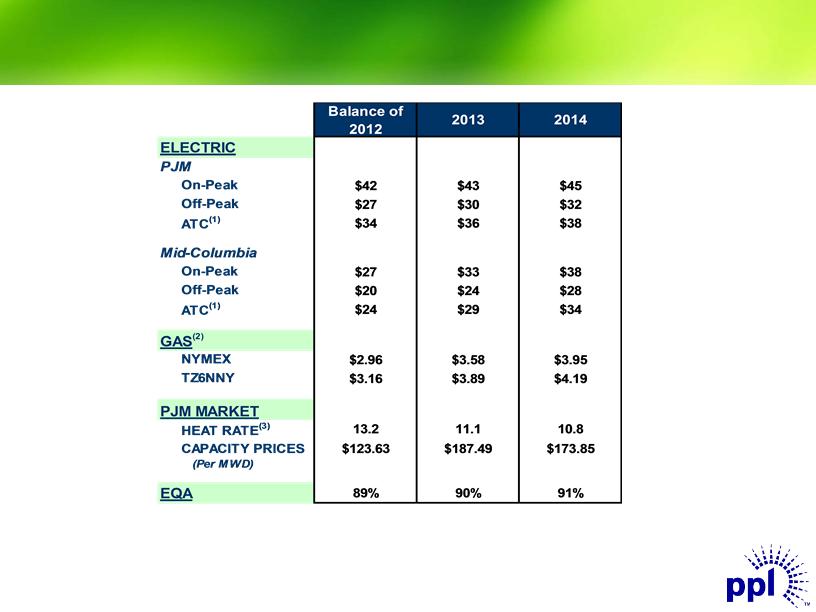
Market Prices
|
(1)
|
24-hour average.
|
|
(2)
|
NYMEX and TZ6NNY forward gas prices on 6/30/2012.
|
|
(3)
|
Market Heat Rate = PJM on-peak power price divided by TZ6NNY gas price.
|
Market Prices Balance of 2012 2013 2014 ELECTRIC PJM On-Peak Off-Peak ATC(1) Mid- Columbia On-Peak Off-Peak ATC(1) GAS(2) NYMEX TZ6NNY PJM MARKET HEAT RATE(3) CAPACITY PRICES (Per MWD) EQA (1) 24-hour average. $42 $43 $45 $27 $30 $32 $34 $36 $38 $27 $33 $38 $20 $24 $28 $24 $29 $34 $2.96 $3.58 $3.95 $3.16 $3.89 $4.19 13.2 11.1 10.8 $123.63 $187.49 $173.85 89% 90% 91% ©PPL Corporation 2012 20 (2) NYMEX and TZ6NNY forward gas prices on 6/30/2012. (3) Market Heat Rate = PJM on-peak power price divided by TZ6NNY gas price.
©PPL Corporation 2012
21
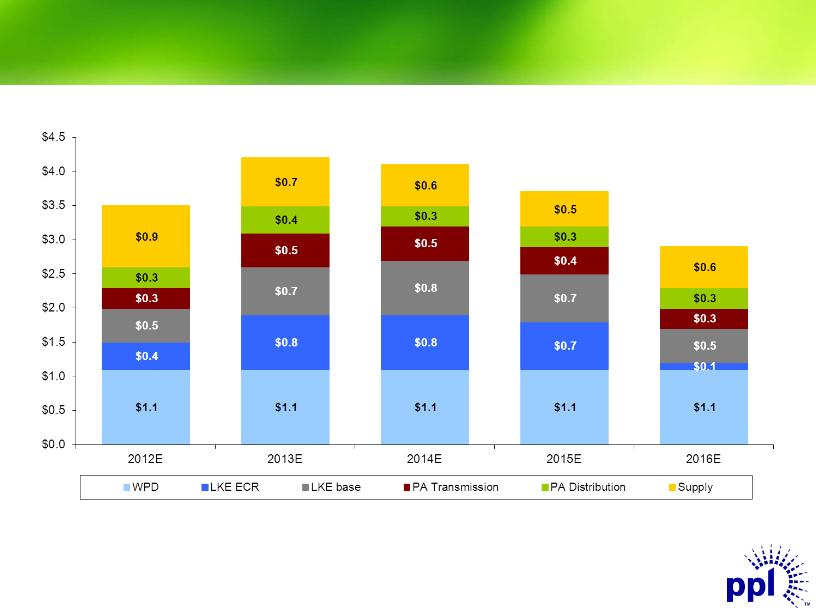
Capital Expenditures
($ in billions)
(1) Includes capex for WPD Midlands. Figures based on assumed exchange rate of $1.57 / GBP.
(2) Expect between 80% and 90% to receive timely returns via ECR mechanism based on historical experience and future projections.
(1)
(2)
$3.5
$4.2
$4.1
$3.7
$2.9

©PPL Corporation 2012
22
Projected Regulated Rate Base Growth
($ in billions)
(1) Represents capitalization for LKE, as LG&E and KU rate constructs are based on capitalization. Represents Regulatory Asset Value (RAV) for WPD.
(2) Includes RAV for WPD Midlands. Figures based on assumed exchange rate of $1.57 / GBP and are as of year-end December 31.
$18.7
$21.3
$23.5
$25.2
(2)
2012E - 2016E Regulatory Asset Base(1) CAGR: 7.9%
$17.6
$25.8
©PPL Corporation 2012
23
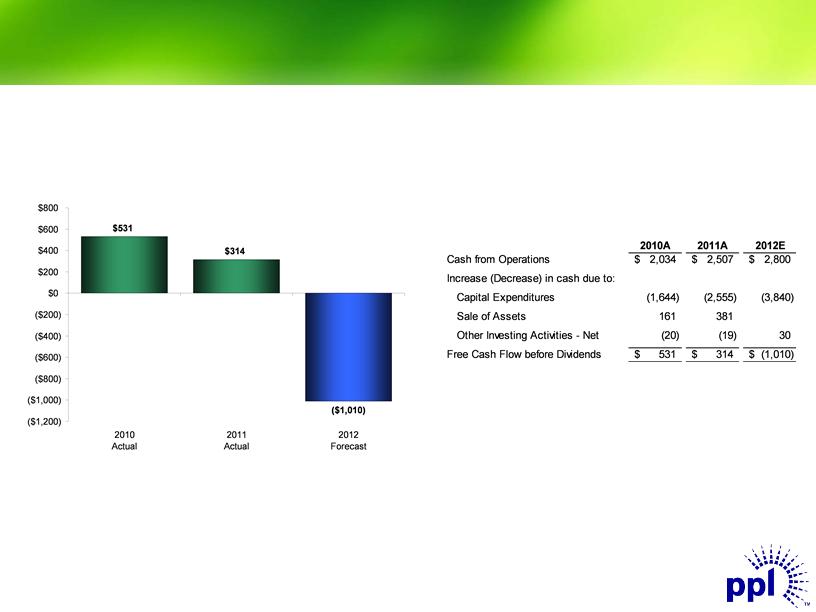
Free Cash Flow before Dividends
Free Cash Flow before
Dividends
Dividends
(Millions of Dollars)
(1) 2010 Free Cash Flow includes two months of the results of the Kentucky Regulated segment.
(1)
Reconciliation of Cash from
Operations to Free Cash Flow
before Dividends
Operations to Free Cash Flow
before Dividends
(Millions of dollars)
Free Cash Flow before Dividends Free Cash Flow before Dividends Free Cash Flow before Reconciliation of Cash from Dividends Operations to Free Cash Flow before Dividends (Millions of Dollars) (Millions of dollars) $531 $314 ( $ 1,010) ( $1,200) ( $1,000) ( $800) ( $600) ( $400) ( $200) $0 $200 $400 $600 $800 2010A 2011A 2012E Cash from Operations $ 2,034 $ 2,507 $ 2,800 Increase ( Decrease) in cash due to: Capital Expenditures ( 1,644) (2,555) (3,840) Sale of Assets 161 381 Other Investing Activities - Net ( 20) (19) 30 Free Cash Flow before Dividends $ 531 $ 314 $ (1,010) 2010 2011 2012 (1) Actual Actual Forecast (1) 2010 Free Cash Flow includes two months of the results of the Kentucky Regulated segment. ©PPL Corporation 2012 23

©PPL Corporation 2012
24
Debt Maturities
Note: As of June 30, 2012
(1) Excludes $99 million of senior notes due 2047, for which PPL Capital Funding gave notice in July 2012 of its election
to redeem at par in August 2012.
(2) Excludes $1.15 billion of junior subordinated notes due 2018 that are a component of PPL’s 2010 Equity Units and may
be put back to PPL Capital Funding if the remarketing in 2013 is not successful.
(3) Excludes $978 million of junior subordinated notes due 2019 that are a component of PPL’s 2011 Equity Units and
may be put back to PPL Capital Funding if the remarketing in 2014 is not successful.
(4) Bonds defeased in substance in 2008 by depositing sufficient funds with the trustee.
(5) Represents REset Put Securities due 2035 that are required to be put by the holders in October 2015 either for (a)
purchase and remarketing by a remarketing dealer or (b) repurchase by PPL Energy Supply.
Debt Maturities ( Millions) PPL Capital Funding LG& E and KU Energy ( Holding Co LKE) Louisville Gas & Electric Kentucky Utilities PPL Electric Utilities PPL Energy Supply WPD 2012 $0 (1) 0 0 0 0 6 0 2013 $0 0 0 0 0 751 0 (2) 2014 $0 (3) 0 0 0 10 (4) 318 0 2015 $0 400 250 250 100 317 (5) 0 2016 $ 0 0 0 0 0 368 460 Total $6 $751 $328 $1,317 $828 Note: As of June 30, 2012 (1) Excludes $99 million of senior notes due 2047, for which PPL Capital Funding gave notice in July 2012 of its election to redeem at par in August 2012. (2) Excludes $1.15 billion of junior subordinated notes due 2018 that are a component of PPL’s 2010 Equity Units and may be put back to PPL Capital Funding if the remarketing in 2013 is not successful. (3) Excludes $978 million of junior subordinated notes due 2019 that are a component of PPL’s 2011 Equity Units and may be put back to PPL Capital Funding if the remarketing in 2014 is not successful. (4) Bonds defeased in substance in 2008 by depositing sufficient funds with the trustee. (5) Represents REset Put Securities due 2035 that are required to be put by the holders in October 2015 either for (a) purchase and remarketing by a remarketing dealer or (b) repurchase by PPL Energy Supply. ©PPL Corporation 2012 24
©PPL Corporation 2012
25
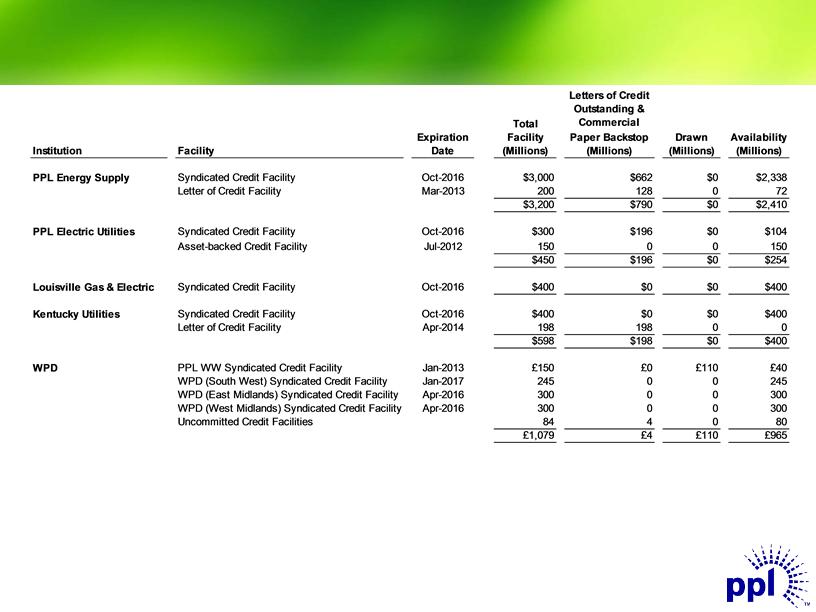
Liquidity Profile
(1)
Note: As of June 30, 2012
• Credit facilities consist of a diverse bank group, with no bank and its affiliates providing an aggregate commitment of more than
9% of the total committed capacity for the domestic facilities and 16% of the total committed capacity for WPD’s facilities.
9% of the total committed capacity for the domestic facilities and 16% of the total committed capacity for WPD’s facilities.
(1) In July 2012, PPL Energy Supply entered into a $100 million uncommitted letter of credit facility agreement with BBVA that expires
in July 2015.
in July 2015.
(2) In July 2012, PPL Electric Utilities reduced the capacity of the asset-backed credit facility to $100 million and extended the
expiration date to September 24, 2012.
expiration date to September 24, 2012.
(2)
Liquidity Profile Liquidity Profile Total Expiration Facility Drawn Availability Institution Facility Date (Millions) (Millions) (Millions) Letters of Credit Outstanding & Commercial Paper Backstop (Millions) PPL Energy Supply (1) Syndicated Credit Facility Oct-2016 $3,000 $662 $ 0 $2,338 Letter of Credit Facility Mar- 2013 200 128 0 72 $ 3,200 $790 $0 $2,410 PPL Electric Utilities Syndicated Credit Facility Oct-2016 $300 $196 $ 0 $104 Asset- backed Credit Facility (2) Jul-2012 150 0 0 150 $ 450 $196 $0 $254 Louisville Gas & Electric Syndicated Credit Facility Oct-2016 $400 $ 0 $ 0 $400 Kentucky Utilities Syndicated Credit Facility Oct-2016 $400 $ 0 $ 0 $400 Letter of Credit Facility Apr- 2014 198 198 0 0 $ 598 $198 $0 $400 WPD PPL WW Syndicated Credit Facility Jan-2013 £ 150 £0 £110 £ 40 WPD (South West) Syndicated Credit Facility Jan-2017 245 0 0 245 WPD (East Midlands) Syndicated Credit Facility Apr-2016 300 0 0 300 WPD ( West Midlands) Syndicated Credit Facility Apr-2016 300 0 0 300 Uncommitted Credit Facilities 84 4 0 80 £ 1,079 £4 £110 £965 Note: As of June 30, 2012 • Credit facilities consist of a diverse bank group, with no bank and its affiliates providing an aggregate commitment of more than 9% of the total committed capacity for the domestic facilities and 16% of the total committed capacity for WPD’s facilities. (1) In July 2012, PPL Energy Supply entered into a $100 million uncommitted letter of credit facility agreement with BBVA that expires in July 2015. (2) In July 2012, PPL Electric Utilities reduced the capacity of the asset-backed credit facility to $100 million and extended the expiration date to September 24, 2012. ©PPL Corporation 2012 25
©PPL Corporation 2012
26
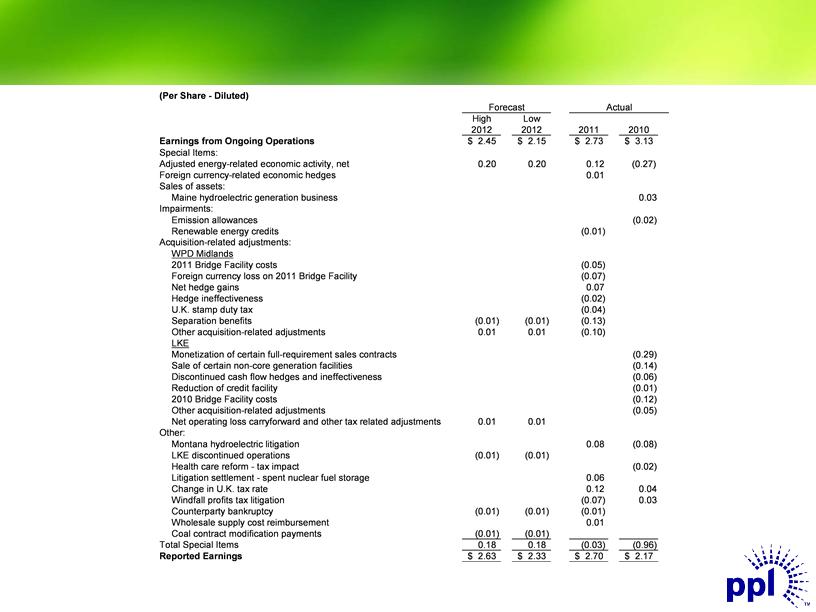
Reconciliation of PPL’s Earnings from Ongoing
Operations to Reported Earnings
Operations to Reported Earnings
Reconciliation of PPL’s Earnings from Ongoing Operations to Reported Earnings Reconciliation of PPL’s Earnings from Ongoing Operations to Reported Earnings (Per Share - Diluted) Earnings from Ongoing Operations Special Items: Adjusted energy-related economic activity, net Foreign currency-related economic hedges Sales of assets: Maine hydroelectric generation business Impairments: Emission allowances Renewable energy credits Acquisition-related adjustments: WPD Midlands 2011 Bridge Facility costs Foreign currency loss on 2011 Bridge Facility Net hedge gains Hedge ineffectiveness U.K. stamp duty tax Separation benefits Other acquisition-related adjustments LKE Monetization of certain full-requirement sales contracts Sale of certain non-core generation facilities Discontinued cash flow hedges and ineffectiveness Reduction of credit facility 2010 Bridge Facility costs Other acquisition-related adjustments Net operating loss carryforward and other tax related adjustments Other: Montana hydroelectric litigation LKE discontinued operations Health care reform - tax impact Litigation settlement - spent nuclear fuel storage Change in U.K. tax rate Windfall profits tax litigation Counterparty bankruptcy Wholesale supply cost reimbursement Coal contract modification payments Total Special Items Reported Earnings Forecast High Low 2012 2012 $ 2.45 $ 2.15 0.20 0.20 ( 0.01) (0.01) 0.01 0.01 0.01 0.01 (0.01) (0.01) (0.01) (0.01) ( 0.01) (0.01) 0.18 0.18 $ 2.63 $ 2.33 Actual 2011 2010 $ 2.73 $ 3.13 0.12 ( 0.27) 0.01 0.03 ( 0.02) ( 0.01) ( 0.05) ( 0.07) 0.07 ( 0.02) ( 0.04) ( 0.13) ( 0.10) ( 0.29) ( 0.14) ( 0.06) ( 0.01) ( 0.12) ( 0.05) 0.08 ( 0.08) ( 0.02) 0.06 0.12 0.04 ( 0.07) 0.03 ( 0.01) 0.01 ( 0.03) ( 0.96) $ 2.70 $ 2.17 ©PPL Corporation 2012 26

©PPL Corporation 2012
27
Forward-Looking Information Statement
Statements contained in this presentation, including statements with respect to future earnings, cash flows, financing, regulation and
corporate strategy are "forward-looking statements" within the meaning of the federal securities laws. Although PPL Corporation
believes that the expectations and assumptions reflected in these forward-looking statements are reasonable, these statements are
subject to a number of risks and uncertainties, and actual results may differ materially from the results discussed in the statements.
The following are among the important factors that could cause actual results to differ materially from the forward-looking statements:
market demand and prices for energy, capacity and fuel; weather conditions affecting customer energy usage and operating costs;
competition in power markets; the effect of any business or industry restructuring; the profitability and liquidity of PPL Corporation, its
subsidiaries and customers; new accounting requirements or new interpretations or applications of existing requirements; operating
performance of plants and other facilities; the length of scheduled and unscheduled outages at our generating plants; environmental
conditions and requirements and the related costs of compliance, including environmental capital expenditures and emission
allowance and other expenses; system conditions and operating costs; development of new projects, markets and technologies;
performance of new ventures; asset or business acquisitions and dispositions, and PPL Corporation’s ability to realize the expected
benefits from acquired businesses, including the 2010 acquisition of Louisville Gas and Electric Company and Kentucky Utilities
Company and the 2011 acquisition of the Central Networks electricity distribution businesses in the U.K.; any impact of hurricanes or
other severe weather on our business, including any impact on fuel prices; receipt of necessary government permits, approvals, rate
relief and regulatory cost recovery; capital market conditions and decisions regarding capital structure; the impact of state, federal or
foreign investigations applicable to PPL Corporation and its subsidiaries; the outcome of litigation against PPL Corporation and its
subsidiaries; stock price performance; the market prices of equity securities and the impact on pension income and resultant cash
funding requirements for defined benefit pension plans; the securities and credit ratings of PPL Corporation and its subsidiaries;
political, regulatory or economic conditions in states, regions or countries where PPL Corporation or its subsidiaries conduct business,
including any potential effects of threatened or actual terrorism or war or other hostilities; foreign exchange rates; new state, federal or
foreign legislation, including new tax legislation; and the commitments and liabilities of PPL Corporation and its subsidiaries. Any such
forward-looking statements should be considered in light of such important factors and in conjunction with PPL Corporation's Form 10-
K and other reports on file with the Securities and Exchange Commission.

©PPL Corporation 2012
28
Definitions of Non-GAAP Financial Measures
“Earnings from ongoing operations,” also referred to as “ongoing earnings,” should not be considered as an alternative to reported earnings, or net
income attributable to PPL, which is an indicator of operating performance determined in accordance with generally accepted accounting principles
(GAAP). PPL believes that “earnings from ongoing operations,” although a non-GAAP financial measure, is also useful and meaningful to investors
because it provides management’s view of PPL’s fundamental earnings performance as another criterion in making investment decisions. PPL’s
management also uses “earnings from ongoing operations” in measuring certain corporate performance goals. Other companies may use different
measures to present financial performance.
“Earnings from ongoing operations” is adjusted for the impact of special items. Special items include:
• Adjusted energy-related economic activity (as discussed below).
• Foreign currency-related economic hedges.
• Gains and losses on sales of assets not in the ordinary course of business.
• Impairment charges (including impairments of securities in the company’s nuclear decommissioning trust funds).
• Workforce reduction and other restructuring impacts.
• Acquisition-related adjustments.
• Other charges or credits that are, in management’s view, not reflective of the company’s ongoing operations.
Adjusted energy-related economic activity includes the changes in fair value of positions used economically to hedge a portion of the economic value
of PPL’s generation assets, full-requirement sales contracts and retail activities. This economic value is subject to changes in fair value due to market
price volatility of the input and output commodities (e.g., fuel and power) prior to the delivery period that was hedged. Also included in energy-related
economic activity is the ineffective portion of qualifying cash flow hedges, the monetization of certain full-requirement sales contracts and premium
amortization associated with options. This economic activity is deferred, with the exception of the full-requirement sales contracts that were
monetized, and included in earnings from ongoing operations over the delivery period of the item that was hedged or upon realization. Management
believes that adjusting for such amounts provides a better matching of earnings from ongoing operations to the actual amounts settled for PPL’s
underlying hedged assets. Please refer to the Notes to the Financial Statements and MD&A in PPL Corporation’s periodic filings with the Securities
and Exchange Commission for additional information on energy-related economic activity.
Free cash flow before dividends is derived by deducting capital expenditures and other investing activities-net, from cash flow from operations. Free
cash flow before dividends should not be considered as an alternative to cash flow from operations, which is determined in accordance with GAAP.
PPL believes that free cash flow before dividends, although a non-GAAP measure, is an important measure to both management and investors, as it
is an indicator of the company's ability to sustain operations and growth without additional outside financing beyond the requirement to fund maturing
debt obligations. Other companies may calculate free cash flow before dividends in a different manner.

©PPL Corporation 2012
29
Definitions of Non-GAAP Financial Measures
"Kentucky Gross Margins" is a single financial performance measure of the Kentucky Regulated segment's electricity generation, transmission and
distribution operations as well as its distribution and sale of natural gas. In calculating this measure, utility revenues and expenses associated with
approved cost recovery tracking mechanisms are offset. Certain costs associated with these mechanisms, primarily ECR and DSM, are recorded as
"Other operation and maintenance“ and "Depreciation.” These mechanisms allow for recovery of certain expenses, returns on capital investments
and performance incentives. As a result, this measure represents the net revenues from the Kentucky Regulated segment's operations.
"Pennsylvania Gross Delivery Margins" is a single financial performance measure of the Pennsylvania Regulated segment's electric delivery
operations, which includes transmission and distribution activities. In calculating this measure, utility revenues and expenses associated with
approved recovery mechanisms, including energy provided as a PLR, are offset with minimal impact on earnings. Costs associated with these
mechanisms are recorded in "Energy purchases," "Other operation and maintenance,“ which is primarily Act 129 costs, and in "Taxes, other than
income," which is primarily gross receipts tax. This performance measure includes PLR energy purchases by PPL Electric from PPL EnergyPlus,
which are reflected in “PLR intersegment utility revenue (expense).” As a result, this measure represents the net revenues from the Pennsylvania
Regulated segment's electric delivery operations.
"Unregulated Gross Energy Margins" is a single financial performance measure of the Supply segment's competitive energy non-trading and trading
activities. In calculating this measure, the Supply segment's energy revenues, which include operating revenues associated with certain Supply
segment businesses that are classified as discontinued operations, are offset by the cost of fuel, energy purchases, certain other operation and
maintenance expenses, primarily ancillary charges, gross receipts tax, which is recorded in "Taxes, other than income," and operating expenses
associated with certain Supply segment businesses that are classified as discontinued operations. This performance measure is relevant to PPL
due to the volatility in the individual revenue and expense lines on the Statements of Income that comprise "Unregulated Gross Energy Margins."
This volatility stems from a number of factors, including the required netting of certain transactions with ISOs and significant swings in unrealized
gains and losses. Such factors could result in gains or losses being recorded in either "Wholesale energy marketing" or "Energy purchases" on the
Statements of Income. This performance measure includes PLR revenues from energy sales to PPL Electric by PPL EnergyPlus, which are
reflected in "PLR intersegment utility revenue (expense)." PPL excludes from "Unregulated Gross Energy Margins" the Supply segment's adjusted
energy-related economic activity, which includes the changes in fair value of positions used to economically hedge a portion of the economic value of
PPL's competitive generation assets, full-requirement sales contracts and retail activities. This economic value is subject to changes in fair value
due to market price volatility of the input and output commodities (e.g., fuel and power) prior to the delivery period that was hedged. Also included in
this energy-related economic activity is the ineffective portion of qualifying cash flow hedges, the monetization of certain full-requirement sales
contracts and premium amortization associated with options. This economic activity is deferred, with the exception of the full-requirement sales
contracts that were monetized, and included in unregulated gross energy margins over the delivery period that was hedged or upon realization.