Attached files
| file | filename |
|---|---|
| 8-K - 8-K - Mead Johnson Nutrition Co | a12-20281_18k.htm |
Exhibit 99.1
|
|
Barclays Capital Back-to-School Consumer Conference September 6, 2012 Boston Pete Leemputte Executive Vice President and CFO Steve Golsby President and Chief Executive Officer |
|
|
1 Safe Harbor Statement Forward-Looking Statements Certain statements in this presentation are forward looking as defined in the Private Securities Litigation Reform Act of 1995. These statements, which are identified by words such as “expects,” “intends” and “believes,” involve certain risks, uncertainties and assumptions that may cause actual results to differ materially from expectations as of the date of this presentation. These risks include, but are not limited to: (1) the ability to sustain brand strength, particularly the “Enfa” family of brands; (2) the effect on the company’s reputation of real or perceived quality issues; (3) the adverse effect of commodity costs; (4) increased competition from branded, private label, store and economy-branded products; (5) the effect of an economic downturn on consumers’ purchasing behavior and customers’ ability to pay for product; (6) inventory reductions by customers; (7) the adverse effect of changes in foreign currency exchange rates; (8) the effect of changes in economic, political and social conditions in the markets where we operate; (9) legislative, regulatory or judicial action that may adversely affect the company’s ability to advertise its products or maintain product margins; (10) the possibility of changes in the Women, Infant and Children (WIC) program, or increases in levels of participation in WIC; and (11) the ability to develop and market new, innovative products. For additional information on these and other factors, see the risk factors identified in the company’s periodic reports, including the annual report on Form 10-K for 2011, quarterly reports on Form 10-Q and current reports on Form 8-K, filed with, or furnished to, the Securities and Exchange Commission, available upon request or at www.meadjohnson.com. The company undertakes no obligation to publicly update any forward-looking statement, whether as a result of new information, future events or otherwise. Factors Affecting Comparability—Non-GAAP Financial Measures This presentation contains non-GAAP financial measures, including non-GAAP net sales, EBIT, earnings and earnings per share information. The items included in GAAP measures, but excluded for the purpose of determining non-GAAP net sales, EBIT, earnings and earnings per share, are IT separation and other costs (Specified Items). In addition, other items include the tax impact on Specified Items. Non-GAAP net sales, EBIT, earnings and earnings per share information adjusted for these items is an indication of the company’s underlying operating results and intended to enhance an investor’s overall understanding of the company’s financial performance. In addition, this information is among the primary indicators the company uses as a basis for evaluating company performance, setting incentive compensation targets and planning and forecasting of future periods. This information is not intended to be considered in isolation or as a substitute for financial measures prepared in accordance with GAAP. Tables that reconcile GAAP to non-GAAP disclosure are included in the Appendix. For more information: Kathy MacDonald Vice President – Investor Relations Mead Johnson Nutrition Company 847-832-2182 kathy.macdonald@mjn.com September 2012 |
|
|
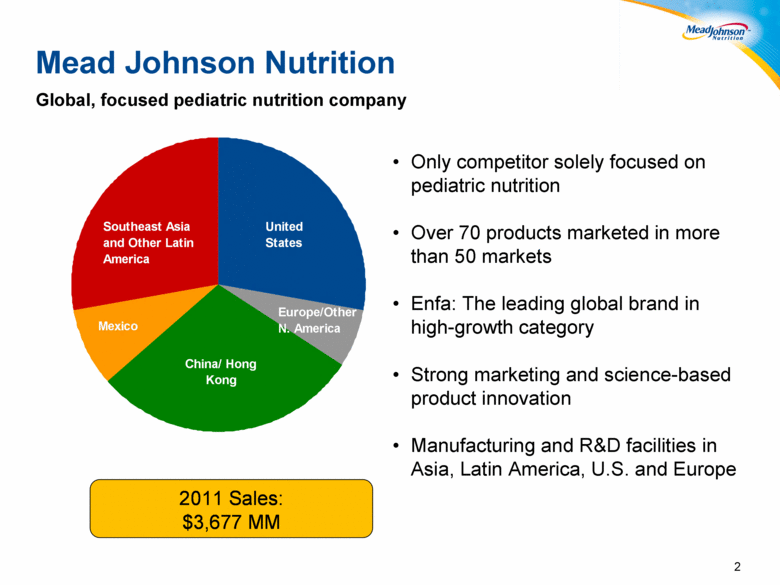
2 2 Only competitor solely focused on pediatric nutrition Over 70 products marketed in more than 50 markets Enfa: The leading global brand in high-growth category Strong marketing and science-based product innovation Manufacturing and R&D facilities in Asia, Latin America, U.S. and Europe Mead Johnson Nutrition Global, focused pediatric nutrition company United States Europe/Other N. America China/ Hong Kong Mexico Southeast Asia and Other Latin America 2011 Sales: $3,677 MM |
|
|
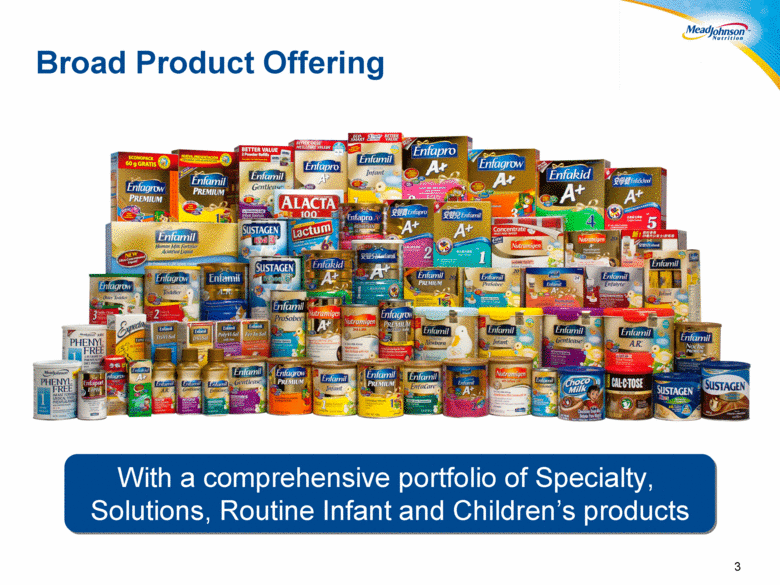
3 With a comprehensive portfolio of Specialty, Solutions, Routine Infant and Children’s products Broad Product Offering |
|
|
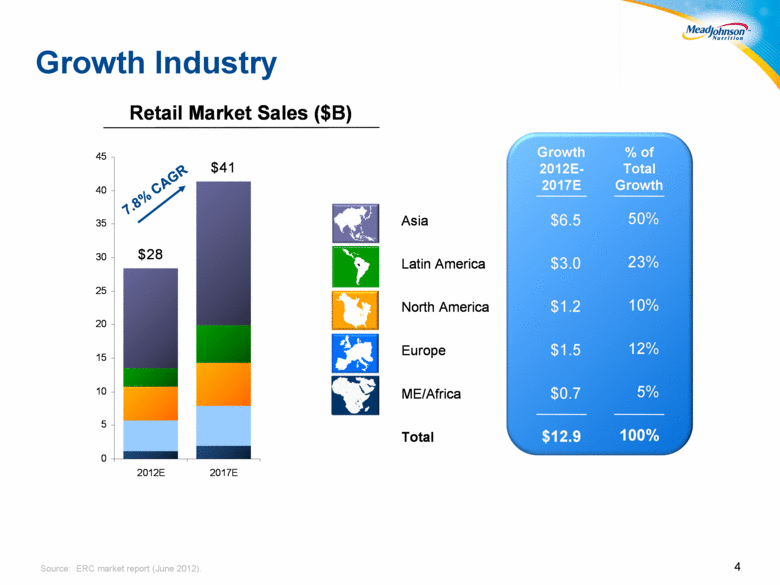
4 Source: ERC market report (June 2012). Growth Industry $28 $41 0 5 10 15 20 25 30 35 40 45 2012 E 2017 E Asia Latin America North America Europe ME/Africa Total $6.5 $3.0 $1.2 $1.5 $0.7 $12.9 Growth 2012E - 2017E ` ` ` 50% 23% 10% 12% 5% 100% % of Total Growth Retail Market Sales ($B) Retail Market Sales ($B) 7.8% CAGR |
|
|
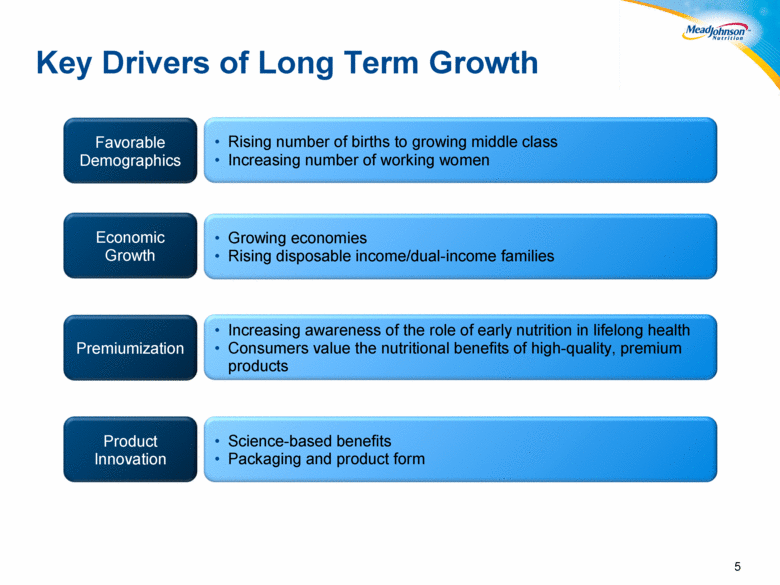
5 5 Premiumization Product Innovation Economic Growth Favorable Demographics Growing economies Rising disposable income/dual-income families Increasing awareness of the role of early nutrition in lifelong health Consumers value the nutritional benefits of high-quality, premium products Science-based benefits Packaging and product form Rising number of births to growing middle class Increasing number of working women Key Drivers of Long Term Growth |
|
|
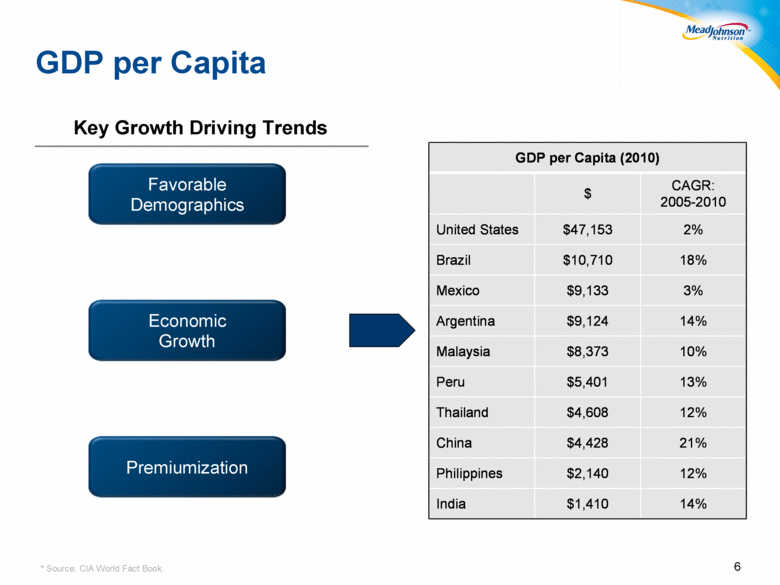
6 6 * Source: CIA World Fact Book. Favorable Demographics Premiumization Economic Growth Key Growth Driving Trends GDP per Capita GDP per Capita (2010) $ CAGR: 2005 - 2010 United States $47,153 2% Brazil $10,710 18% Mexico $9,133 3% Argentina $9,124 14% Malaysia $8,373 10% Peru $5,401 13% Thailand $4,608 12% China $4,428 21% Philippines $2,140 12% India $1,410 14% GDP per Capita (2010) $ CAGR: 2005 - 2010 United States $47,153 2% Brazil $10,710 18% Mexico $9,133 3% Argentina $9,124 14% Malaysia $8,373 10% Peru $5,401 13% Thailand $4,608 12% China $4,428 21% Philippines $2,140 12% India $1,410 14% |
|
|
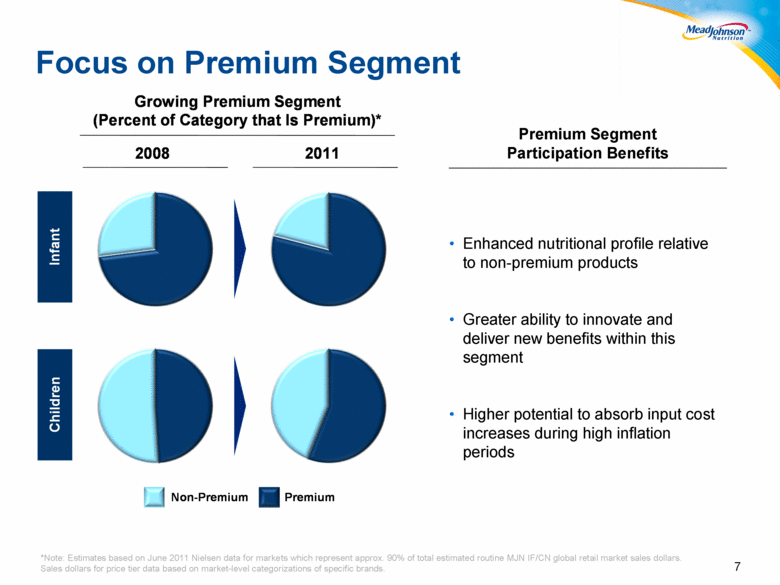
7 Enhanced nutritional profile relative to non-premium products Greater ability to innovate and deliver new benefits within this segment Higher potential to absorb input cost increases during high inflation periods Premium Segment Participation Benefits *Note: Estimates based on June 2011 Nielsen data for markets which represent approx. 90% of total estimated routine MJN IF/CN global retail market sales dollars. Sales dollars for price tier data based on market-level categorizations of specific brands. Focus on Premium Segment Growing Premium Segment (Percent of Category that Is Premium)* 2008 2011 Premium Non - Premium Infant Children |
|
|
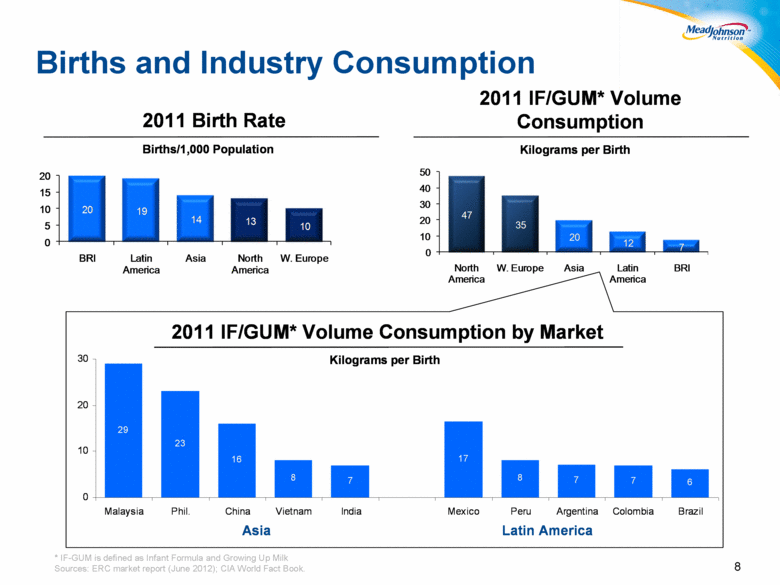
8 8 Births and Industry Consumption * IF-GUM is defined as Infant Formula and Growing Up Milk Sources: ERC market report (June 2012); CIA World Fact Book. 2011 IF/GUM* Volume Consumption Kilograms per Birth 47 35 20 12 7 0 10 20 30 40 50 North America W. Europe Asia Latin America BRI 2011 Birth Rate Births/1,000 Population 20 19 14 13 10 0 5 10 15 20 BRI Latin America Asia North America W. Europe 29 23 16 8 7 17 8 7 7 6 0 10 20 30 Malaysia Phil. China Vietnam India Mexico Peru Argentina Colombia Brazil 2011 IF/GUM* Volume Consumption by Market Kilograms per Birth 29 23 16 8 7 17 8 7 7 6 0 10 20 30 Malaysia Phil. China Vietnam India Mexico Peru Argentina Colombia Brazil 2011 IF/GUM* Volume Consumption by Market Kilograms per Birth 2011 IF/GUM* Volume Consumption by Market Kilograms per Birth Asia Latin America |
|
|
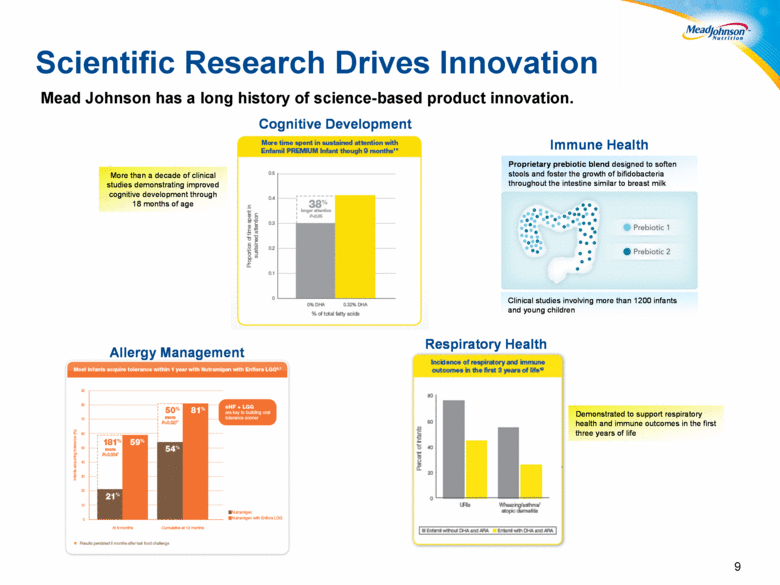
Scientific Research Drives Innovation Mead Johnson has a long history of science-based product innovation. 9 Respiratory Health Immune Health Allergy Management Cognitive Development More than a decade of clinical studies demonstrating improved cognitive development through 18 months of age Proprietary prebiotic blend designed to soften stools and foster the growth of bifidobacteria throughout the intestine similar to breast milk Clinical studies involving more than 1200 infants and young children Demonstrated to support respiratory health and immune outcomes in the first three years of life |
|
|
Absolute Commitment to Quality U.S. TV Commercial QUALITY CHECKS AND SAFETY TESTS 2300 OF PEDIATRIC NUTRITION EXPERTISE 100 YEARS 10 |
|
|
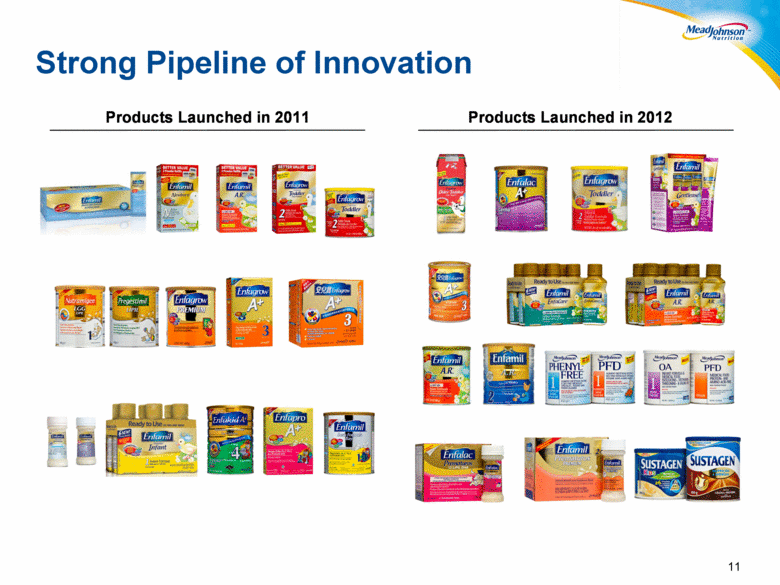
11 Strong Pipeline of Innovation Products Launched in 2011 Products Launched in 2012 |
|
|
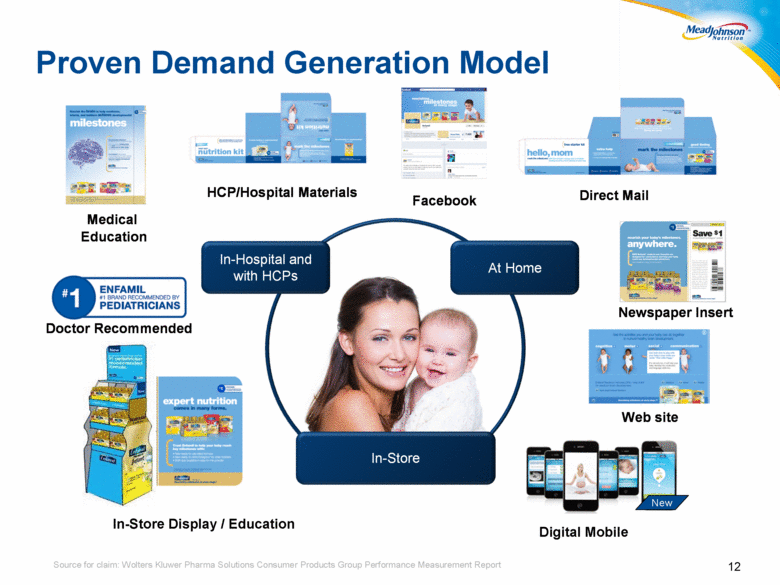
12 12 Source for claim: Wolters Kluwer Pharma Solutions Consumer Products Group Performance Measurement Report Proven Demand Generation Model In-Store Display / Education Digital Mobile In - Store In - Store In - Hospital and with HCPs In - Hospital and with HCPs At Home At Home New Facebook HCP/Hospital Materials Medical Education Doctor Recommended Direct Mail Newspaper Insert Web site |
|
|
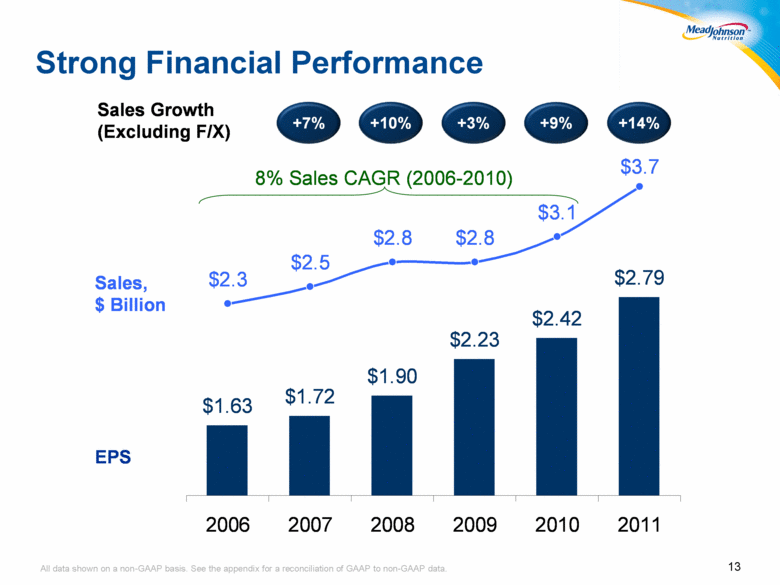
13 All data shown on a non-GAAP basis. See the appendix for a reconciliation of GAAP to non-GAAP data. Strong Financial Performance Sales, $ Billion EPS +9% +9% +3% +3% +10% +10% Sales Growth (Excluding F/X) +14% +14% +7% +7% $1.63 $1.72 $1.90 $2.23 $2.42 $2.79 $2.3 $2.5 $2.8 $2.8 $3.1 $3.7 2006 2007 2008 2009 2010 2011 8% Sales CAGR (2006 - 2010) |
|
|
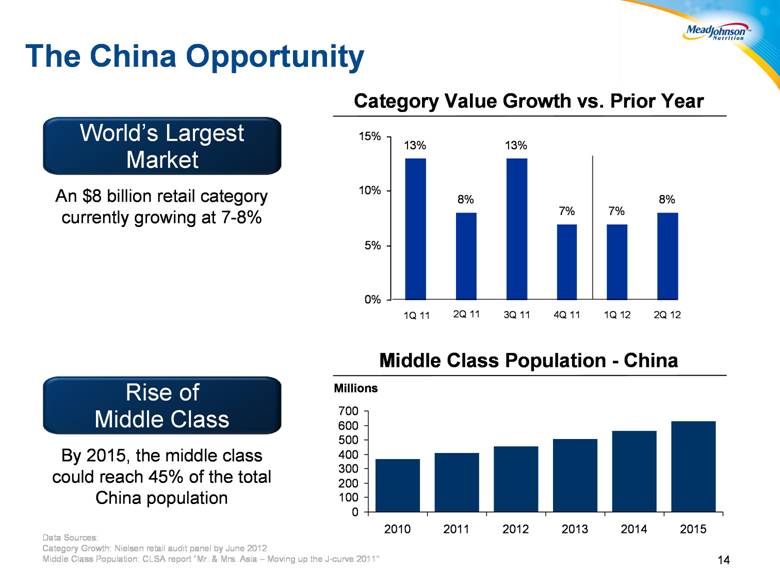
14 The China Opportunity Data Sources: Category Growth: Nielsen retail audit panel by June 2012 13% 8% 13% 7% 7% 8% 0% 5% 10% 15% 1Q 11 1Q 12 3Q 11 2Q 12 2Q 11 4Q 11 World ’ s Largest Market An $8 billion retail category currently growing at 7 - 8% World ’ s Largest Market World ’ s Largest Market An $8 billion retail category currently growing at 7 - 8% Rise of Middle Class By 2015, the middle class could reach 45% of the total China population Rise of Middle Class Rise of Middle Class By 2015, the middle class could reach 45% of the total China population Middle Class Population - China Category Value Growth vs. Prior Year Millions 0 100 200 300 400 500 600 700 2010 2011 2012 2013 2014 2015 Middle Class Population: CLSA report “Mr. & Mrs. Asia – Moving up the J-curve 2011” |
|
|
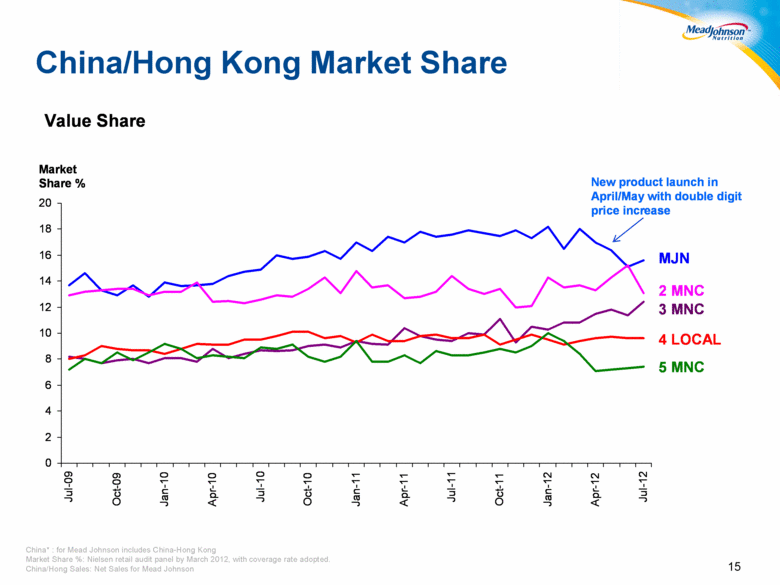
15 15 China* : for Mead Johnson includes China-Hong Kong Market Share %: Nielsen retail audit panel by March 2012, with coverage rate adopted. China/Hong Sales: Net Sales for Mead Johnson China/Hong Kong Market Share 0 2 4 6 8 10 12 14 16 18 20 Jul-09 Oct-09 Jan-10 Apr-10 Jul-10 Oct-10 Jan-11 Apr-11 Jul-11 Oct-11 Jan-12 Apr-12 Jul-12 Market Share % 2 MNC 4 LOCAL 3 MNC MJN 5 MNC Value Share New product launch in April/May with double digit price increase |
|
|
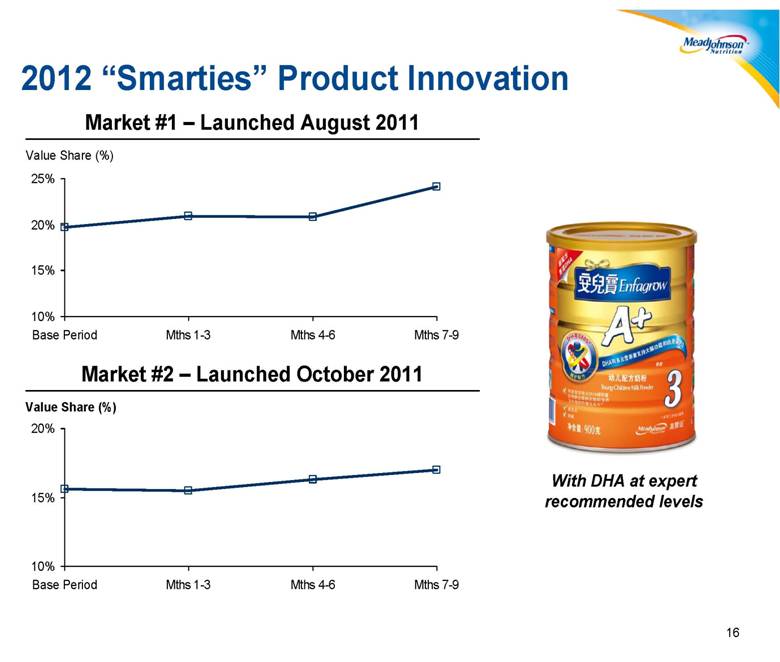
16 2012 “Smarties” Product Innovation Value Share (%) Market #1 – Launched August 2011 Market #1 – Launched August 2011 10% 15% 20% 25% Base Period Mths 1-3 Mths 4-6 Mths 7-9 Value Share (%) Market #2 – Launched October 2011 Market #2 – Launched October 2011 10% 15% 20% Base Period Mths 1-3 Mths 4-6 Mths 7-9 Mead Johnson - Children's Mead Johnson - Children's With DHA at expert recommended levels |
|
|
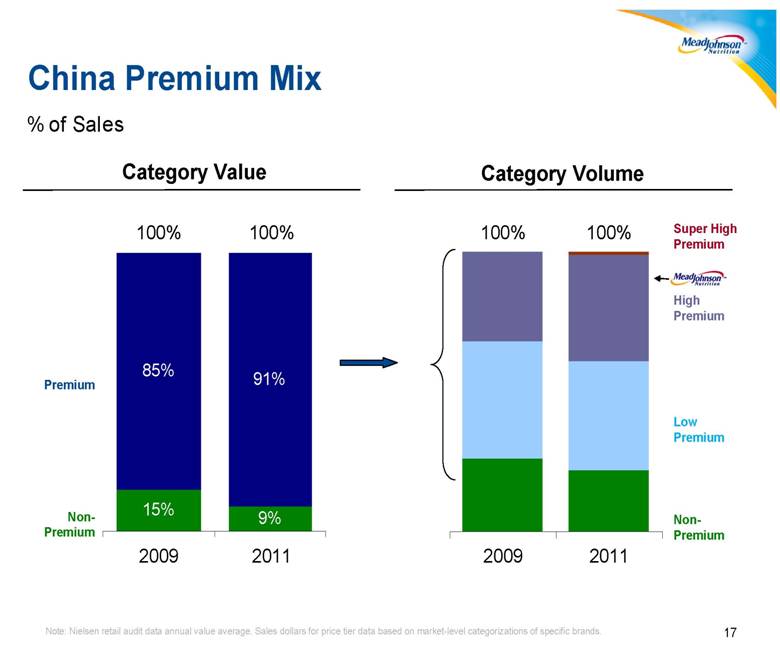
17 Note: Nielsen retail audit data annual value average. Sales dollars for price tier data based on market-level categorizations of specific brands. China Premium Mix 85% 91% 100% 100% 9% 15% 0% 10% 20% 30% 40% 50% 60% 70% 80% 90% 100% 2009 2011 100% 100% 0% 10% 20% 30% 40% 50% 60% 70% 80% 90% 100% 2009 2011 Premium Non - Premium High Premium Super High Premium Low Premium Non - Premium Category Volume Category Value % of Sales 2009 2011 2009 2011 100% 1 0 0 % 1 0 0 % 1 0 0 % |
|
|
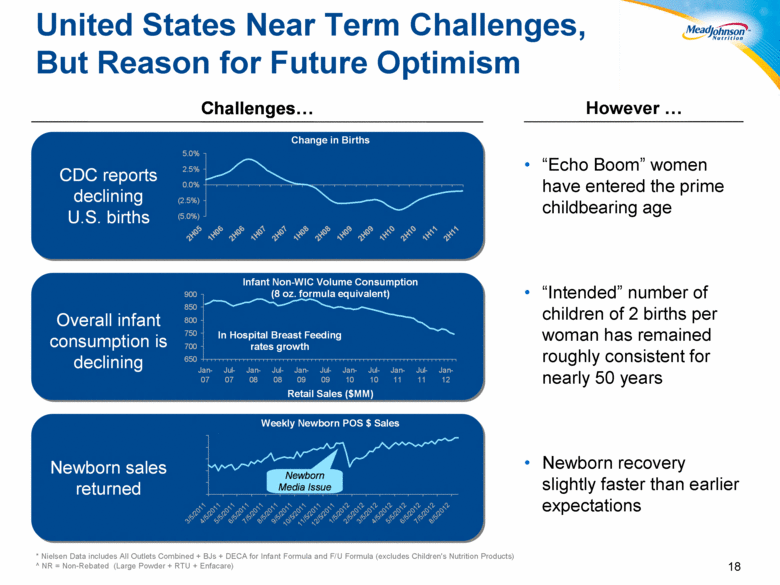
18 “Echo Boom” women have entered the prime childbearing age “Intended” number of children of 2 births per woman has remained roughly consistent for nearly 50 years Newborn recovery slightly faster than earlier expectations However * Nielsen Data includes All Outlets Combined + BJs + DECA for Infant Formula and F/U Formula (excludes Children's Nutrition Products) ^ NR = Non-Rebated (Large Powder + RTU + Enfacare) United States Near Term Challenges, But Reason for Future Optimism Overall infant consumption is declining Challenges CDC reports declining U.S. births (5.0%) (2.5%) 0.0% 2.5% 5.0% 2H05 1H06 2H06 1H07 2H07 1H08 2H08 1H09 2H09 1H10 2H10 1H11 2H11 Newborn sales returned 650 700 750 800 850 900 Jan- 07 Jul- 07 Jan- 08 Jul- 08 Jan- 09 Jul- 09 Jan- 10 Jul- 10 Jan- 11 Jul- 11 Jan- 12 Infant Non - WIC Volume Consumption (8 oz. formula equivalent) Retail Sales ($MM) Change in Births Weekly Newborn POS $ Sales 3/5/2011 4/5/2011 5/5/2011 6/5/2011 7/5/2011 8/5/2011 9/5/2011 10/5/2011 11/5/2011 12/5/2011 1/5/2012 2/5/2012 3/5/2012 4/5/2012 5/5/2012 6/5/2012 7/5/2012 8/5/2012 Newborn Media Issue In Hospital Breast Feeding rates growth |
|
|
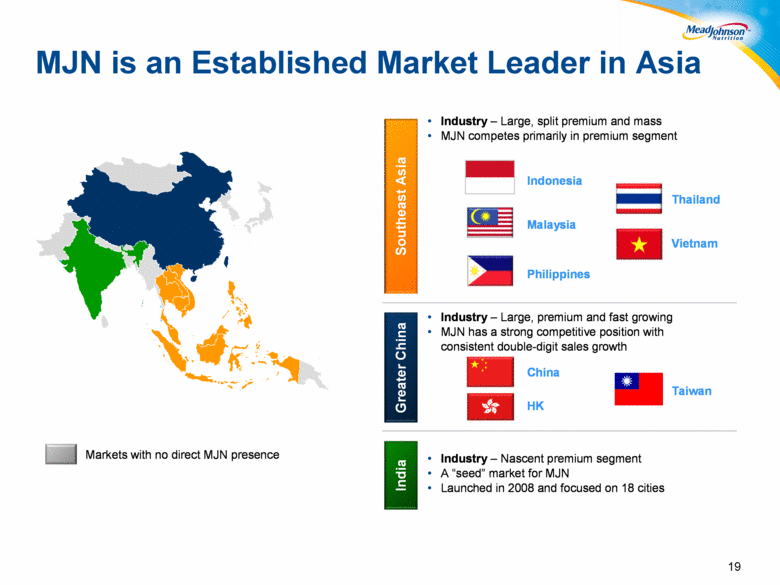
19 MJN is an Established Market Leader in Asia Greater China Greater China Markets with no direct MJN presence Southeast Asia Southeast Asia • Industry – Large, premium and fast growing • MJN has a strong competitive position with consistent double - digit sales growth • Industry – Large, split premium and mass • MJN competes primarily in premium segment • Industry – Nascent premium segment • A “ seed ” market for MJN • Launched in 2008 and focused on 18 cities Vietnam Thailand Malaysia Philippines HK China India India Indonesia Taiwan |
|
|
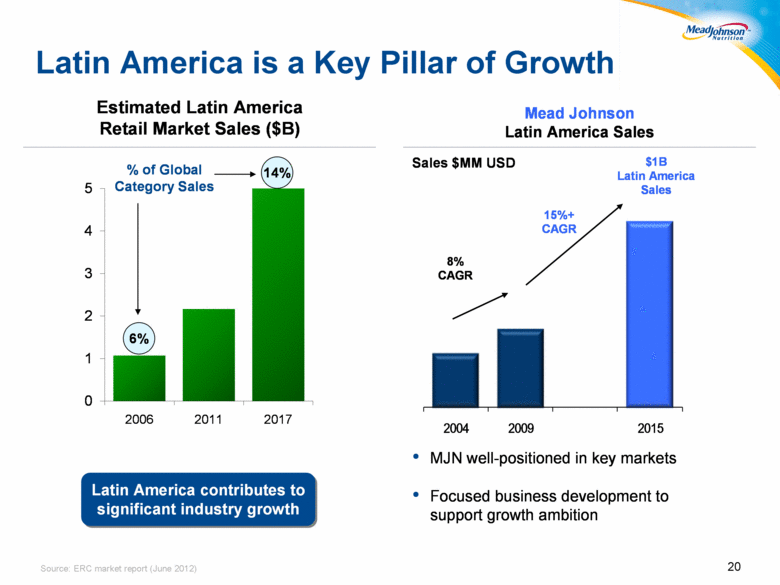
20 Source: ERC market report (June 2012) Latin America is a Key Pillar of Growth 2004 2009 2015 Sales $MM USD $1B Latin America Sales Mead Johnson Latin America Sales 8% CAGR 15%+ CAGR • MJN well - positioned in key markets • Focused business development to support growth ambition 0 1 2 3 4 5 2006 2011 2017 Estimated Latin America Retail Market Sales ($B) Latin America contributes to significant industry growth Latin America contributes to significant industry growth 6% 14% % of Global Category Sales |
|
|
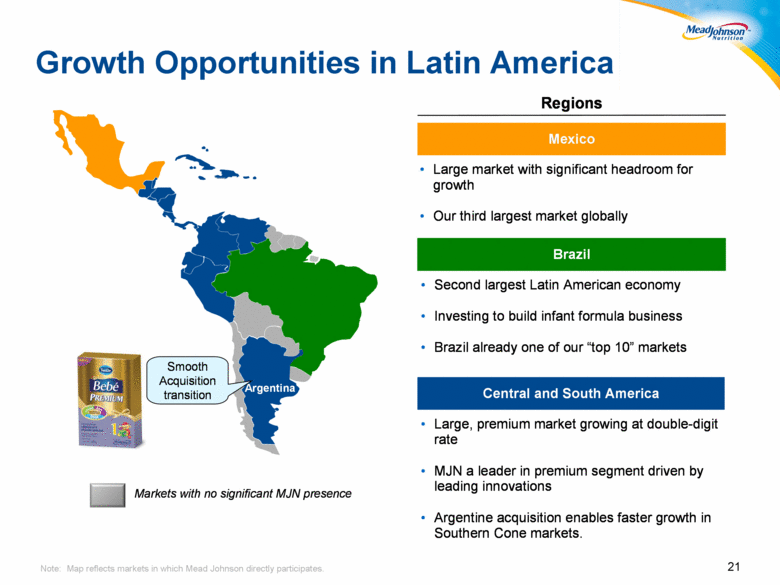
21 Note: Map reflects markets in which Mead Johnson directly participates. Growth Opportunities in Latin America Mexico • Large market with significant headroom for growth • Our third largest market globally Central and South America • Large, premium market growing at double - digit rate • MJN a leader in premium segment driven by leading innovations • Argentine acquisition enables faster growth in Southern Cone markets. Central and South America • Large, premium market growing at double - digit rate • MJN a leader in premium segment driven by leading innovations • Argentine acquisition enables faster growth in Southern Cone markets. Brazil • Second largest Latin American economy • Investing to build infant formula business • Brazil already one of our “ top 10 ” markets Brazil • Second largest Latin American economy • Investing to build infant formula business • Brazil already one of our “ top 10 ” markets Markets with no significant MJN presence Regions Smooth Acquisition transition Argentina |
|
|
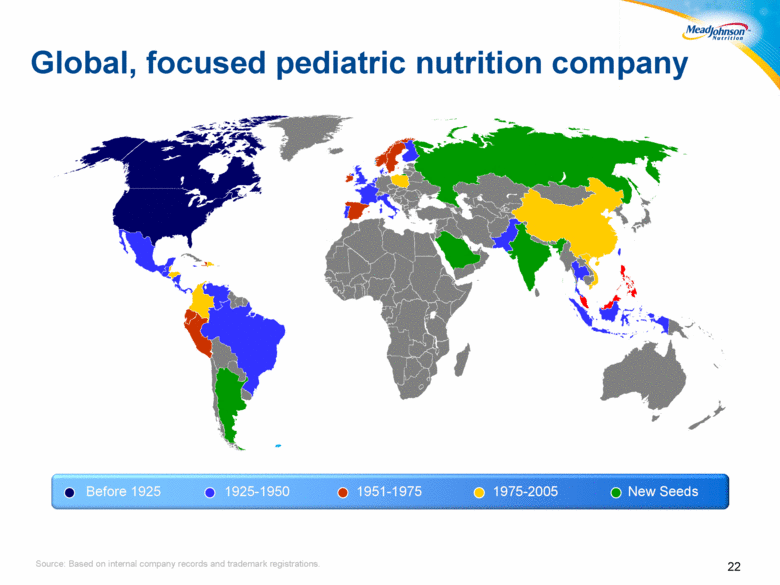
22 Source: Based on internal company records and trademark registrations. Global, focused pediatric nutrition company Before 1925 1925 - 1950 1951 - 1975 1975 - 2005 New Seeds Before 1925 1925 - 1950 1951 - 1975 1975 - 2005 New Seeds |
|
|
23 Financial Overview |
|
|
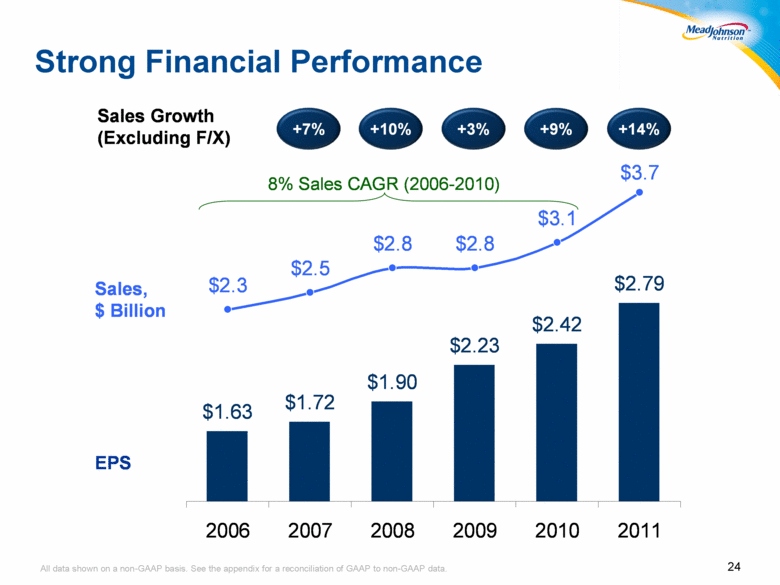
24 Strong Financial Performance All data shown on a non-GAAP basis. See the appendix for a reconciliation of GAAP to non-GAAP data. Sales, $ Billion EPS +9% +9% +3% +3% +10% +10% Sales Growth (Excluding F/X) +14% +14% +7% +7% $1.63 $1.72 $1.90 $2.23 $2.42 $2.79 $2.3 $2.5 $2.8 $2.8 $3.1 $3.7 2006 2007 2008 2009 2010 2011 8% Sales CAGR (2006 - 2010) |
|
|
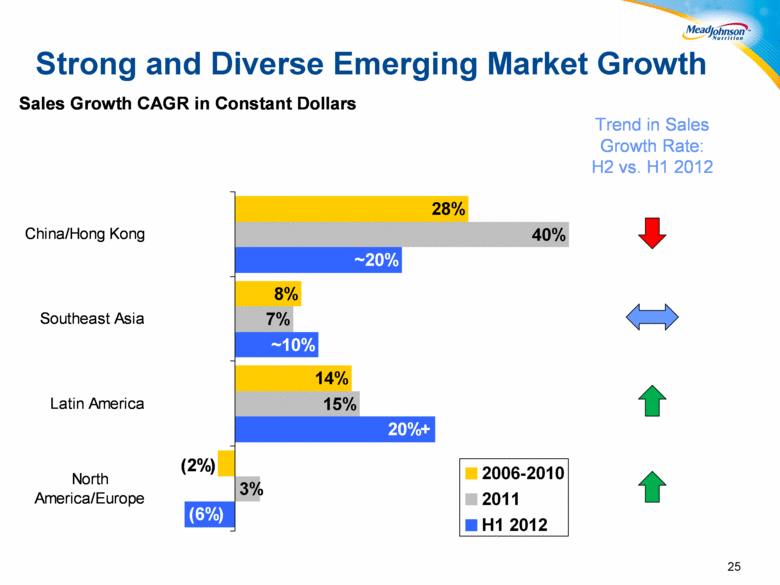
25 Strong and Diverse Emerging Market Growth Trend in Sales Growth Rate: H2 vs. H1 2012 Sales Growth CAGR in Constant Dollars (6%) 3% 15% 7% 40% 14% 8% 28% 20%+ ~10% ~20% (2%) North America/Europe Latin America Southeast Asia China/Hong Kong 2006-2010 2011 H1 2012 |
|
|
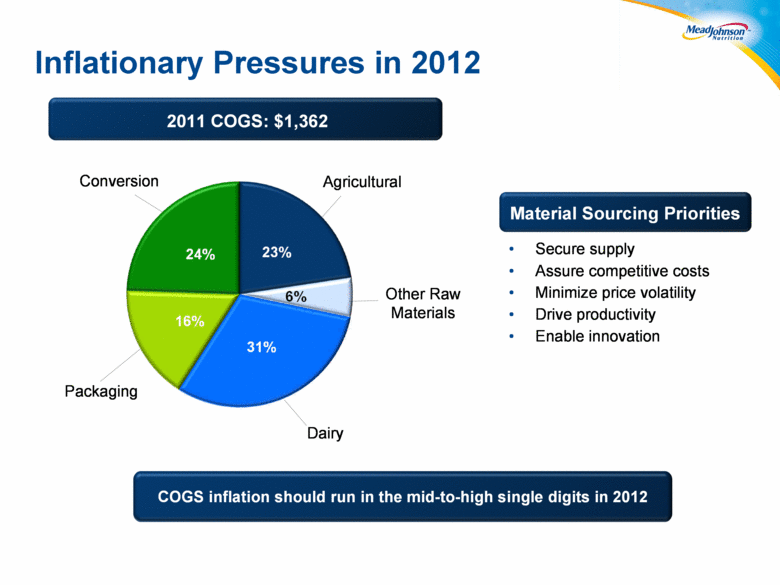
Inflationary Pressures in 2012 Material Sourcing Priorities • Secure supply • Assure competitive costs • Minimize price volatility • Drive productivity • Enable innovation 2011 COGS: $1,362 Other Raw Materials Agricultural Packaging Conversion Dairy COGS inflation should run in the mid - to - high single digits in 2012 COGS inflation should run in the mid - to - high single digits in 2012 |
|
|
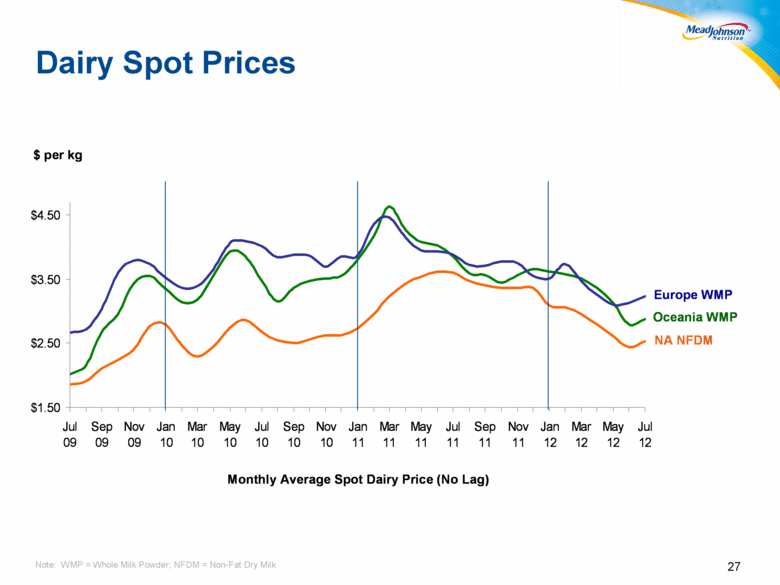
27 27 Dairy Spot Prices Note: WMP = Whole Milk Powder; NFDM = Non-Fat Dry Milk $1.50 $2.50 $3.50 $4.50 Jul 09 Sep 09 Nov 09 Jan 10 Mar 10 May 10 Jul 10 Sep 10 Nov 10 Jan 11 Mar 11 May 11 Jul 11 Sep 11 Nov 11 Jan 12 Mar 12 May 12 Jul 12 $ per kg Monthly Average Spot Dairy Price (No Lag) Europe WMP NA NFDM Oceania WMP |
|
|
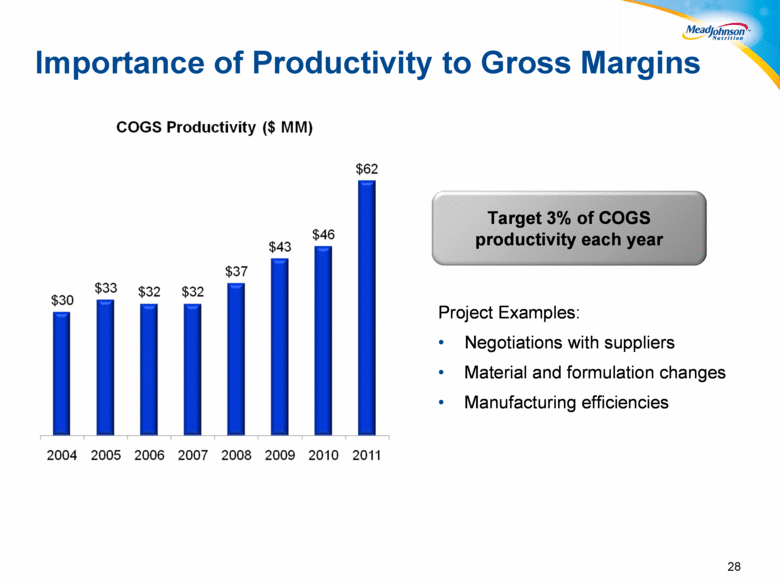
28 Importance of Productivity to Gross Margins Target 3% of COGS productivity each year Target 3% of COGS productivity each year Project Examples: • Negotiations with suppliers • Material and formulation changes • Manufacturing efficiencies |
|
|
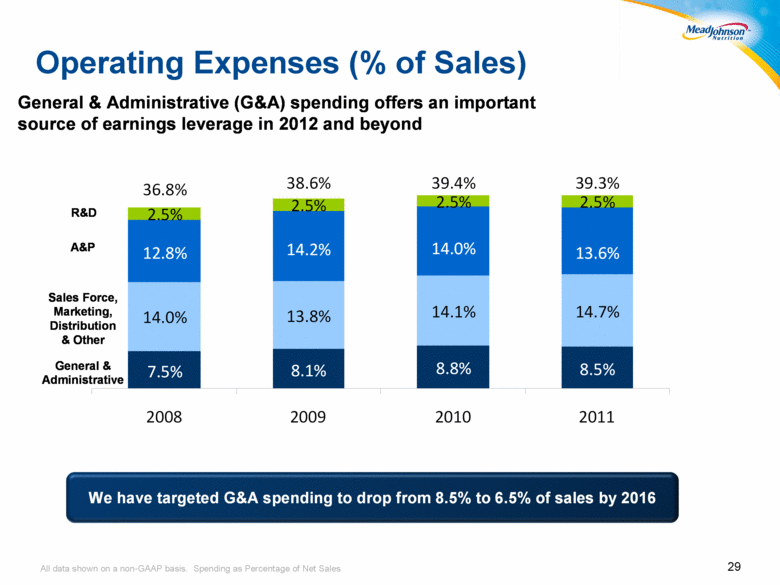
29 Operating Expenses (% of Sales) All data shown on a non-GAAP basis. Spending as Percentage of Net Sales 14.0% 13.8% 14.1% 2.5% 2.5% 2.5% 2.5% 36.8% 38.6% 39.4% 39.3% 7.5% 8.1% 8.8% 8.5% 14.7% 12.8% 14.2% 14.0% 13.6% 2008 2009 2010 2011 General & Administrative (G&A) spending offers an important source of earnings leverage in 2012 and beyond Sales Force, Marketing, Distribution & Other General & Administrative A&P R&D We have targeted G&A spending to drop from 8.5% to 6.5% of sales by 2016 We have targeted G&A spending to drop from 8.5% to 6.5% of sales by 2016 |
|
|
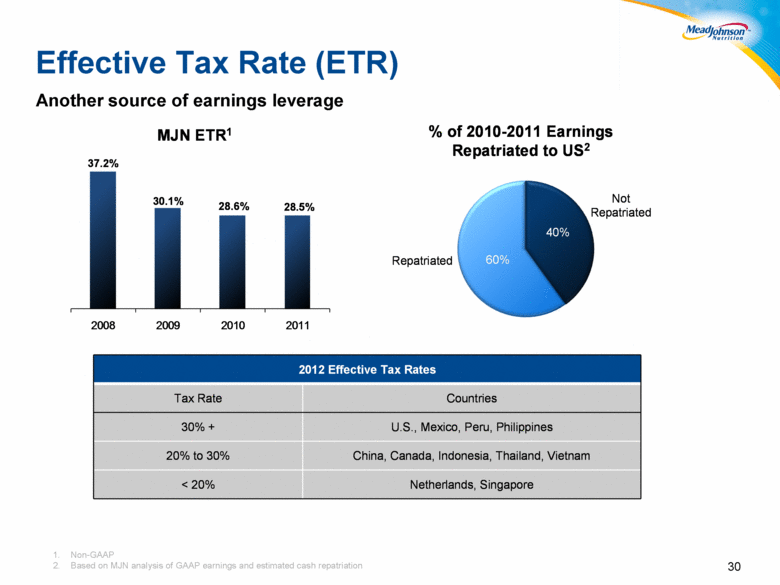
Non-GAAP Based on MJN analysis of GAAP earnings and estimated cash repatriation 30 Effective Tax Rate (ETR) Another source of earnings leverage 2008 2009 2010 2011 37.2% 28.6% 30.1% MJN ETR 1 % of 2010 - 2011 Earnings Repatriated to US 2 60% 40% Repatriated Not Repatriated % of 2010 - 2011 Earnings Repatriated to US 2 60% 40% Repatriated Not Repatriated 2012 Effective Tax Rates Tax Rate Countries 30% + U.S., Mexico, Peru, Philippines 20% to 30% China, Canada, Indonesia, Thailand, Vietnam < 20% Netherlands, Singapore 2012 Effective Tax Rates Tax Rate Countries 30% + U.S., Mexico, Peru, Philippines 20% to 30% China, Canada, Indonesia, Thailand, Vietnam < 20% Netherlands, Singapore 28.5% |
|
|
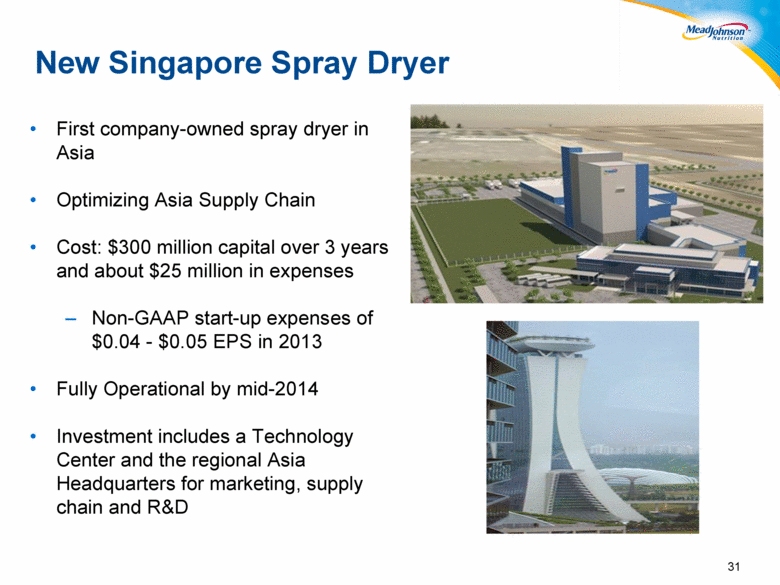
31 New Singapore Spray Dryer First company-owned spray dryer in Asia Optimizing Asia Supply Chain Cost: $300 million capital over 3 years and about $25 million in expenses Non-GAAP start-up expenses of $0.04 - $0.05 EPS in 2013 Fully Operational by mid-2014 Investment includes a Technology Center and the regional Asia Headquarters for marketing, supply chain and R&D |
|
|
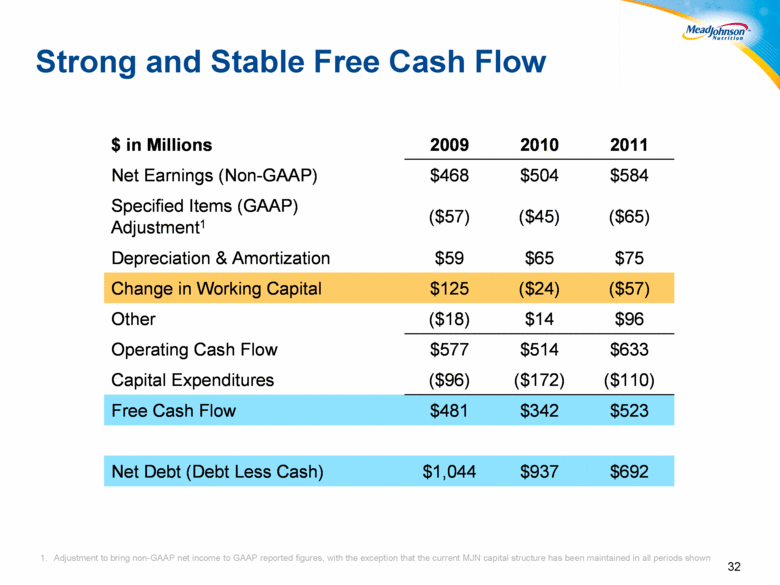
32 Strong and Stable Free Cash Flow Adjustment to bring non-GAAP net income to GAAP reported figures, with the exception that the current MJN capital structure has been maintained in all periods shown 2009 2010 Full Year $ in Millions 2009 2010 2011 Net Earnings (Non - GAAP) $468 $504 $584 Specified Items (GAAP) Adjustment 1 ($57) ($45) ($65) Depreciation & Amortization $59 $65 $75 Change in Working Capital $125 ($24) ($57) Other ($18) $14 $96 Operating Cash Flow $577 $514 $633 Capital Expenditures ($96) ($172) ($110) Free Cash Flow $481 $342 $523 Net Debt (Debt Less Cash) $1,044 $937 $692 $ in Millions 2009 2010 2011 Net Earnings (Non - GAAP) $468 $504 $584 Specified Items (GAAP) Adjustment 1 ($57) ($45) ($65) Depreciation & Amortization $59 $65 $75 Change in Working Capital $125 ($24) ($57) Other ($18) $14 $96 Operating Cash Flow $577 $514 $633 Capital Expenditures ($96) ($172) ($110) Free Cash Flow $481 $342 $523 Net Debt (Debt Less Cash) $1,044 $937 $692 |
|
|
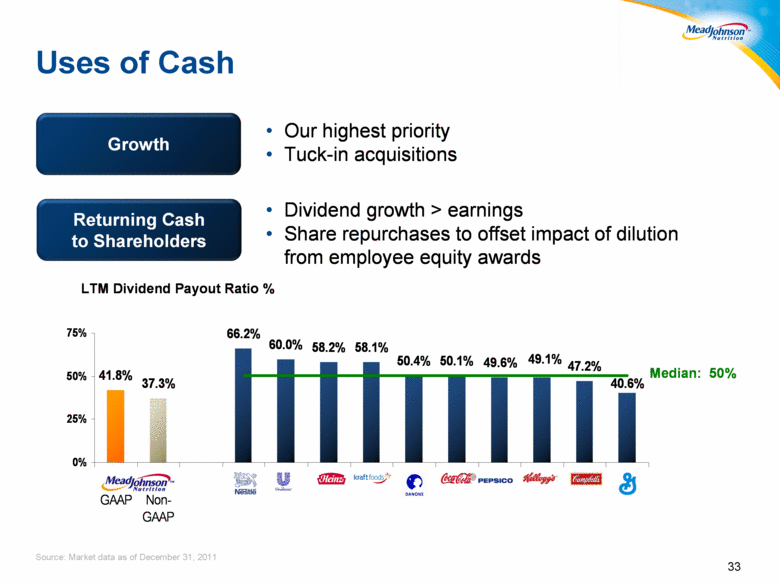
33 Uses of Cash Source: Market data as of December 31, 2011 • Our highest priority • Tuck - in acquisitions Growth Growth Returning Cash to Shareholders Returning Cash to Shareholders • Dividend growth > earnings • Share repurchases to offset impact of dilution from employee equity awards LTM Dividend Payout Ratio % Median: 50% 41.8% 37.3% 66.2% 60.0% 58.2% 58.1% 50.4% 50.1% 47.2% 40.6% 49.6% 49.1% 0% 25% 50% 75% MJN GAAP MJN Non- GAAP NESN ULVR HNZ KFT DN KO PEP K CPB GIS |
|
|
34 Mead Johnson Strengths Strong history of sales and EPS growth Excellent growth potential in emerging markets and expanding market diversification Increased investments in demand-generation and innovation Proven delivery of high quality standards Strong and stable cash flow Strong management with global experience |
|
|
35 |
|
|
36 Appendix |
|
|
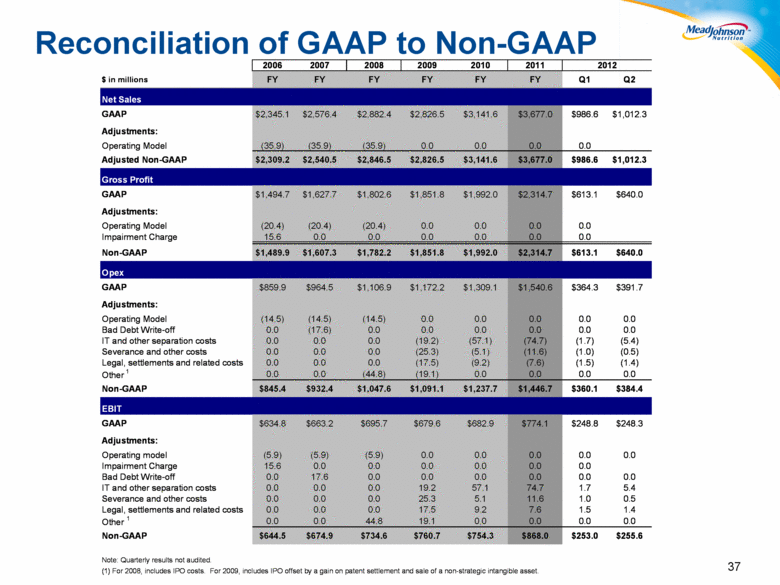
37 Reconciliation of GAAP to Non-GAAP $ in millions FY FY FY FY FY FY Q1 Q2 Net Sales GAAP $2,345.1 $2,576.4 $2,882.4 $2,826.5 $3,141.6 $3,677.0 $986.6 $1,012.3 Adjustments: Operating Model (35.9) (35.9) (35.9) 0.0 0.0 0.0 0.0 Adjusted Non-GAAP $2,309.2 $2,540.5 $2,846.5 $2,826.5 $3,141.6 $3,677.0 $986.6 $1,012.3 Gross Profit GAAP $1,494.7 $1,627.7 $1,802.6 $1,851.8 $1,992.0 $2,314.7 $613.1 $640.0 Adjustments: Operating Model (20.4) (20.4) (20.4) 0.0 0.0 0.0 0.0 Impairment Charge 15.6 0.0 0.0 0.0 0.0 0.0 0.0 Non-GAAP $1,489.9 $1,607.3 $1,782.2 $1,851.8 $1,992.0 $2,314.7 $613.1 $640.0 Opex GAAP $859.9 $964.5 $1,106.9 $1,172.2 $1,309.1 $1,540.6 $364.3 $391.7 Adjustments: Operating Model (14.5) (14.5) (14.5) 0.0 0.0 0.0 0.0 0.0 Bad Debt Write-off 0.0 (17.6) 0.0 0.0 0.0 0.0 0.0 0.0 IT and other separation costs 0.0 0.0 0.0 (19.2) (57.1) (74.7) (1.7) (5.4) Severance and other costs 0.0 0.0 0.0 (25.3) (5.1) (11.6) (1.0) (0.5) Legal, settlements and related costs 0.0 0.0 0.0 (17.5) (9.2) (7.6) (1.5) (1.4) Other 1 0.0 0.0 (44.8) (19.1) 0.0 0.0 0.0 0.0 Non-GAAP $845.4 $932.4 $1,047.6 $1,091.1 $1,237.7 $1,446.7 $360.1 $384.4 EBIT GAAP $634.8 $663.2 $695.7 $679.6 $682.9 $774.1 $248.8 $248.3 Adjustments: Operating model (5.9) (5.9) (5.9) 0.0 0.0 0.0 0.0 0.0 Impairment Charge 15.6 0.0 0.0 0.0 0.0 0.0 0.0 Bad Debt Write-off 0.0 17.6 0.0 0.0 0.0 0.0 0.0 0.0 IT and other separation costs 0.0 0.0 0.0 19.2 57.1 74.7 1.7 5.4 Severance and other costs 0.0 0.0 0.0 25.3 5.1 11.6 1.0 0.5 Legal, settlements and related costs 0.0 0.0 0.0 17.5 9.2 7.6 1.5 1.4 Other 1 0.0 0.0 44.8 19.1 0.0 0.0 0.0 0.0 Non-GAAP $644.5 $674.9 $734.6 $760.7 $754.3 $868.0 $253.0 $255.6 Note: Quarterly results not audited. (1) For 2008, includes IPO costs. For 2009, includes IPO offset by a gain on patent settlement and sale of a non-strategic intangible asset. 2006 2007 2012 2011 2010 2008 2009 |
|
|
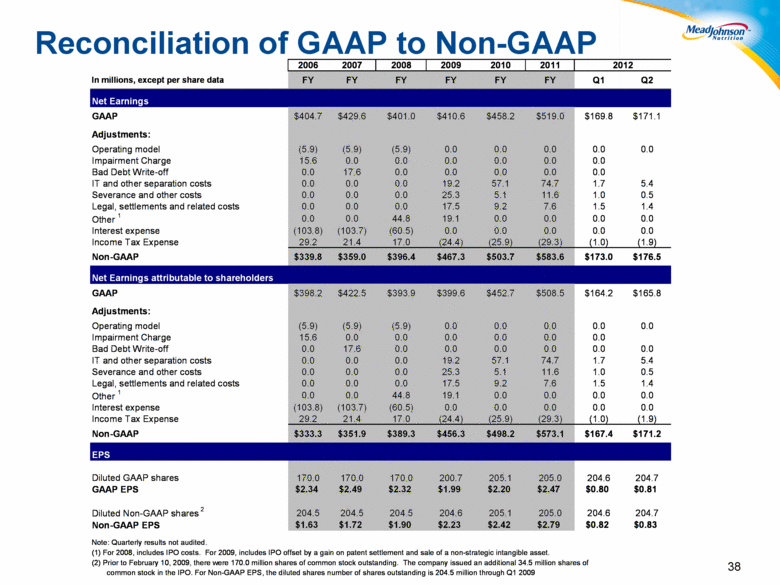
38 Reconciliation of GAAP to Non-GAAP In millions, except per share data FY FY FY FY FY FY Q1 Q2 Net Earnings GAAP $404.7 $429.6 $401.0 $410.6 $458.2 $519.0 $169.8 $171.1 Adjustments: Operating model (5.9) (5.9) (5.9) 0.0 0.0 0.0 0.0 0.0 Impairment Charge 15.6 0.0 0.0 0.0 0.0 0.0 0.0 Bad Debt Write-off 0.0 17.6 0.0 0.0 0.0 0.0 0.0 IT and other separation costs 0.0 0.0 0.0 19.2 57.1 74.7 1.7 5.4 Severance and other costs 0.0 0.0 0.0 25.3 5.1 11.6 1.0 0.5 Legal, settlements and related costs 0.0 0.0 0.0 17.5 9.2 7.6 1.5 1.4 Other 1 0.0 0.0 44.8 19.1 0.0 0.0 0.0 0.0 Interest expense (103.8) (103.7) (60.5) 0.0 0.0 0.0 0.0 0.0 Income Tax Expense 29.2 21.4 17.0 (24.4) (25.9) (29.3) (1.0) (1.9) Non-GAAP $339.8 $359.0 $396.4 $467.3 $503.7 $583.6 $173.0 $176.5 GAAP $398.2 $422.5 $393.9 $399.6 $452.7 $508.5 $164.2 $165.8 Adjustments: Operating model (5.9) (5.9) (5.9) 0.0 0.0 0.0 0.0 0.0 Impairment Charge 15.6 0.0 0.0 0.0 0.0 0.0 0.0 Bad Debt Write-off 0.0 17.6 0.0 0.0 0.0 0.0 0.0 0.0 IT and other separation costs 0.0 0.0 0.0 19.2 57.1 74.7 1.7 5.4 Severance and other costs 0.0 0.0 0.0 25.3 5.1 11.6 1.0 0.5 Legal, settlements and related costs 0.0 0.0 0.0 17.5 9.2 7.6 1.5 1.4 Other 1 0.0 0.0 44.8 19.1 0.0 0.0 0.0 0.0 Interest expense (103.8) (103.7) (60.5) 0.0 0.0 0.0 0.0 0.0 Income Tax Expense 29.2 21.4 17.0 (24.4) (25.9) (29.3) (1.0) (1.9) Non-GAAP $333.3 $351.9 $389.3 $456.3 $498.2 $573.1 $167.4 $171.2 EPS Diluted GAAP shares 170.0 170.0 170.0 200.7 205.1 205.0 204.6 204.7 GAAP EPS $2.34 $2.49 $2.32 $1.99 $2.20 $2.47 $0.80 $0.81 Diluted Non-GAAP shares 2 204.5 204.5 204.5 204.6 205.1 205.0 204.6 204.7 Non-GAAP EPS $1.63 $1.72 $1.90 $2.23 $2.42 $2.79 $0.82 $0.83 Note: Quarterly results not audited. (1) For 2008, includes IPO costs. For 2009, includes IPO offset by a gain on patent settlement and sale of a non-strategic intangible asset. (2) Prior to February 10, 2009, there were 170.0 million shares of common stock outstanding. The company issued an additional 34.5 million shares of common stock in the IPO. For Non-GAAP EPS, the diluted shares number of shares outstanding is 204.5 million through Q1 2009 2012 2011 2010 Net Earnings attributable to shareholders 2008 2009 2006 2007 |
|
|
39 |

