Attached files
| file | filename |
|---|---|
| 8-K - 8-K - INLAND REAL ESTATE CORP | a12-19762_18k.htm |
| EX-99.2 - EX-99.2 - INLAND REAL ESTATE CORP | a12-19762_1ex99d2.htm |
Exhibit 99.1
|
|
Investor Presentation Second Quarter 2012 www.inlandrealestate.com NYSE: IRC September 2012 |

|
|
IRC SNAPSHOT PROFILE Inception 1994; self-administered / self-managed as of 2000; listed on NYSE June 2004 Target Upper Midwest markets 79% of retail SF in high density infill locations in Chicago & Minneapolis MSAs 149 Neighborhood, Community, Power, Lifestyle centers and single-tenant properties 1 15 million SF of leasable area management 1 $2 billion in asset acquisition value 1 $1.9 billion total market capitalization 2 Source: Company filings. Portfolio data current as of 6/30/12 Includes one non-retail property and retail properties in unconsolidated joint ventures at 100 percent; excludes development JVs and non-owned, managed IPCC JV properties; $2B in assets based on full purchase price acquisition value. Includes pro rata share of debt related to unconsolidated joint ventures as of 6/30/12. |
|
|
EXPERIENCED LEADERSHIP TEAM Management Inland Tenure Background / Experience Mark Zalatoris President & CEO 27 yrs. Appointed president & CEO April 2008; EVP & COO 2004-2008; SVP & CFO 1994-2004; extensive knowledge of portfolio Brett Brown Executive Vice President & Chief Financial Officer 8 yrs. (15 yrs. at Great Lakes REIT) Extensive capital markets & public company reporting experience; former Great Lakes REIT SVP, Financial Reporting Scott Carr EVP & Chief Investment Officer, IRC; President, Inland Commercial Property Management Inc. (IRC subsidiary) 24 yrs. Has overseen property management operations since 1994; strong retailer relationships William Anderson Senior Vice President, Transactions 26 yrs. Skilled at analyzing, negotiating retail center acquisitions & dispositions Board of Directors Thomas D’Arcy Chairman of the Board (non-executive, independent) 7 yrs. as IRC independent director; former audit committee member (28+ yrs. in commercial real estate industry) CEO American Realty Capital Healthcare Trust; formerly President & CEO Grubb & Ellis and CEO of a publicly traded, Midwest-focused shopping center REIT SENIOR MANAGEMENT TEAM AVERAGES 24+ YEARS REAL ESTATE EXPERIENCE |
|
|
OPERATING STRATEGY Defensive portfolio – meets consumer demand for value and necessity retail Centers with grocer / drug / discount component 77% of total portfolio retail gross leasable area (GLA) 1 Resilient Midwest markets Strong demographics dense populations, high incomes, diverse economies High barriers to entry Portfolio scale in primary markets Facilitates retailer market launches, expansions and relocations Asset clustering in key submarkets Provides leasing flexibility & management efficiencies – including pricing power with vendors Notes: (1) Excludes properties held through the joint venture with IPCC. |
|
|
Leasing / portfolio management expertise produces highly occupied portfolio Local market sharp shooter Total portfolio leased occupancy: 92.9% 2Q12 (total portfolio): 112 leases signed for 378,083 SF – 30% increase in leases signed over 2Q11 Positive rental rate trends reflect strength of locations / more level playing field in lease negotiations Increases in average base rent for new leases for 6 consecutive quarters Renewal rent spreads positive every quarter even throughout economic downturn OPERATING STRATEGY Notes: (1) Based on total portfolio as of 6/30/12; tenant annual base rent information excludes assets held through JV with IPCC High quality, diversified tenant base Focus on #1, #2 grocers in primary markets: Jewel/Cub (SuperValu), Dominick’s (Safeway), Roundy’s Limit tenant exposure: no single tenant accounts for more than 3.2% of annual base rent (excluding top 3 grocer tenants) 70% annual base rent from high quality national retailers1 Total Portfolio Annual Base Rent 2Q12 by Type of Retailer |
|
|
OPERATING STRATEGY Strong balance sheet focus Sources of opportunity capital in place to fund accretive investments: $350 MM credit facilities: includes $175 MM line of credit; competitive terms, matures August 2016 ATM equity program: authorized to issue up to $100 MM in common stock; $31.7 MM sold inception through 6/30/12 Preferred stock sales: authorized to issue 12 million shares Sold total of 4.4 million shares of Series A Cumulative Redeemable Preferred Stock 9/2011 & 2/2012 for net proceeds of ≈$107.4 MM Institutional capital: PGGM contributed $130 MM 2010-2012; expect commitment up to $100 MM toward new acquisitions 2012-2014 Reducing cost of debt & extending debt maturity profile: Average rate on secured debt improved to 5.1% @ 8/31/12 from average rate of 5.4% @ 6/30/11 Average rate on unsecured debt improved to 2.7% @ 8/31/12 from 3.5% @ 6/30/11 Average term of secured debt increased to 5.7 years @ 8/31/12 from 4 years @ 6/30/11 Total debt-to-total market capitalization rate improved to 54.2% @ 6/30/12 vs. 55.9% @ 12/31/11 Joint ventures have potential to increase income & add value Formed asset-based JVs with well-regarded institutional partners New York State Teachers Retirement System (NYSTRS) & Dutch pension fund administrator / asset manager PGGM Established asset management venture with Inland Private Capital Corp. (IPCC) |
|
|
PRIMARY MARKETS Chicago and Minneapolis-St. Paul Sources: MSA average occupancy from CB Richard Ellis MarketView Second Quarter 2012 reports. Note: IRC market summary & MSA portfolio occupancy rates exclude non-retail properties & development JVs; based on IRC’s pro-rata share of properties in unconsolidated JVs. Centers are well located as demonstrated by the portfolio’s occupancy statistics Occupancy is consistently higher than core MSA averages IRC Chicago Metro Portfolio IRC Minneapolis-St. Paul Metro Portfolio MSA # of Retail Properties Total Retail GLA (MM) % of Retail Portfolio Chicago MSA 85 9,016,127 60.8% Minneapolis MSA 26 2,722,212 18.4% Other Markets 38 3,083,600 20.8% Total 149 14,821,939 100.0% IRC Market Summary @ 6/30/12 (Total Portfolio) MSA IRC Portfolio Occupancy (1) CBRE MSA Average Occupancy (1) IRC Variance to MSA Chicago MSA 91.6% 91.0% + 60 bps Minneapolis MSA 96.4% 91.9% + 450 bps Total Portfolio Leased Occupancy @ 6/30/12 |
|
|
Chicago MSA: 3rd largest metro market in the U.S. with population base of 9.5 million Economy: Gross Domestic Product (GDP) $532.3 billion; home to160 corporate headquarters, 30 Fortune 500 company HQs, 12 Fortune Global 500 companies Labor force data: 4.5 million jobs; unemployment rate 9.1% as of July 2012 CHICAGO MARKET SNAPSHOT Sources: Market information: Chicagoland Chamber of Commerce website; GDP from U.S. Dept. of Commerce Bureau of Economic Analysis (2010 data); unemployment rate: U.S. Bureau of Labor Statistics (preliminary data); retailer information: The 2011 Retail Business Market Research Handbook, published by Richard K. Miller & Associates; Melaniphy’s Chicagoland Retail Sales Report 4/12 (2011 data). Chicago-Naperville-Joliet, IL-IN-WI Retail Sector Annual Sales Market Leaders (in Order) Supermarkets $ 18.1 billion Jewel-Osco (SuperValu) Dominick’s (Safeway) General Merchandisers $ 12.6 billion Wal-Mart, Target Drug Stores $ 9.7 billion Walgreens, CVS Apparel & Accessories $ 5.5 billion Furniture & Electronics $ 5.4 billion |

|
|
MINNEAPOLIS MARKET SNAPSHOT Sources: Market information: GDP from U.S. Dept. of Commerce Bureau of Economic Analysis (2010 data); other market information sourced from the Minneapolis Chamber of Commerce and the Greater MSP Regional Economic Development Partnership (http://metromsp.org); Labor force data: Forbes, “America’s Best and Worst Job Markets” , January 2011; Unemployment rate: U.S. Bureau of Labor Statistics (preliminary data). Retailer information: The 2011 Retail Business Market Research Handbook, published by Richard K. Miller & Associates Minneapolis-St. Paul-Bloomington, MN-WI Retail Sector Annual Sales Market Leaders (in Order) Supermarkets $ 5.8 billion Cub (SuperValu), Roundy’s, Target, Byerly’s/Lund’s General Merchandisers $ 6.8 billion Target, Wal-Mart, Costco Drug Stores $ 2.4 billion Walgreens, Snyder’s Minneapolis-St. Paul MSA: 16th largest metro area in the U.S. with population base of 3.2 million Economy: GDP $199.6 billion; economic performance ranked 6th in U.S. and 44th globally in study of 150 global metro areas by Brookings Institution (2010); home to 19 Fortune 500 companies, 8 of America’s largest private companies Labor force data: 4th top job market in U.S. per Forbes ; unemployment rate 5.9% as of July 2012 |

|
|
Assets: DOMINANT REIT IN PRIMARY MARKETS IRC is the largest shopping center REIT operating in the greater Chicago & Minneapolis markets (MSAs) based on retail SF and number of assets MINNEAPOLIS-ST. PAUL MSA Data includes shopping centers plus single tenant retail properties with JVs at 100%. IRC data based on total portfolio as of 6/30/12. Peer data: owned retail GLA as of 5/12 provided by SNL. CHICAGO MSA 9,016 3,376 2,218 1,998 1,117 752 405 368 304 2,722 1,108 675 266 IRC 85 KIM 30 REG 17 DDR 9 RPAI 6 FRT 4 RPT 3 KRG 4 WRI 1 IRC 26 KIM 5 REG 5 DDR 1 Gross Leasable Area (SF in Thousands) |
|
|
STRONG MARKET DEMOGRAPHICS IRC’s retail centers are supported by strong demographics and high barriers to entry These traits enhance the portfolio’s resiliency and protect it from new supply MEDIAN 3-MILE HOUSEHOLD INCOME AVERAGE 3-MILE POPULATION IRC data source: Claritas 3-mile data as of 2011. IRC statistics include retail properties in the total portfolio and are weighted by SF (GLA ). Peer data source: ISI, based on 2011 demographic data and weighted by SF. $73,200 $69,200 $67,400 $57,900 $57,600 $57,000 $55,200 $54,600 $53,500 FRT REG IRC AKR RPAI KIM EQY DDR WRI |
|
|
TOTAL PORTFOLIO COMPOSITION GLA BY TYPE OF CENTER / ANNUAL BASE RENT BY TYPE OF TENANT (1) Data as of 6/30/12. Excludes properties held in the joint venture with IPCC. Total Portfolio GLA by Property Type Total Portfolio Annual Base Rent by Retailer Type Defensive focus: centers with grocer/drug/discount component comprise 77% of total retail GLA National and regional retailers comprise 74% of total portfolio annual base rent Jewel/Cub (SuperValu) 8% Roundy's 4% Dominick's (Safeway) 4% TJX Co. 3% Best Buy 3% Carmax 2% PetSmart 2% Bed Bath & Beyond 2% Kroger 2% Michael's 1% Ascena Retail Group 1% DSW (Retail Ventures) 1% Dick's Sporting Goods 1% Sports Authority 1% GAP 1% Dollar Tree 1% Other National Retailers 33% Regional Retailers 4% Local Retailers 26% |
|
|
(5) Includes Bed Bath & Beyond (6), BuyBuy Baby (3) (6) Includes Food 4 Less (4) (7) Includes Justice (5), Dress Barn (6), Maurice’s (6), Lane Bryant (5), Fashion Bug (1), Catherine’s (2) (8) Includes Old Navy (8),The GAP (1), The Gap Factory (1) (9) Includes Dollar Tree (16),Deal$ (2) DIVERSIFIED TENANT BASE IRC’s portfolio contains a strong and diversified tenant base IRC’s top three tenants are the leading grocers in their respective markets Source: Company filings as of 6/30/12. Notes: Based on total portfolio, excluding assets held in joint venture with IPCC. (1) Annualized rent includes joint venture partner’s pro rata share. (2) Includes Jewel (11) Cub Foods (9) (3) Includes Rainbow (5), Pick ‘N Save (2), Super Pick ‘N Save (1), Metro Market (1) (4) Includes TJ Maxx (6), Marshalls (10), Home Goods (1) Tenant Name Number of Stores Annual Base Rent (1) (in thousands) % of Annual Base Rent GLA Square Feet % of Total Square Footage Jewel / Cub (SuperValu) (2) 20 $13,644 7.78% 1,262,840 8.57% Roundy's (3) 9 7,100 4.05% 602,107 4.09% Dominick's (Safeway) 8 6,348 3.62% 527,671 3.58% TJX Companies, Inc. (4) 17 5,608 3.20% 543,297 3.69% Best Buy 6 4,721 2.69% 258,758 1.76% Carmax 2 4,021 2.29% 187,851 1.28% PetSmart 10 3,151 1.80% 242,957 1.65% Bed Bath & Beyond (5) 9 2,908 1.66% 303,118 2.06% Kroger (6) 4 2,628 1.50% 264,109 1.79% Michael's 8 2,413 1.38% 184,422 1.25% Ascena Retail Group (7) 25 2,381 1.36% 148,982 1.01% DSW Shoes (Retail Ventures) 5 2,361 1.35% 119,515 0.81% Dick's Sporting Goods 3 2,065 1.18% 215,000 1.46% The Sports Authority 3 1,851 1.06% 134,869 0.92% The GAP (8) 10 1,832 1.04% 147,988 1.00% Dollar Tree (9) 18 1,832 1.04% 190,887 1.30% Total 157 $64,864 37.00% 5,334,371 36.22% Total Portfolio Major Tenant Summary (1% or More of Annual Base Rent) |
|
|
Tenant # Leases Signed by IRC Annual Base Rent Roundy’s / Pick ‘N Save 6 Leases $ 3.9 Million Kroger / Food 4 Less 4 Leases $ 2.6 Million Dollar Tree 17 Leases $ 1.7 Million Ross Dress for Less 6 Leases $1.5 Million Gordmans 3 Leases $1.5 Million JoAnn Stores 7 Leases $ 1.4 Million Hobby Lobby 2 Leases $ 1.2 Million Ulta 5 Leases $1.1 Million BuyBuy Baby 3 Leases $ 1.0 Million Party City 4 Leases $ 0.7 Million Famous Footwear 6 Leases $ 0.7 Million Old Navy 3 Leases $ 0.7 Million PetSmart 2 leases $ 0.7 Million TJX Co. 2 Leases $ 0.5 Million Five Below 2 Leases $ 0.2 Million LEASING EFFICIENCIES Market Concentration Facilitates Multiple Lease Signings Note: Data reflects in-place leases signed by IRC 2004 to 6/30/12; excludes leases that were already in place when properties were acquired by IRC. Annual base rent is based on June 2012 rent annualized. |
|
|
2Q12 was 6th consecutive quarter of positive spreads on new leases & continued positive leasing spreads on renewals; reflects strength of locations & more level playing field with regard to lease negotiations TOTAL PORTFOLIO RENT SPREADS OPERATING FUNDAMENTALS POSITIVE LEASING SPREADS + 6.4% + 17.5% + 8.2% + 5.2% + 5.3% + 8.6% + 11.0% +7.4% + 8.2% + 2.9% $10.51 $11.56 $12.19 $11.35 $14.11 $10.66 $13.86 $13.83 $15.95 $14.52 $11.67 $12.51 $12.55 $12.19 $15.01 $12.52 $14.59 $15.02 $17.26 $15.29 2Q11 Renewals 2Q11 New Leases 3Q11 Renewals 3Q11 New Leases 4Q11 Renewals 4Q11 New Leases 1Q12 Renewals 1Q12 New Leases 2Q12 Renewals 2Q12 New Leases Former Average Base Rent Per Sq. Ft. New Average Base Rent Per Sq. Ft. |
|
|
For 2Q12 consolidated same store NOI increased 4.2% over 2Q11 -- sixth consecutive quarter-over-quarter increase Increases in same store NOI achieved through aggressive leasing and asset repositioning initiatives CONSOLIDATED PORTFOLIO SAME STORE NOI GROWTH (%) OPERATING FUNDAMENTALS SAME STORE NET OPERATING INCOME (NOI) GROWTH Sources: SNL Financial and company filings. Peer average includes AKR, CDR, DDR, EQY, FRT, KIM, KRG, REG, RPT and WRI -7.9% -7.6% 1.8% 5.7% 3.5% 8.7% 5.7% 4.2% -10% -8% -6% -4% -2% 0% 2% 4% 6% 8% 10% 2009 2010 1Q11 2Q11 3Q11 4Q11 1Q12 2Q12 IRC Peer Average |
|
|
RE-DEVELOPMENT OF EXISTING ASSETS VALUE ENHANCEMENT INITIATIVES Invested $39 MM in retailer driven, value-add initiatives 2005-2012 Added 187,000 SF of gross leasable area (GLA) Generated annual gross revenue over $11 MM 1 Average annual return on investment (ROI): 28.2% 2 Case study: Rivertree Court, Vernon Hills, IL Theater conversion & GLA expansion for new tenant Gordmans Completed 2011 Cost: $3.3 MM; ROI: 22.0% Other repositioning activities at Rivertree: relocated Michaels & Office Depot within center to create space for Old Navy & Ross stores Notes: (1) Annual rent & recoveries from leases signed with tenants as a result of value-add initiatives; (2) Annual return on investment (ROI ) based on new capital & actual lease up. Before After |
|
|
Established primarily as a way to expand portfolio Add completed assets to portfolio at market discount or sell for a profit JV structure leverages unique strengths of each partner Developers skilled at sourcing sites, securing big-box anchors IRC contributes financing, leasing / property management expertise to enhance productivity of developments Focused on completing existing active projects / reducing cost basis Currently marketing completed buildings & remaining parcels to retailers Negotiated discounted payoff of loan on North Aurora Towne Center – paid $10 MM to retire $30.5 MM loan Status of existing projects Orchard Crossing completed – added this 118,888 SF Target anchored center to consolidated portfolio 2/2011 Savannah Crossing nearly complete Sold pads to Walmart, Walgreens, Fifth Third Bank, & Sonic, as well as 100% leased multi-tenant building (all open & operating) Expect to sell remaining outlots & 2nd completed multi-tenant building upon lease-up Southshore – re-developed big-box; pursuing leases with national retailers; expect to sell upon stabilization “Land held for development”: North Aurora Towne Center: retired acquisition loan at 66% discount, dissolved JV & consolidated property 2Q12 Lantern Commons & Lakemoor Savannah Crossing DEVELOPMENT JV PROJECTS Inland Venture Corporation / Expanded Taxable REIT Subsidiary Orchard Crossing: Completed |

|
|
INVESTMENT STRATEGY Pursue grocery-anchored & value-based retail in demographically strong Midwest markets Recycle proceeds from disposition of non-core assets into higher growth opportunities Balance acquisitions in primary markets with investments in strong secondary markets to achieve higher returns on investment Purchasing assets in IRC’s current primary markets, e.g., Chicago & Minneapolis-St. Paul metro areas Acquiring Class A assets in select secondary markets, e.g. Greater Cincinnati, select suburbs of Cleveland In secondary markets, can achieve higher yields: 50-100+ basis points over primary markets Equally compelling demographics Same high-quality national retailer rent rolls Investment goals: Expand presence in new Midwest markets Achieve blended leveraged yield over 9% Westgate Fairview Park, OH Acquired 3/2012 Stone Creek Cincinnati, OH Acquired 1/2011 Joffco Square Chicago, IL Acquired 1/2011 Silver Lake Village St. Anthony, MN Acquired 2/2012 |

|
|
As of 6/30/2012; acquisitions are shown on positive axis & dispositions are shown on negative axis; includes sold core properties and properties acquired through unconsolidated joint ventures at 100 percent. Excludes IPCC JV acquisitions that were completed with no equity contribution from IRC. Acquisition value represents full purchase price, including potential earn-outs. TRANSACTION HISTORY 8.42% weighted average cap rate for assets acquired 1995 – 20121 Over half of portfolio acquisitions have been principal to principal transactions; typically get best pricing in private deals IRC/NYSTRS/PGGM Acquisitions IPCC Acquisitions Dispositions Acquisition Cap Rate $278.1 $111.2 $238.3 $241.6 PORTFOLIO ACQUISITION HISTORY (1) $17.8 $77.4 $181.8 $365.8 $298.3 $43.3 $3.3 $207.2 $78.0 $75.3 $143.8 $150.1 $181.4 $2.4 $8.4 $12.0 $24.6 $6.2 $15.7 $29.6 $14.8 $6.6 $17.7 $8.2 $7.9 -2.0% -1.0% 0.0% 1.0% 2.0% 3.0% 4.0% 5.0% 6.0% 7.0% 8.0% 9.0% 10.0% 11.0% ($50) ($25) $0 $25 $50 $75 $100 $125 $150 $175 $200 $225 $250 $275 $300 $325 $350 $375 1995 1996 1997 1998 1999 2000 2001 2002 2003 2004 2005 2006 2007 2008 2009 2010 2011 2012 Weighted Average Cap Rate Dispositions / Acquisitions ($MM) |
|
|
MAINTAINING A STRONG BALANCE SHEET Balance sheet objectives 2012 Enhance liquidity, provide growth capital for acquisitions ATM program: sold 3.8 million common shares @ average price of $8.52/share since inception; net proceeds of $31.7 MM utilized primarily for IPCC JV acquisitions Issued 8.125% Series A Cumulative Redeemable Preferred Stock: proceeds used primarily for acquisitions Sept. 2011: sold 2.0 million shares Series A Preferred @ $25/share for net proceeds of $48.4 MM Feb. 2012: sold 2.4 million shares Series A Preferred @ $25.3906/share for net proceeds of $59.0 MM; equal to effective yield of 8.0% Continue to reduce cost & improve terms of debt, extend / rebalance debt maturity profile Closed ≈ $244 MM of new & refinanced secured loans for the total portfolio 1/1/12-8/31/12 with weighted average rate of 4.7% and weighted average term of 9.1 years Amended consolidated unsecured credit facilities: increased capacity, reduced cost of borrowing, extended term & rebalanced maturity schedule Increased capacity to $350 MM (line of credit & term loan facilities each increased to $175 MM from $150 MM) Improved rate on borrowings by 35 bps to 55 bps – expect annual interest expense savings of $1.3 MM at current debt levels Added investment grade pricing grid Extended term / un-linked term loan & line of credit facility – new maturity dates: line of credit facility 8/2016; term loan 8/2017 Long term capital plan goals Achieve debt-to-market cap rate below 50% through stock price appreciation & directing portion of future equity raises toward de-levering Target net debt-to-total EBITDA ratio: below 7x Secure investment grade status |

|
|
CONSOLIDATED DEBT MATURITIES CONSOLIDATED DEBT AS OF 8/31/12 Term Loan - Bank Group Term Loan - Wells Fargo Notes: Secured debt includes principal amortization through maturity. $172.4 $224.6 $50.3 $14.8 $143.2 $20.0 $49.6 $70.3 $113.2 $175.0 $50.0 $29.2 $55.0 2012 2013 2014 (1) 2015 2016 2017 2018 2019 2020 2021 2022 |
|
|
JOINT VENTURE GROWTH STRATEGIES Diversify Capital Resources + Expand Platform + Drive Future Growth Asset Management and Asset Based Joint Venture Strategies Retail Focus IRC Knowledge High Quality Partners ‘Union of Expertise’ Long-term Asset Management Role Value-enhancing |
|
|
$3.4 MM $3.3 MM $1.6 MM $4.6 MM $3.6 MM $6.0 MM $1.1 MM $1.2 MM $1.7 MM $1.9 MM $2.8 MM $1.9 MM JOINT VENTURE FEE INCOME Total joint venture fee income compound annual growth rate 30% (2006-2011) IPCC venture: generated ~$14.1 MM of acquisition & property management fee income 2006-20111 NYSTRS JV: provided ~$7.2 MM of fee income 2006-2011 1 PGGM JV: provided ~$1.1 MM of fee income 2010-2011 1 Notes: (1) Property management JV fee income includes leasing commissions. (2) “Other JV “includes NYSTRS, PGGM, TMK, NARE, Hastings and Pine Tree. TOTAL JOINT VENTURE FEE INCOME PROPERTY/ASSET MANAGEMENT JV FEE INCOME ONLY IPCC JV Other JV 2 $24.6 MM $ 12.5 MM Source: Company and company filings as of 6/30/12 $2.1 MM $1.9 MM $1.4 $1.0 $1.4 $1.2 $1.5 $2.0 $1.4 $1.1 $1.0 $1.4 $1.2 $1.3 $1.9 $1.4 $0.2 $2.4 $3.2 $2.1 $2.1 $4.0 $0.7 $0.2 $0.3 $0.7 $0.6 $0.9 $0.5 2006 2007 2008 2009 2010 2011 1H12 2006 2007 2008 2009 2010 2011 1H12 |
|
|
ASSET MANAGEMENT VENTURE Inland Private Capital Corporation (IPCC) Venture formed 2006 to leverage growth potential of 1031 exchange business IRC provides acquisition / asset management expertise & balance sheet capacity IPCC provides syndication expertise and access to large broker / dealer network IRC earns valuable fee income for providing asset acquisition and long-term management services 2007-2011: IRC-IPCC venture acquired ≈$481.3 MM worth of assets Investors include all-cash investors as well as 1031 exchange investors seeking to shelter gains Interests in assets acquired during this period are 100% sold to tenant-in-common investors IRC can typically recycle equity invested in the venture at least twice per 12-month period 2012: IRC-IPCC venture has acquired ≈$77 MM worth of assets1; annual target: ≈$100 MM Notes: (1) As of 6/30/12. Fox Run Square Naperville, IL Honey Creek Commons Terre Haute, IN |
|
|
JOINT VENTURE WITH NYSTRS New York State Teachers Retirement System Joint venture formed in 2004 to acquire Midwest retail assets JV portfolio currently includes $347 MM in assets (acquisition value) 1 $189 MM in assets contributed by IRC to the JV $158 MM in assets acquired for the JV 2004-2006 Allocated capital is fully invested Term of JV extended through June 2022 Note: (1) Includes earnouts. Orland Park Place – Orland Park, IL |

|
|
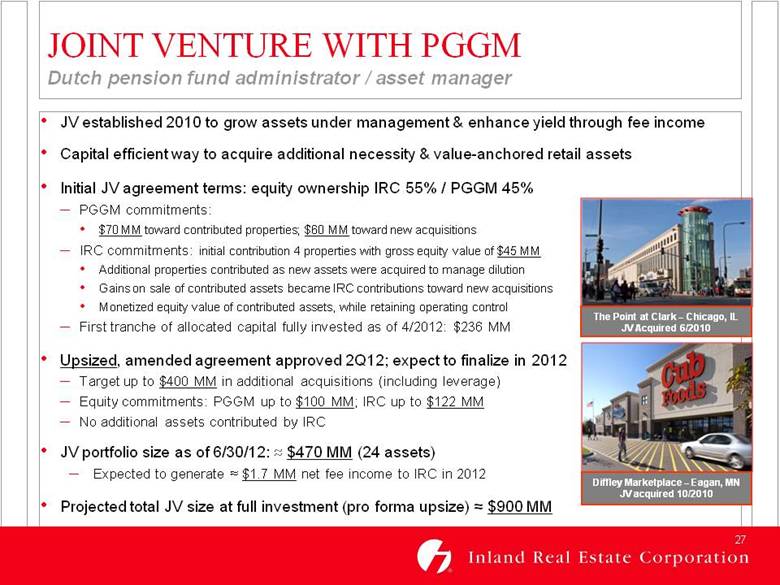
JOINT VENTURE WITH PGGM Dutch pension fund administrator / asset manager JV established 2010 to grow assets under management & enhance yield through fee income Capital efficient way to acquire additional necessity & value-anchored retail assets Initial JV agreement terms: equity ownership IRC 55% / PGGM 45% PGGM commitments: $70 MM toward contributed properties; $60 MM toward new acquisitions IRC commitments: initial contribution 4 properties with gross equity value of $45 MM Additional properties contributed as new assets were acquired to manage dilution Gains on sale of contributed assets became IRC contributions toward new acquisitions Monetized equity value of contributed assets, while retaining operating control First tranche of allocated capital fully invested as of 4/2012: $236 MM Upsized, amended agreement approved 2Q12; expect to finalize in 2012 Target up to $400 MM in additional acquisitions (including leverage) Equity commitments: PGGM up to $100 MM; IRC up to $122 MM No additional assets contributed by IRC JV portfolio size as of 6/30/12: ≈$470 MM (24 assets) Expected to generate ≈$1.7 MM net fee income to IRC in 2012 Projected total JV size at full investment (pro forma upsize) ≈$900 MM The Point at Clark – Chicago, IL JV Acquired 6/2010 Diffley Marketplace – Eagan, MN JV acquired 10/2010 |
|
|
JOINT VENTURE WITH PGGM JV Structure IRC-PGGM JOINT VENTURE Target Portfolio Gross Value at Full Investment ≈$900MM Pro Forma Negotiated Upsized Agreement Equity Ownership: 55% IRC / 45% PGGM Timing Matched Pro Forma Negotiated Upsized Agreement IRC Growth Capital For Future Property Acquisitions : Cash up to $122MM PGGM Growth Capital For Property Acquisitions 2010-2012: Cash $60MM Pro Forma Negotiated Upsized Agreement Future Property Acquisitions Up to $400MM Gross Value Pro Forma Negotiated Upsized Agreement PGGM Growth Capital For Future Property Acquisitions: Cash up to $100MM IRC Subsequent Contributions 9 Properties $186MM Gross Value PGGM Subsequent Cash Contributions $50MM PGGM Initial Cash Contribution $20MM IRC Initial Property Contribution 4 Properties $45MM Gross Value IRC Growth Capital For Property Acquisitions 2010-2012: Gains on Sale from Contributed Properties Property Acquisitions 2010-2012: $236MM Gross Value (Total JV Portfolio Gross Value @ 8/31/12 : $470MM) |
|
|
IRC has built a solid foundation for future growth Necessity & value-based retail in high barrier to entry markets should outperform other retail real estate over time Centers impacted by big-box vacancies have been re-tenanted with high credit quality, best-in-class retailers that drive additional traffic, attract other retailers and enhance the value of our centers IRC is growing assets under management and income through capital efficient joint ventures Senior management team has experience successfully managing through economic cycles Senior management averages 24+ years real estate experience Independent board members include two well-respected former CEOs of public shopping center companies IRC is executing a long term capital plan that has strengthened its financial position and provides ongoing flexibility SUMMARY |
|
|
FORWARD-LOOKING STATEMENTS Certain statements in this presentation constitute "forward-looking statements" within the meaning of the Federal Private Securities Litigation Reform Act of 1995. These forward-looking statements are not historical facts but are the intent, belief or current expectations of our management based on their knowledge and understanding of the business and industry, the economy and other future conditions. These statements are not guarantees of future performance, and investors should not place undue reliance on forward-looking statements. Actual results may differ materially from those expressed or forecasted in the forward-looking statements due to a variety of risks, uncertainties and other factors, including but not limited to the factors listed and described under “Risk Factors” in our Annual Report on Form 10-K for the year ended December 31, 2011 as may be updated or supplemented by our Form 10-Q filings. These factors include, but are not limited to: market and economic challenges experienced by the U.S. economy or real estate industry as a whole, including dislocations and liquidity disruptions in the credit markets; the inability of tenants to continue paying their rent obligations due to bankruptcy, insolvency or a general downturn in their business; competition for real estate assets and tenants; impairment charges; the availability of cash flow from operating activities for distributions and capital expenditures; our ability to refinance maturing debt or to obtain new financing on attractive terms; future increases in interest rates; actions or failures by our joint venture partners, including development partners; and other factors that could affect our ability to qualify as a real estate investment trust. We undertake no obligation to update or revise forward-looking statements to reflect changed assumptions, the occurrence of unanticipated events or changes to future operating results. |