Attached files
| file | filename |
|---|---|
| 8-K - FORM 8-K - Hanesbrands Inc. | d405083d8k.htm |
| EX-99.1 - PRESS RELEASE - Hanesbrands Inc. | d405083dex991.htm |
| EX-99.2 - UPDATED SUPPLEMENTAL INFORMATION REGARDING DISCOUNTINUED OPERATIONS - Hanesbrands Inc. | d405083dex992.htm |
 Investor Presentation 2012
Updated September 5, 2012
Exhibit 99.3 |
 2
Forward-looking Statements and Continuing Operations
These presentation slides and the related presentation include forward-looking statements
within the meaning of Section 27A of the Securities Act of 1933 and Section 21E of the
Securities Exchange Act of 1934. Forward-looking statements include all statements that
do not relate solely to historical or current facts, and can generally be identified by the
use of words such as “may,” “believe,” “will,”
“expect,” “project,” “estimate,” “intend,”
“anticipate,” “plan,” “continue” or similar expressions. Forward-looking statements inherently
involve many risks and uncertainties that could cause actual results to differ materially from
those projected in these statements. Where, in any forward-looking statement, we
express an expectation or belief as to future results or events, such expectation or belief
is based on the current plans and expectations of our management and expressed in good faith
and believed to have a reasonable basis, but there can be no assurance that the
expectation or belief will result or be achieved or accomplished. The following include
some but not all of the factors that could cause actual results or events to differ materially
from those anticipated: •
current economic conditions, including consumer spending levels and the price elasticity of
our products; •
the impact of significant fluctuations and volatility in various input costs, such as cotton
and oil-related materials, utilities, freight and wages; •
the highly competitive and evolving nature of the industry in which we compete; •
the loss of or material reduction in sales to any of our top customers; •
our ability to successfully manage social, political, economic, legal and other conditions
affecting our domestic and foreign operations and supply-chain sources; •
our debt and debt service requirements that restrict our operating and financial flexibility
and impose interest and financing costs; and •
other risks identified from time to time in our most recent Securities and Exchange Commission
reports, including our annual report on Form 10-K, quarterly reports on Form
10-Q and current reports on Form 8-K, registration statements, press
releases and other communications. Except as required by law, we undertake no obligation to update or revise forward-looking
statements to reflect changed assumptions, the occurrence of unanticipated events or
changes to future operating results over time. In the second quarter of 2012, the company announced exiting certain international and
domestic imagewear businesses that are all now classified as discontinued operations.
Unless otherwise noted, all financial results in this presentation are GAAP measures for
continuing operations. Information on discontinued operations and financial results for
prior-period continuing operations is available in the investors section of the
company’s corporate website, http://tiny.cc/HanesBrandsIR, and is also available in the company’s
second quarter 2012 Form 10-Q filing. |
 3
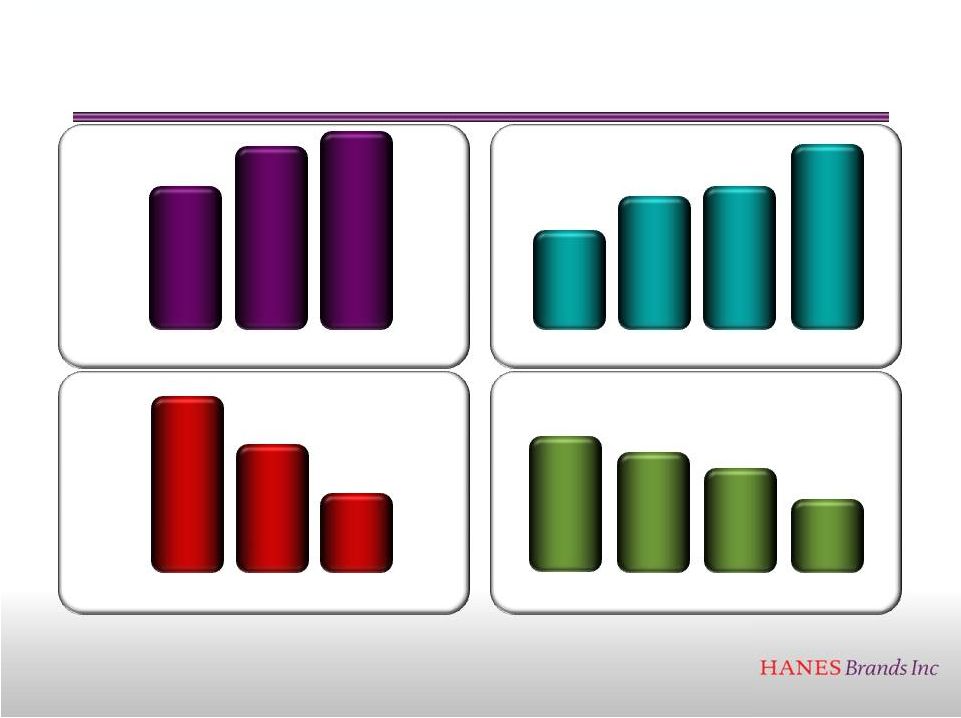
HanesBrands’
financial performance has improved since the recession with both net sales and
diluted EPS increasing and leverage decreasing. While a
mid-cap consumer company, we have two brands with more than a billion
dollars in sales at retail with global potential to drive future growth.
For reconciliation to GAAP, please see press releases dated January 27, 2011, February
15, 2012, July 31, 2012 and our other public filings, all of which are available under the “Investor”
tab on our website at
www.hanesbrands.com
Net Sales
($
billions)
$4.1
$4.4
$4.52
o
$4.57
2010
2011
2012
Guidance
Diluted EPS
($
per share)
$1.97
$2.44
$2.50
to
$2.60
2010
2011
2012
Guidance
low
$3.00
range
2013
Prelim
t
Net
Debt/
EBITDA
2010
4.7x
3.8x
~3.0
x
2011
2012
Long
Term Debt Goals
($
billions)
$2.0
$1.5
2010
Actual
2011
Actual
$1.8
$1.0
2013
2012
Net debt defined as short and long-term debt minus cash; For 2012 ~3.0x assumes
current guidance Long-term debt goals reflect year-ending debt
levels - |
 4
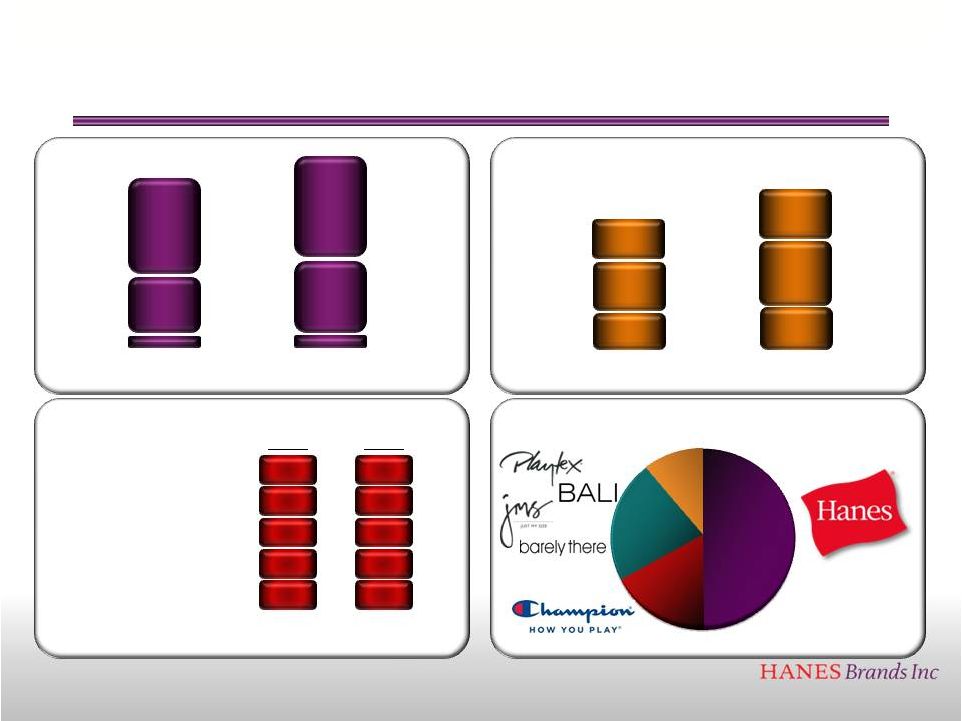
HanesBrands is growing and gaining share throughout the
Americas and Asia by leveraging its very large brands
Asia
Latin
America
Canada
+15%
Innerwear
Outerwear
DTC
+6%
Men’s Underwear
Bras
Panties
Socks
Sheer Hosiery
2005
2011
2010
2011
2010
2011
#1
#2
#2
#1
#1
#1
#1
#1
#1
#1
Brands grouped by retail $ sales; Chart shows proportions of Hanesbrands net sales
Source: NPD Group/Consumer Tracking Service, R12 Dec, Unit Share
Percent change reflects international sales dollar change as reported
Percent change reflects domestic sales dollar change
$1B
Brand
$100MM -
$1B Brands
Small
Brands
$4B
Brand
4
Growing in the USA
Gaining Share
Growing in the Developing World
Building Very Large Brands |
 5
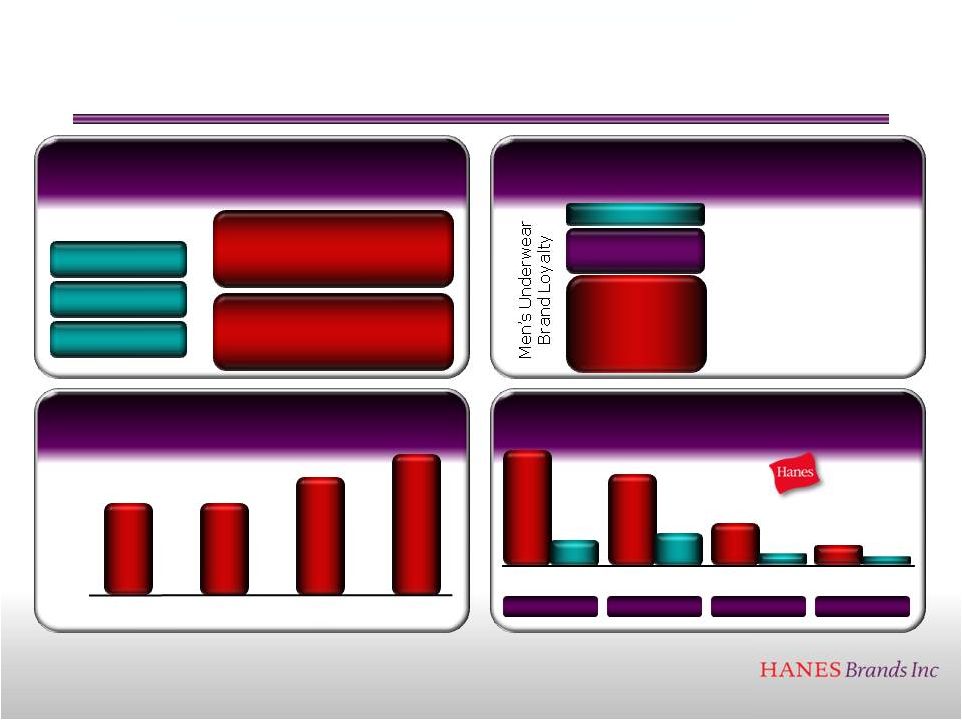
Consumers demand brands in our categories. For example, consumers value brands
much more than price in men’s underwear, and the category exhibits
characteristics similar to other highly branded categories such as
toothpaste and razors. Brands are beating private label
Brands are important to consumers
Consumers are loyal to brands
Hanes beats all other brands
#1 -
Brand
#2 -
Comfort
#3 -
Price
80% of consumers
know what brand of underwear
they are wearing
Nearly 40% admit they do not
know how much they paid
for their own underwear
Purchase
Decision Drivers
Source: Company Research
National Brands as a % of Men’s Underwear Sales
77%
77%
83%
85%
2008
2009
2010
2011
Source: NPD Panel Data R12 Dec Dollar Share
Source: NPD Accupanel
62%
10%
27%
Brand Loyalists
Bi-Branders
Brand Switchers
Consumer
Preference: vs Comp “A”
47%
10%
37%
13%
17%
7%
Intimate
Apparel
Men’s
Apparel
Kid’s
Apparel
Women’s
Apparel
4.7x
2.8x
4.2x
2.3x
Source: Retailing Today TOP BRANDS 2010 Report
4%
3% |
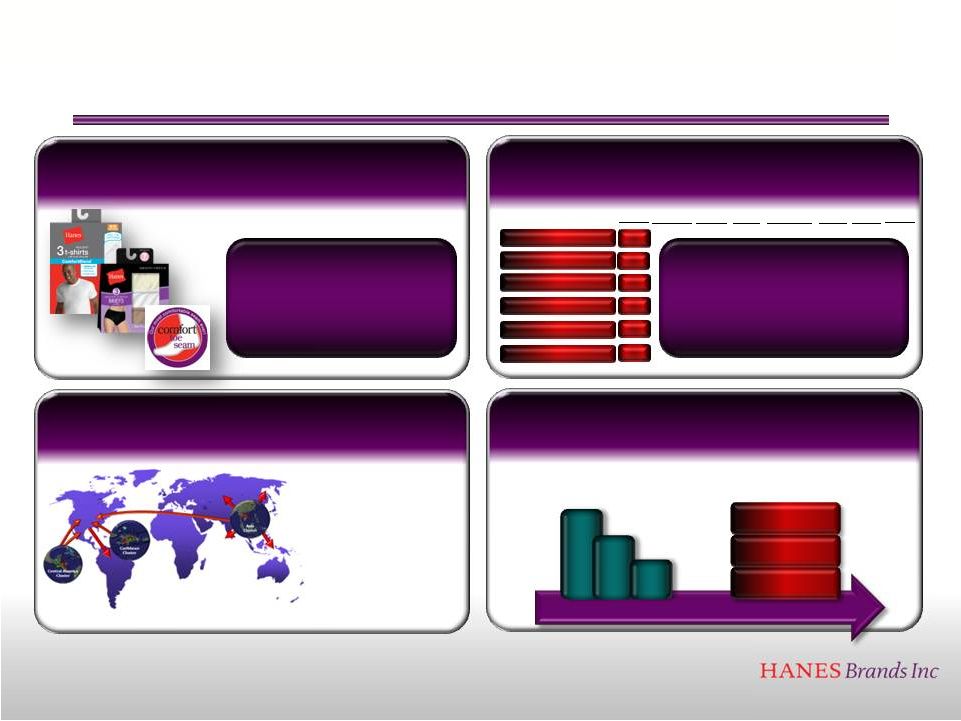 4.
Deploy our cash flow
to maximize returns to shareholders
We have four strategies to drive profitable growth
3.
Leverage our global supply chain
and overhead to improve margins
1.
Leverage brands and product
innovation to drive profitable growth
More volume
equals lower cost
Serves 90%+
of Global GDP in a
trade-advantaged
manner
After reducing debt, our flexible capital structure enables
us to make bolt-on acquisitions or return cash to shareholders
2.
Use our brand strength to fill
distribution voids in the US
Source: NPD Group/Consumer Tracking Service, R12 Dec 2011
Walmart
Target
Kohl’s
JCPenney
Kmart
Macys
Outlet
Stores
Our goal is to not only be #1
in every category in which we
compete, but to be #1 in every
sub-category, and at every account
Socks
Male Underwear
Intimate Apparel
#1
Casualwear
Activewear
#1
#1
#1
#1
#1
Hosiery
Total
Stores
2011 -
2013
2014 +
Debt
Reduction
Drive higher-priced,
higher-margin products
Address consumer needs with
continual product innovation
Selective
Acquisitions
Stock Buybacks
Dividends
6 |
 7
2012 Guidance
•
Full-year net sales are expected to be $4.52 billion to $4.57 billion, approximately 2
percent to 3 percent over last year
•
Full-year diluted EPS is expected to be in the range of $2.50 to $2.60 versus last
year’s diluted EPS of $2.44
•
Free cash flow is projected to be in the range of $400 million to $500 million
•
Expected long-term bond debt for year-ending 2012 is $1.5 billion
Future
Outlook
–
as
of
September
5,
2012
Guidance
Assumptions,
GAAP
Reconciliation
and
Discontinued
Operations
Please
see
press
releases
dated
September
5,
2012,
July
31,
2012
and
April
19,
2012
and
our
other
public
filings,
all
of
which
are
available
under
the
“Investor”
tab
on
our
website
at
www.hanesbrands.com
2013 Preliminary
•
•
Full-year diluted EPS is expected to be in the low $3.00 range
Expect to prepay the $500 million of 8 percent fixed rate notes leaving long-term bond
debt for year- ending 2013 at $1 billion |