Attached files
| file | filename |
|---|---|
| 8-K - FORM 8-K - HEALTHCARE REALTY TRUST INC | d406568d8k.htm |
Exhibit 99.1
|
|
Investor Presentation
September 2012
HEALTHCARE
REALTY
In addition to the historical information contained within, the matters discussed in this presentation contain forward-looking statements that involve estimates, assumptions, risks and uncertainties. These risks are discussed in filings with the Securities and Exchange Commission by Healthcare Realty Trust, including its Annual Report on Form 10-K for the year ended December 31, 2011 under the heading “Risk Factors,” and as may be updated in its Quarterly Reports on Form 10-Q filed thereafter. Forward-looking statements represent the Company’s judgment as of the date of this presentation. The Company disclaims any obligation to update forward-looking material.
Information as of June 30, 2012, unless otherwise disclosed.
|
|
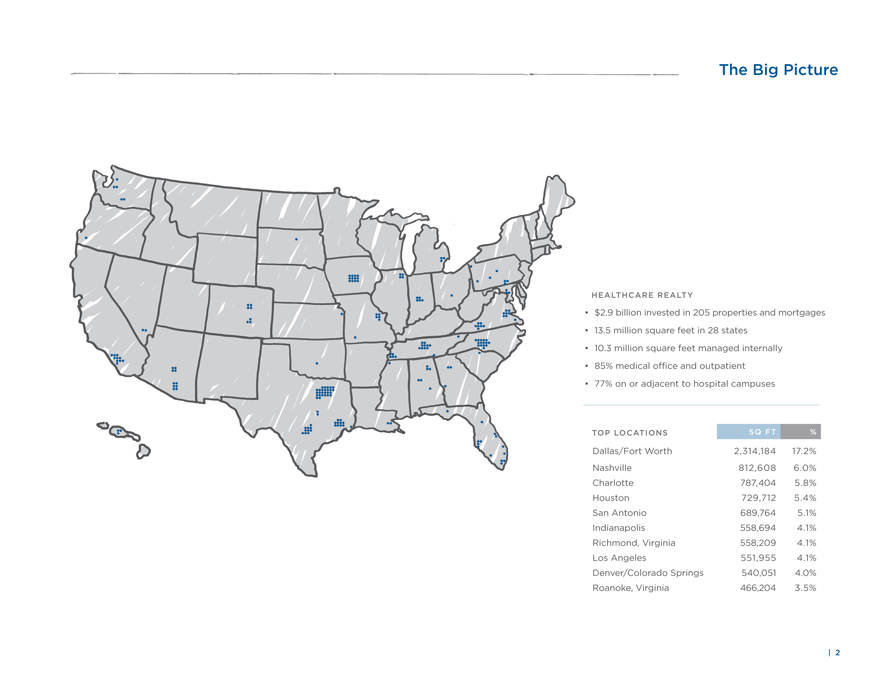
The Big Picture
HEALTHCARE REALTY
• $2.9 billion invested in 205 properties and mortgages
• 13.5 million square feet in 28 states
• 10.3 million square feet managed internally
• 85% medical office and outpatient
• 77% on or adjacent to hospital campuses
TOP LOCATIONS SQ FT %
Dallas/Fort Worth 2,314,184 17.2%
Nashville 812,608 6.0%
Charlotte 787,404 5.8%
Houston 729,712 5.4%
San Antonio 689,764 5.1%
Indianapolis 558,694 4.1%
Richmond, Virginia 558,209 4.1%
Los Angeles 551,955 4.1%
Denver/Colorado Springs 540,051 4.0%
Roanoke, Virginia 466,204 3.5%
| 2
|
|
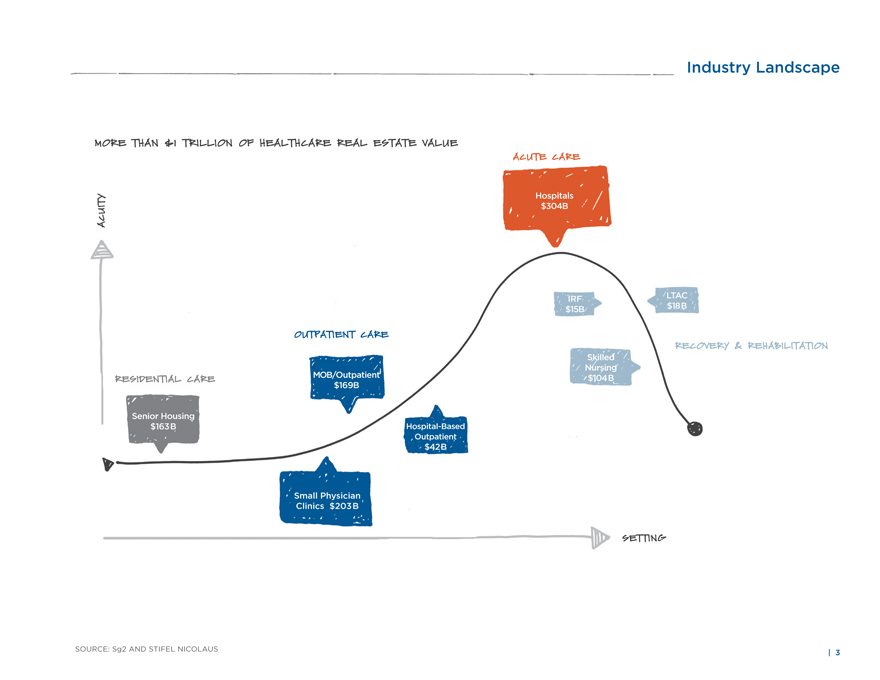
Industry Landscape
MORE THAN $1 TRILLION OF HEALTHCARE REAL ESTATE VALUE
ACUITY
RESIDENTIAL CARE
Senior Housing $163B
OUTPATIENT CARE
MOB/Outpatient $169B
Small Physician Clinics $203B
Hospital-Based
Outpatient
$42B
ACUTE CARE
Hospitals $304B
IRF $15B
Skilled Nursing $104B
LTAC $18B
RECOVERY & REHABILITATION
SETTING
SOURCE: Sg2 AND STIFEL NICOLAUS
| 3
|
|
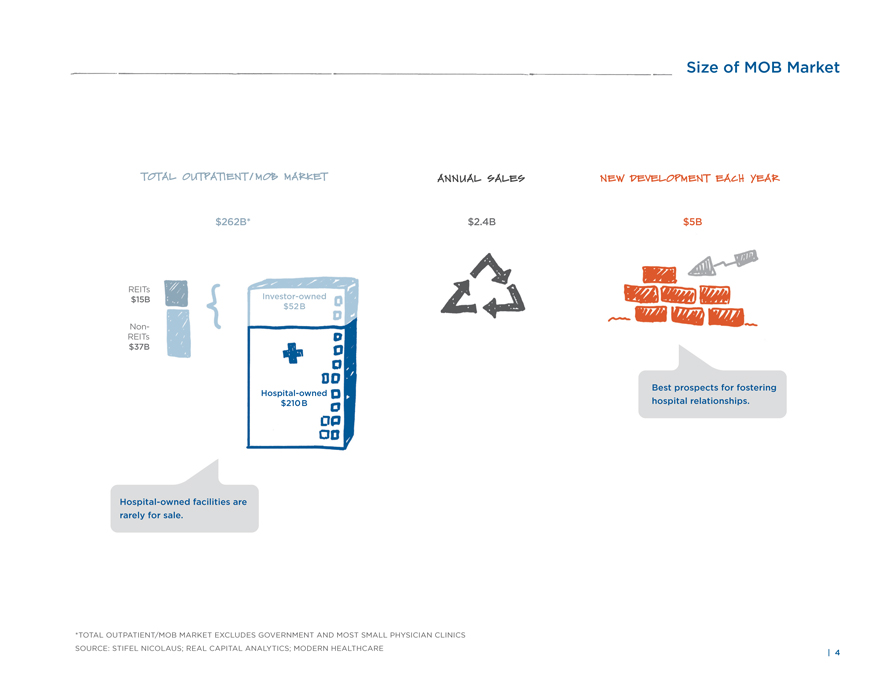
Size of MOB Market
TOTAL OUTPATIENT / MOB MARKET
ANNUAL SALES
NEW DEVELOPMENT EACH YEAR
$262B*
$2.4B
$5B
REITs $15B
Non-REITs $37B
Investor-owned $52B
Hospital-owned $210B
Hospital-owned facilities are rarely for sale.
Best prospects for fostering hospital relationships.
*TOTAL OUTPATIENT/MOB MARKET EXCLUDES GOVERNMENT AND MOST SMALL PHYSICIAN CLINICS SOURCE: STIFEL NICOLAUS; REAL CAPITAL ANALYTICS; MODERN HEALTHCARE
| 4
|
|
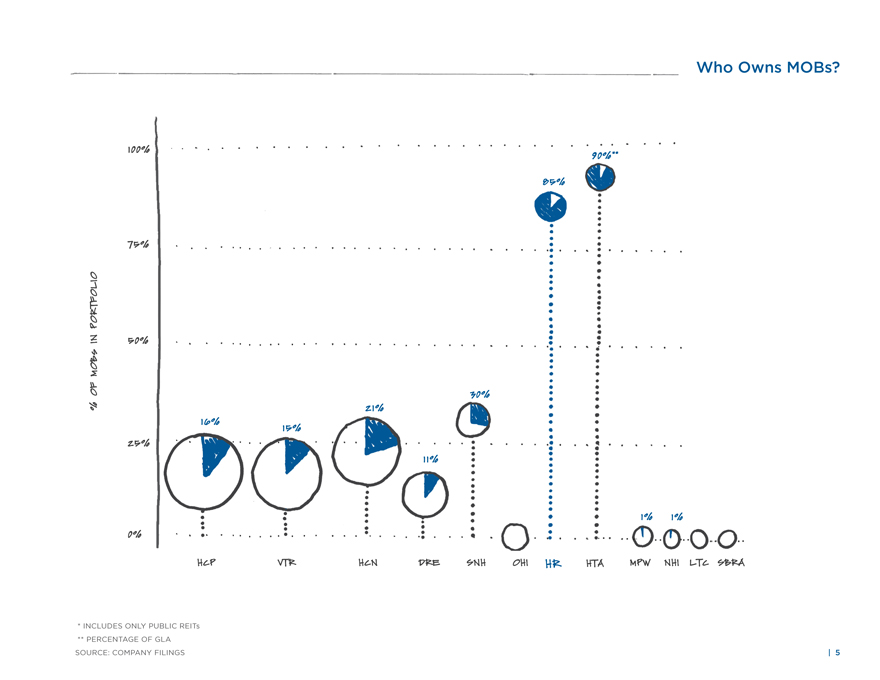
Who Owns MOBs?
% OF MOBs IN PORTFOLIO
100%
90% **
85%
75%
50%
30%
21%
16%
15%
25%
11%
1%
1%
0%
HCP
VTR
HCN
DRE
SNH
OHI
HR
HTA
MPW
NHI
LTC
SBRA
* INCLUDES ONLY PUBLIC REITs
** PERCENTAGE OF GLA
SOURCE: COMPANY FILINGS
| 5
|
|
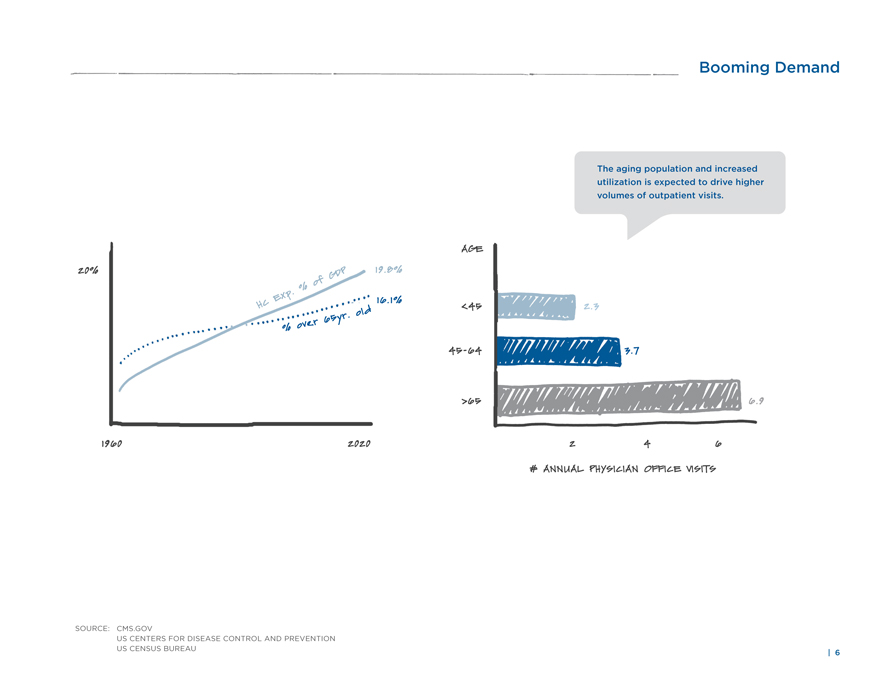
Booming Demand
The aging population and increased utilization is expected to drive higher volumes of outpatient visits.
AGE
20%
HC Exp. % of GDP
19.8%
% over 65yr. old
16.1%
<45
2.3
45-64
3.7
>65
6.9
1960
2020
2
4
6
# ANNUAL PHYSICIAN OFFICE VISITS
SOURCE: CMS.GOV
US CENTERS FOR DISEASE CONTROL AND PREVENTION US CENSUS BUREAU
| 6
|
|
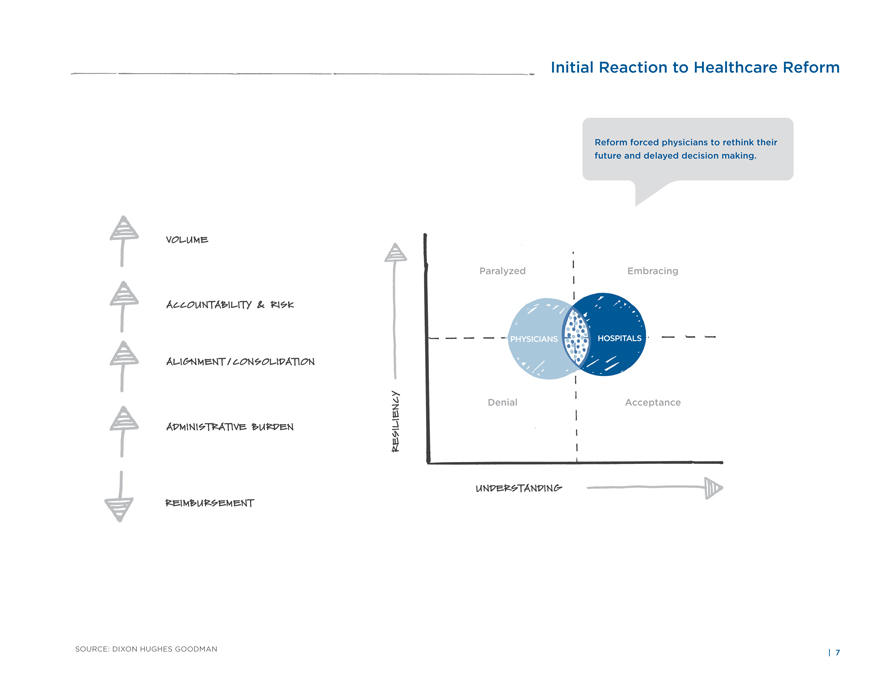
Initial Reaction to Healthcare Reform
Reform forced physicians to rethink their future and delayed decision making.
VOLUME
ACCOUNTABILITY & RISK
ALIGNMENT / CONSOLIDATION
ADMINISTRATIVE BURDEN
REIMBURSEMENT
RESILIENCY
Paralyzed
Embracing
PHYSICIANS
HOSPITALS
Denial
Acceptance
UNDERSTANDING
SOURCE: DIXON HUGHES GOODMAN | 7
|
|
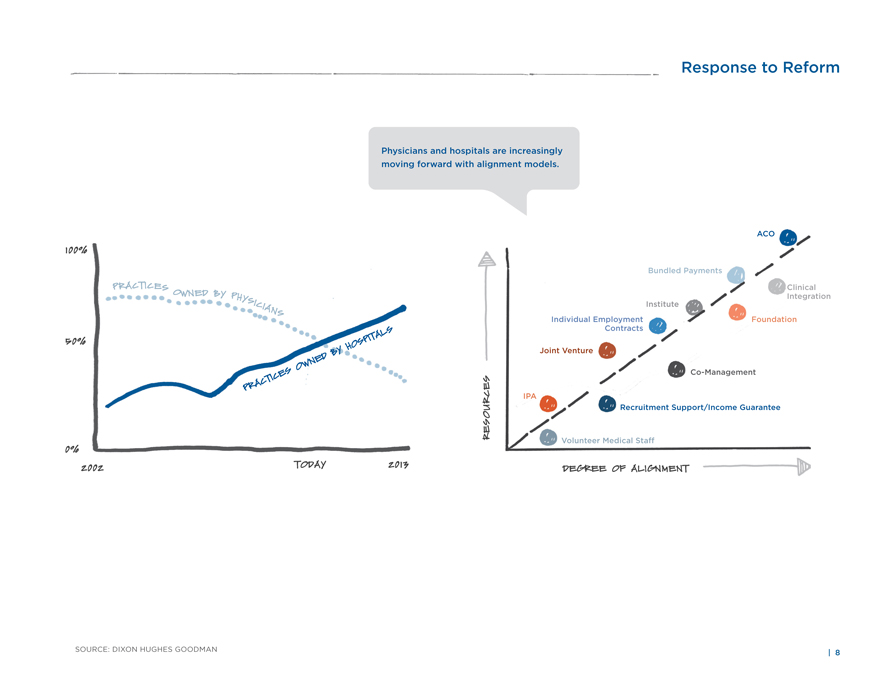
Response to Reform
Physicians and hospitals are increasingly moving forward with alignment models.
100%
PRACTICES
OWNED
BY PHYSICIANS
50%
HOSPITALS
BY
OWNED
PRACTICES
0%
2002
TODAY
2013
ACO
Bundled Payments
Clinical
Integration
Institute
Individual Employment
Foundation
Contracts
Joint Venture
Co-Management
IPA
RESOURCES
Recruitment Support/Income Guarantee
Volunteer Medical Staff
DEGREE OF ALIGNMENT
SOURCE: DIXON HUGHES GOODMAN | 8
|
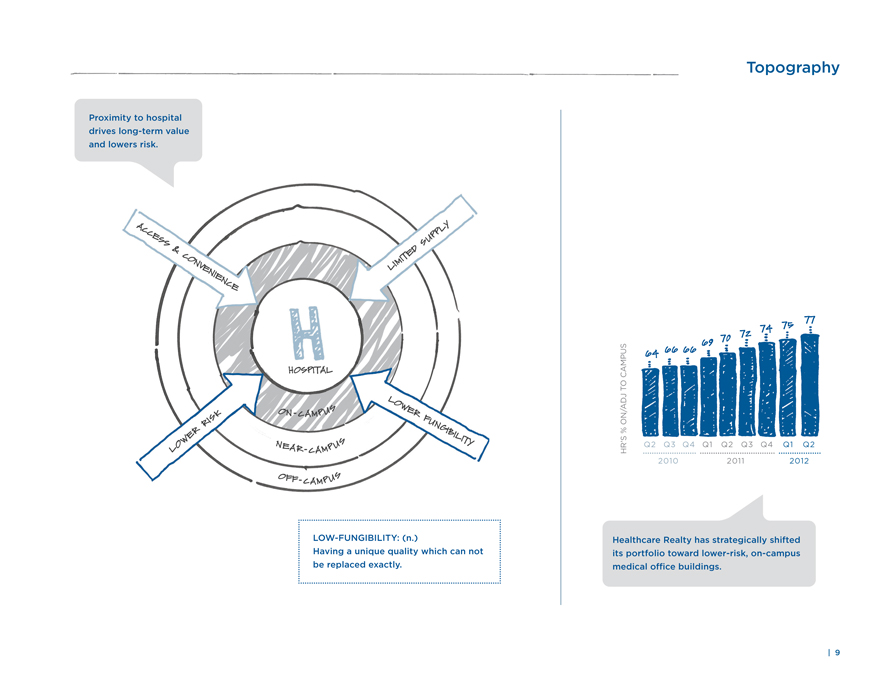
Topography
Proximity to hospital drives long-term value and lowers risk.
ACCESS & CONVENIENCE
LIMITED SUPPLY
H HOSPITAL
LOWER RISK
ON-CAMPUS
NEAR-CAMPUS
OFF-CAMPUS
LOWER FUNGIBILITY
LOW-FUNGIBILITY: (n.)
Having a unique quality which can not be replaced exactly.
HR’S% ON/ADJ TO CAMPUS
77
75
74
72
70
69
66
66
64
Q2 Q3 Q4
Q1 Q2 Q3 Q4
Q1 Q2
2010
2011
2012
Healthcare Realty has strategically shifted its portfolio toward lower-risk, on-campus medical office buildings.
| 9
|
|
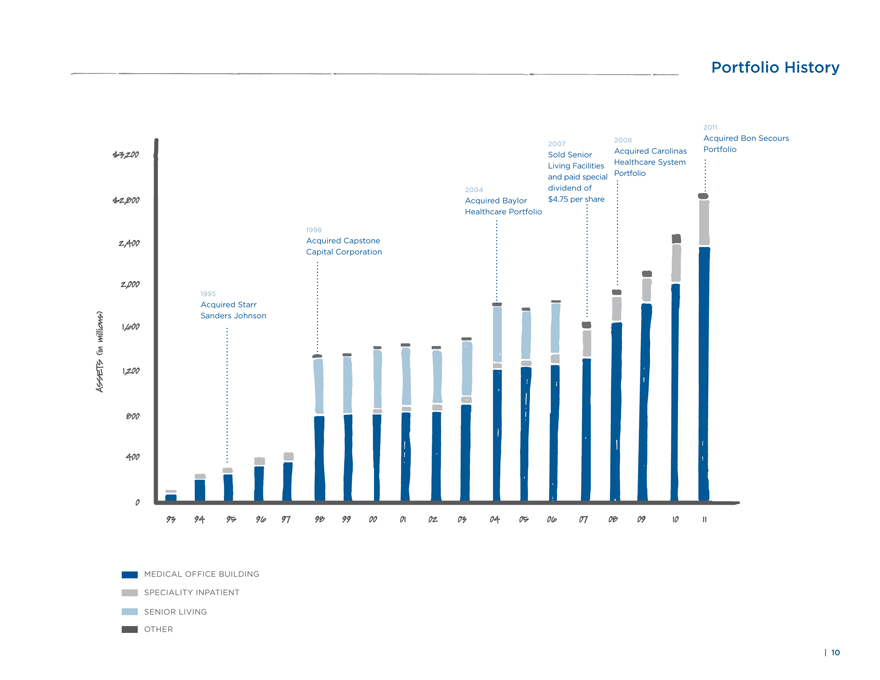
Portfolio History
ASSETS (in millions)
2011
2008
Acquired Bon Secours
2007
$3,200
Sold Senior
Acquired Carolinas
Portfolio
Living Facilities
Healthcare System
and paid special
Portfolio
2004
dividend of
$2,800
Acquired Baylor
$4.75 per share
Healthcare Portfolio
1998
2,400
Acquired Capstone
Capital Corporation
2,000
1995
Acquired Starr
Sanders Johnson
1,600
1,200
800
400
0
93
94
95
96
97
98
99
00
01
02
03
04
05
06
07
08
09
10
11
MEDICAL OFFICE BUILDING
SPECIALITY INPATIENT
SENIOR LIVING
OTHER
| 10
|
|
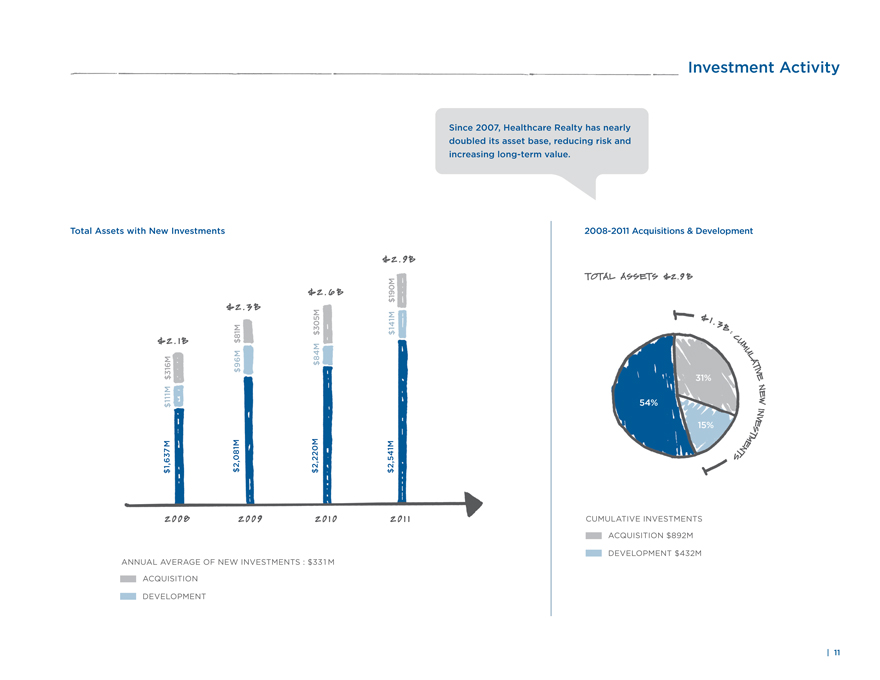
Investment Activity
Since 2007, Healthcare Realty has nearly doubled its asset base, reducing risk and increasing long-term value.
Total Assets with New Investments
$1,637M $111M $316M
$2.1B
2008
$2,081M $96M $81M
$2.3B
2009
$2,220M $84M $305M
$2.6B
2010
$2,541M $141M $190M
$2.9B
2011
ANNUAL AVERAGE OF NEW INVESTMENTS : $331 M
ACQUISITION
DEVELOPMENT
2008-2011 Acquisitions & Development
TOTAL ASSETS $2.9B
31% 54% 15%
$1.3B: CUMULATIVE NEW INVESTMENTS
CUMULATIVE INVESTMENTS
ACQUISITION $892M
DEVELOPMENT $432M
| 11
|
|
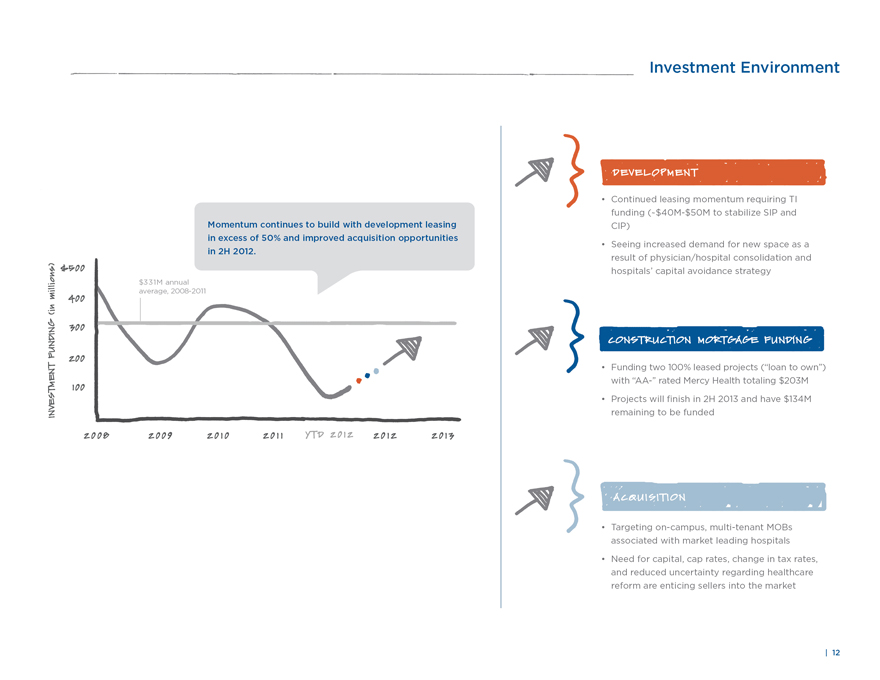
Investment Environment
With the focus on development properties, leasing now exceeds 50% with solid momentum. In addition, Healthcare Realty is seeing more attractive acquisition opportunities, with several expected to move to contract in 2H 2012.
INVESTMENT FUNDING (in millions)
$500
400
300
200
100
$331M annual average, 2008-2011
2008
2009
2010
2011
YTD 2012
2012
2013
DEVELOPMENT
• Continued leasing momentum requiring TI funding (~$40M to stabilize SIP and CIP)
• Seeing increased demand for new space as a result of physician/hospital consolidation and hospitals’ capital avoidance strategy
CONSTRUCTION MORTGAGE FUNDING
• Funding two 100% leased projects (“loan to own”) with “AA-” rated Mercy Health totaling $203M
• Projects will finish in 2H 2013 and have $134M remaining to be funded
ACQUISITION
• Targeting on-campus, multi-tenant MOBs associated with market leading hospitals
• Need for capital, cap rates, change in tax rates, and reduced uncertainty regarding healthcare reform are enticing sellers into the market
| 12
|
|
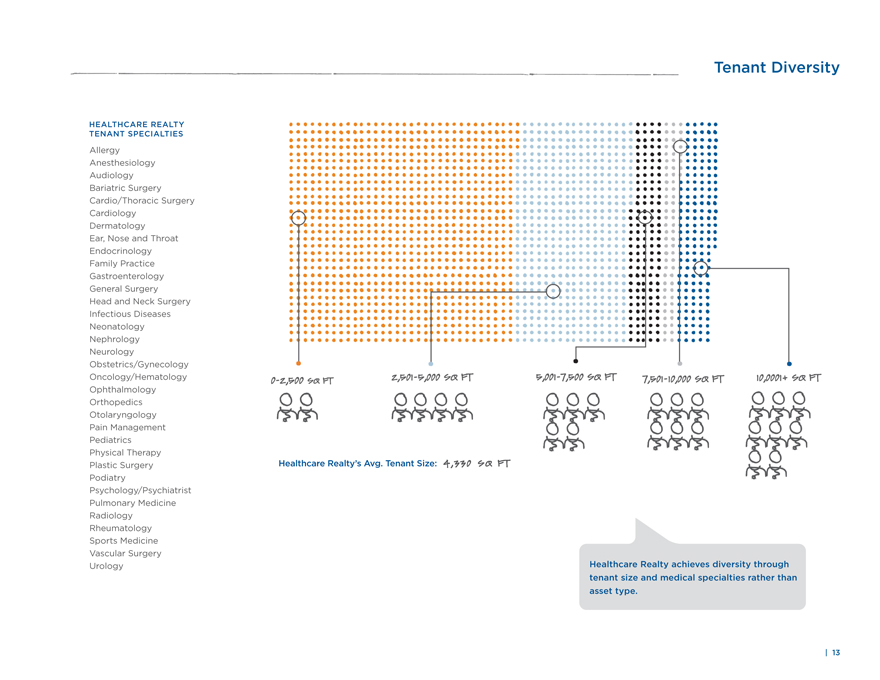
Tenant Diversity
HEALTHCARE REALTY
TENANT SPECIALTIES
Allergy
Anesthesiology
Audiology
Bariatric Surgery
Cardio/Thoracic Surgery
Cardiology
Dermatology
Ear, Nose and Throat
Endocrinology
Family Practice
Gastroenterology
General Surgery
Head and Neck Surgery
Infectious Diseases
Neonatology
Nephrology
Neurology
Obstetrics/Gynecology
Oncology/Hematology
Ophthalmology
Orthopedics
Otolaryngology
Pain Management
Pediatrics
Physical Therapy
Plastic Surgery
Podiatry
Psychology/Psychiatrist
Pulmonary Medicine
Radiology
Rheumatology
Sports Medicine
Vascular Surgery
Urology
0-2,500 SQ FT 2,501-5000 SQ FT 5,001-7,500 SQ FT 7,501-10,000 SQ FT 10,000+ SQ FT
Healthcare Realty’s Avg. Tenant Size: 4,330 SQ FT
Healthcare Realty achieves diversity through tenant size and medical specialties rather than asset type.
| 13
|
|
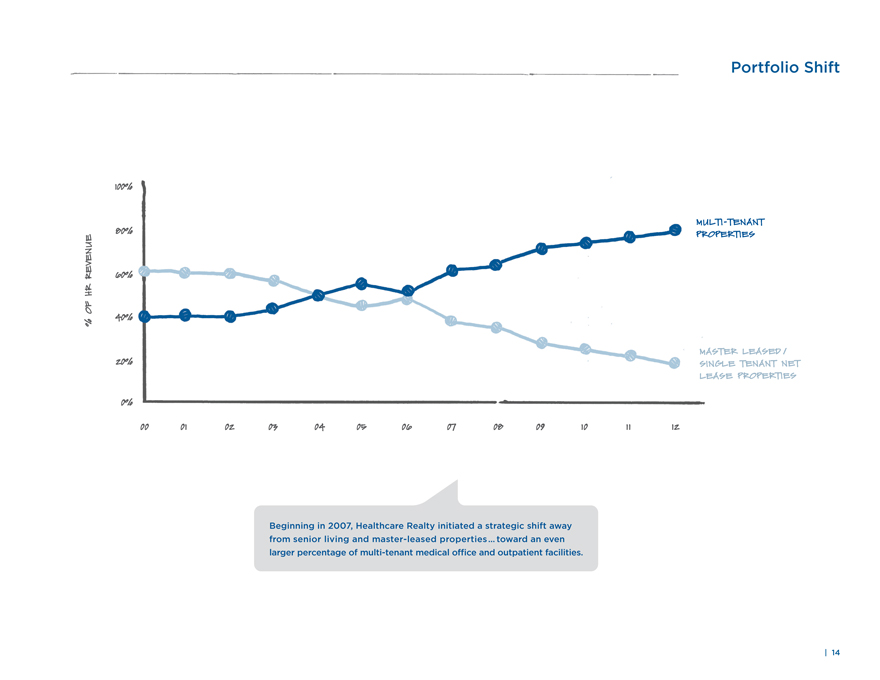
Portfolio Shift
% OF HR REVENUE
100%
80%
60%
40%
20%
0%
MULTI-TENANT
PROPERTIES
MASTER LEASED /
SINGLE TENANT NET
LEASE PROPERTIES
00
01
02
03
04
05
06
07
08
09
10
11
12
Beginning in 2007, Healthcare Realty initiated a strategic shift away from senior living and master-leased properties … toward an even larger percentage of multi-tenant medical office and outpatient facilities.
| 14
|
|
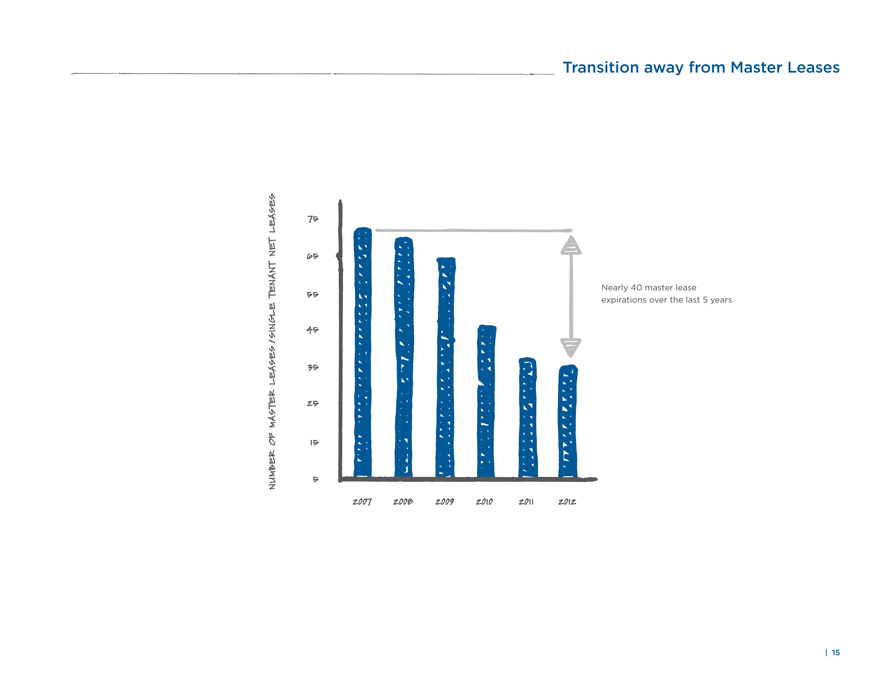
Transition away from Master Leases
NUMBER OF MASTER LEASES / SINGLE TENANT NET LEASES
75
65
55
45
35
25
15
5
2007
2008
2009
2010
2011
2012
Nearly 40 master lease expirations over the last 5 years
| 15
|
|
Intrinsic Real Estate Value vs. Leasehold Value
PRICE (RENT)
Intrinsic Real Estate Value
• Demand-driven
• Low fungibility
• Perpetual cash flow
• Duration: infinite
Multi-tenant building in dense location with strong demand.
DEMAND > SUPPLY
SUPPLY
SUPPLY > DEMAND
DEMAND
QUANTITY (SF)
Credit worthy single tenant in location with few replacement tenants.
Leasehold Value
• Credit-driven
• High fungibility
• Rent exceeds market
• Renewal roll down (terminal value risk)
• Duration: Lease term (finite)
| 16
|
|
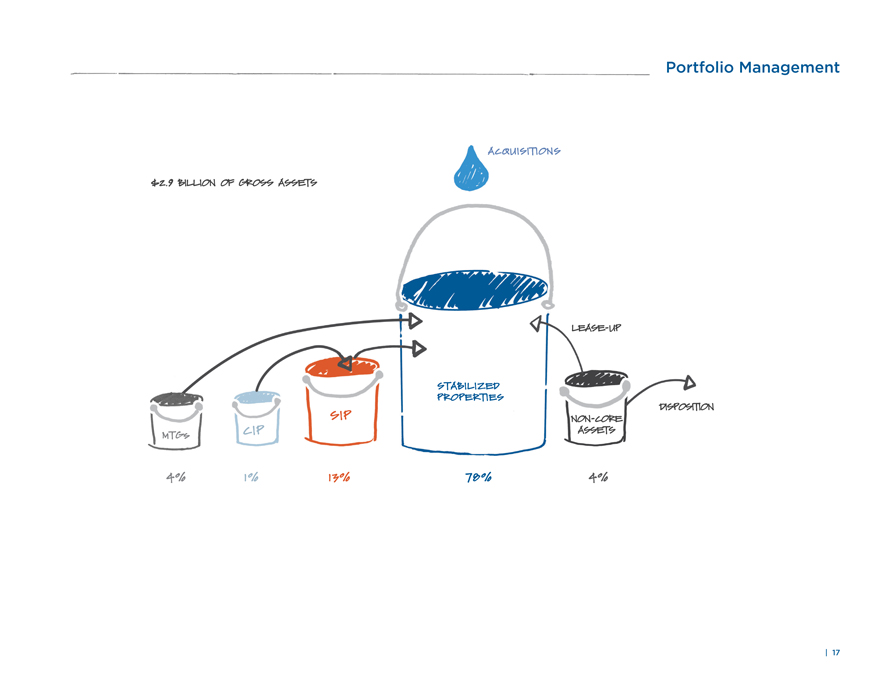
Portfolio Management
$2.9 BILLION OF GROSS ASSETS
ACQUISITIONS
LEASE-UP
STABILIZED
PROPERTIES
78%
MTGs
4%
CIP
1%
SIP
13%
NON-CORE
ASSETS
4%
DISPOSITION
| 17
|
|
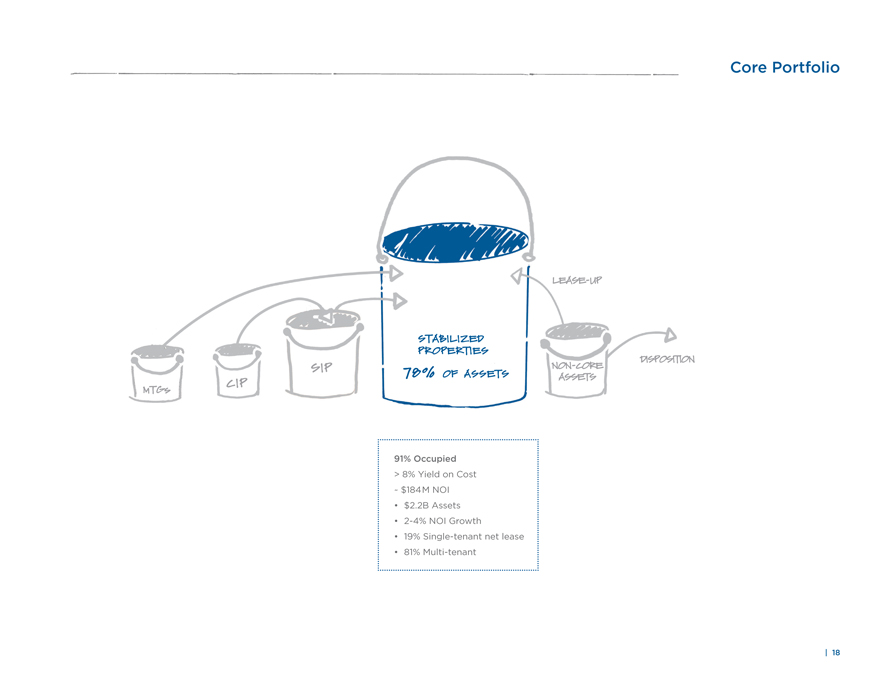
Core Portfolio
LEASE-UP
STABILIZED
PROPERTIES
CIP
MTGs
SIP
78% OF ASSETS
NON-CORE ASSETS
DISPOSITION
91% Occupied
> 8% Yield on Cost
~ $184M NOI
• $2.2B Assets
• 2-4% NOI Growth
• 19% Single-tenant net lease
• 81% Multi-tenant
| 18
|
|
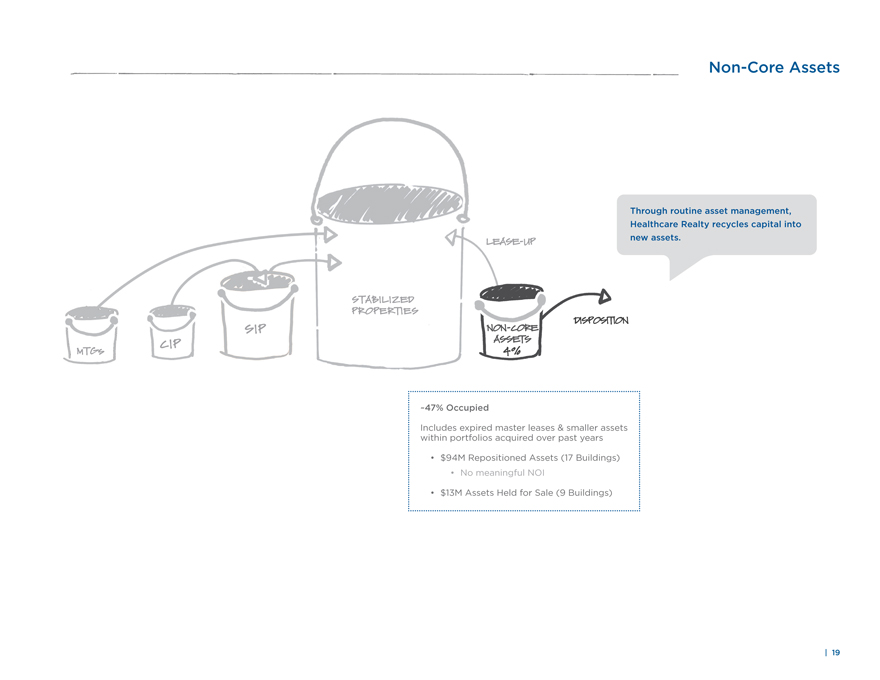
Non-Core Assets
Through routine asset management, Healthcare Realty recycles capital into new assets.
LEASE-UP
MTGs
CIP
SIP
STABILIZED
PROPERTIES
NON-CORE
ASSETS
4%
DISPOSITION
~ 47% Occupied
Includes expired master leases & smaller assets within portfolios acquired over past years
• $94M Repositioned Assets (17 Buildings)
• No meaningful NOI
• $13M Assets Held for Sale (9 Buildings)
| 19
|
|
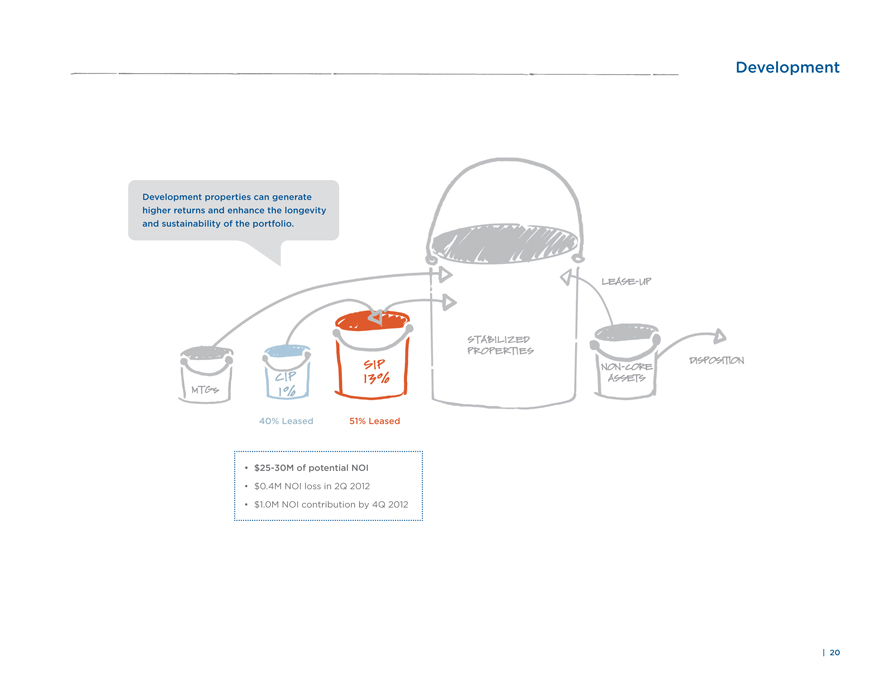
Development
Development properties can generate higher returns and enhance the longevity and sustainability of the portfolio.
LEASE-UP
MTGs
CIP 1%
SIP 13%
STABILIZED PROPERTIES
NON-CORE ASSETS
DISPOSITION
40% Leased
51% Leased
• $25-30M of potential NOI
• $0.4M NOI loss in 2Q 2012
• $1.0M NOI contribution by 4Q 2012
| 20
|
|
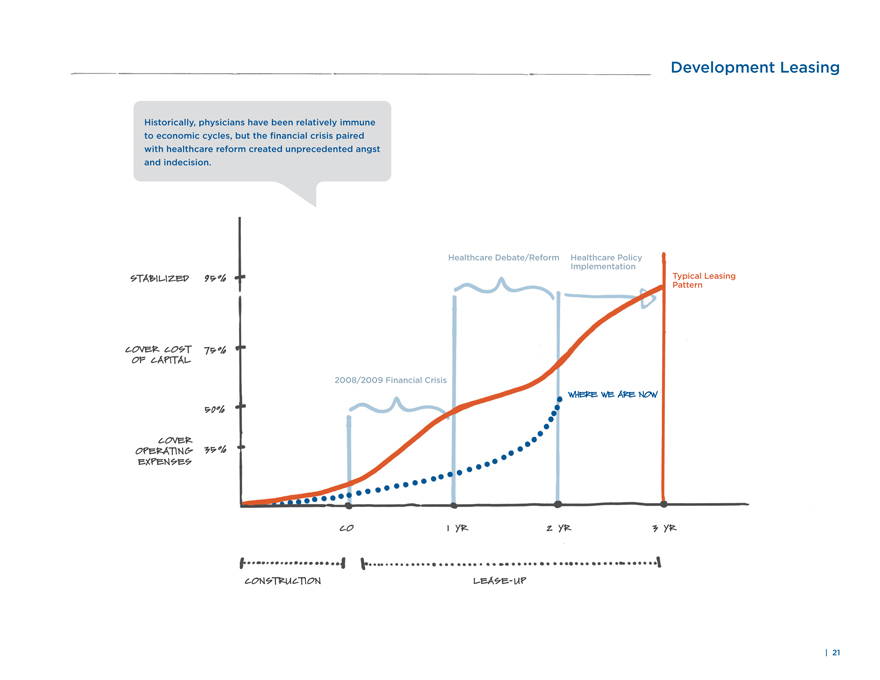
Development Leasing
Historically, physicians have been relatively immune to economic cycles, but the financial crisis paired with healthcare reform created unprecedented angst and indecision.
Healthcare Debate/Reform
Healthcare Policy Implementation
Typical Leasing Pattern
STABILIZED 95%
COVER COST OF CAPITAL 75%
2008/2009 Financial Crisis
WHERE WE ARE NOW
50%
COVER OPERATING EXPENSES 35%
CO
1 YR
2 YR
3 YR
CONSTRUCTION LEASE-UP
| 21
|
|
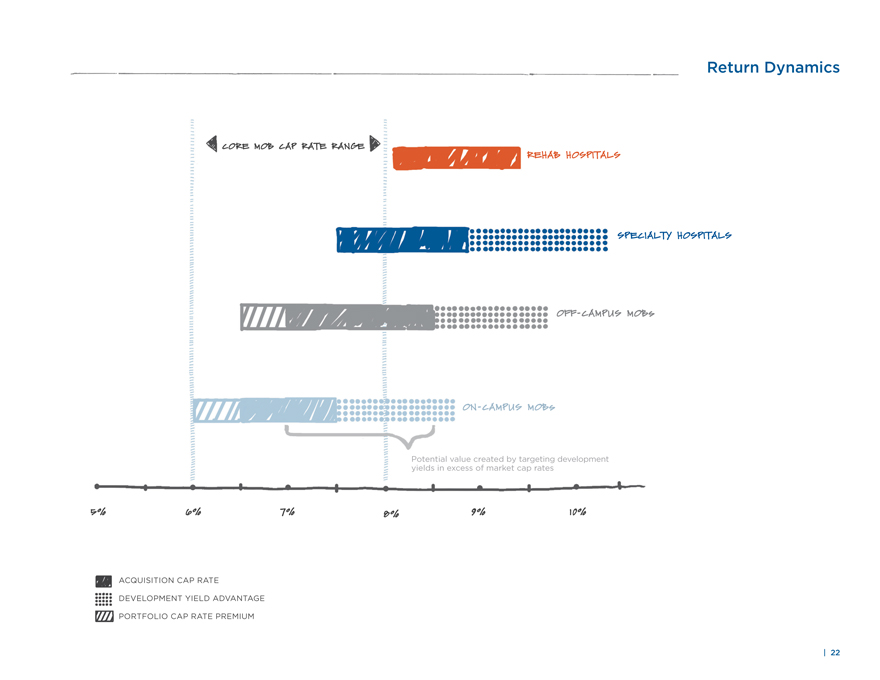
Return Dynamics
CORE MOB CAP RATE RANGE
REHAB HOSPITALS
SPECIALTY HOSPITALS
OFF-CAMPUS MOBs
ON-CAMPUS MOBs
Potential value created by targeting development yields in excess of market cap rates
5%
6%
7%
8%
9%
10%
ACQUISITION CAP RATE
DEVELOPMENT YIELD ADVANTAGE
PORTFOLIO CAP RATE PREMIUM
| 22
|
|
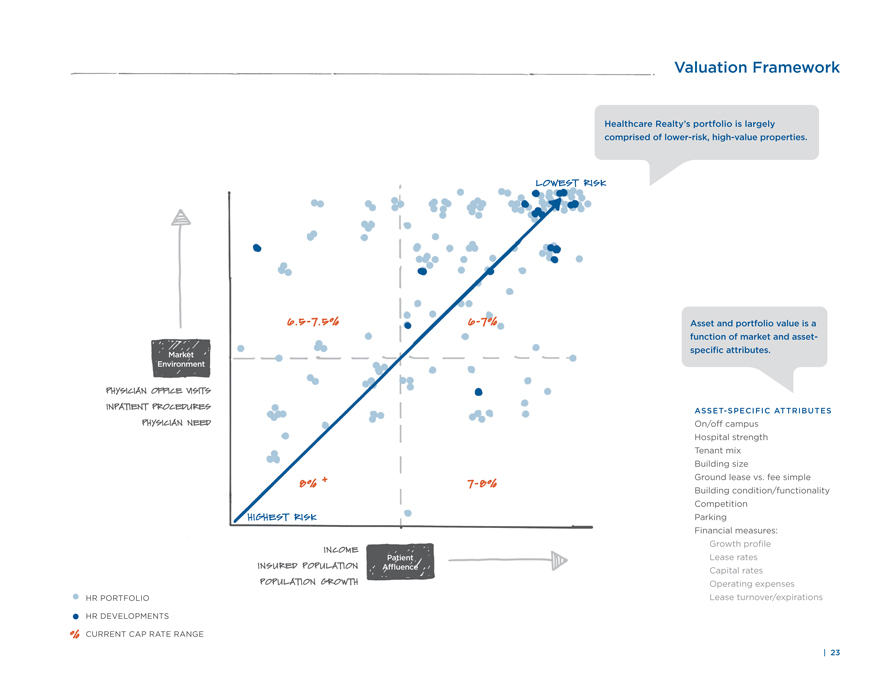
Valuation Framework
Healthcare Realty’s portfolio is largely comprised of lower-risk, high-value properties.
LOWEST RISK
6.5-7.5%
6-7%
Market Environment
PHYSICIAN OFFICE VISITS
INPATIENT PROCEDURES
PHYSICIAN NEED
8% +
7-8%
HIGHEST RISK
INCOME
INSURED POPULATION
POPULATION GROWTH
Patient Affluence
HR PORTFOLIO
HR DEVELOPMENTS
% CURRENT CAP RATE RANGE
Asset and portfolio value is a function of market and asset-specific attributes.
ASSET-SPECIFIC ATTRIBUTES
On/off campus
Hospital strength
Tenant mix
Building size
Ground lease vs. fee simple
Building condition/functionality
Competition
Parking
Financial measures:
Growth profile
Lease rates
Capital rates
Operating expenses
Lease turnover/expirations
| 23
|
|
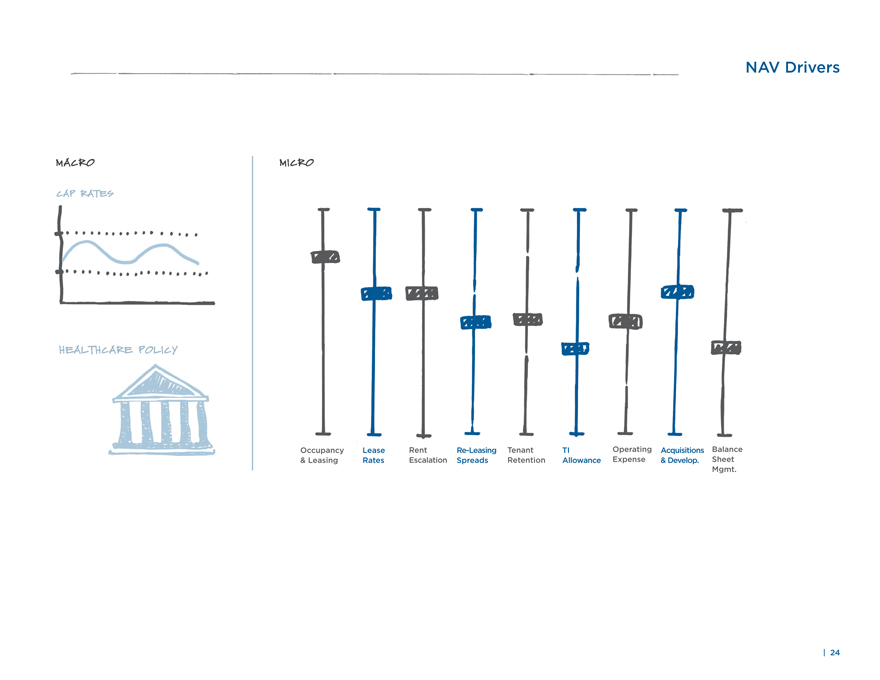
NAV Drivers
MACRO
MICRO
CAP RATES
HEALTHCARE POLICY
Occupancy & Leasing
Lease Rates
Rent Escalation
Re-Leasing Spreads
Tenant Retention
TI Allowance
Operating Expense
Acquisitions & Develop.
Balance
Sheet
Mgmt.
| 24
|
|
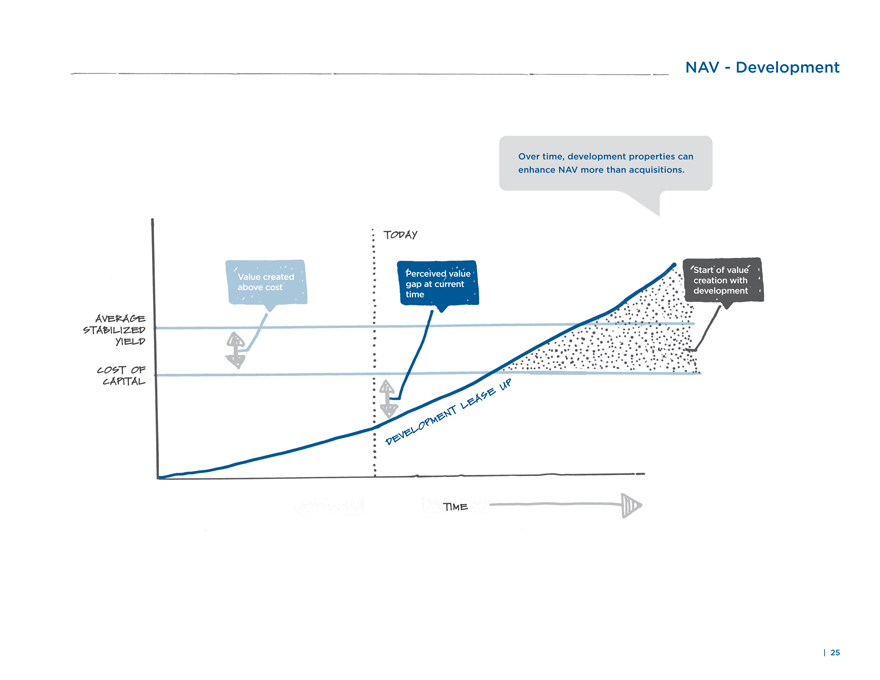
NAV - Development
Over time, development properties can enhance NAV more than acquisitions.
TODAY
Start of value creation with development
Value created above cost
Perceived value gap at current time
AVERAGE STABILIZED YIELD
COST OF CAPITAL
DEVELOPMENT LEASE UP
TIME
| 25
|
|
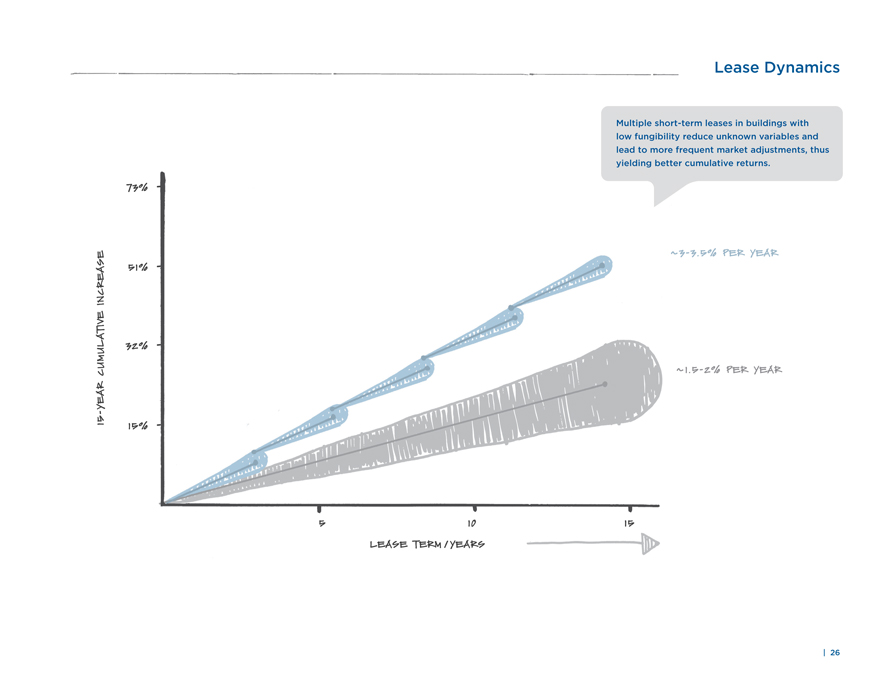
Lease Dynamics
Multiple short-term leases in buildings with low fungibility reduce unknown variables and lead to more frequent market adjustments, thus yielding better cumulative returns.
73%
51%
32%
15%
~3-3.5% PER YEAR
~1.5-2% PER YEAR
5
10
15
15-YEAR CUMULATIVE INCREASE
LEASE TERM / YEARS
| 26
|
|
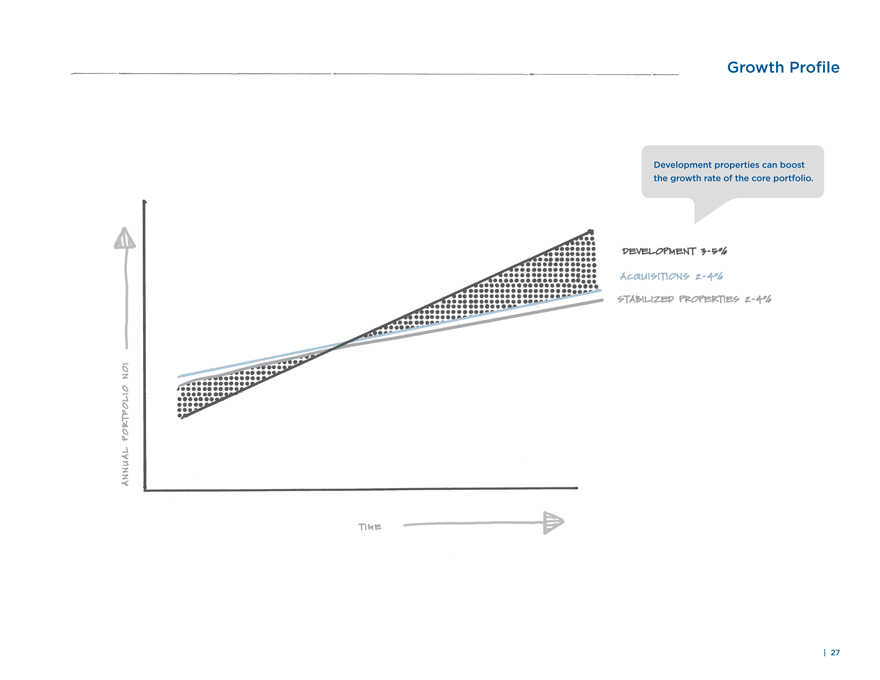
Growth Profile
Development properties can boost the growth rate of the core portfolio.
ANNUAL PORTFOLIO NOI
DEVELOPMENT 3-5%
ACQUISITIONS 2-4%
STABILIZED PROPERTIES 2-4%
TIME
| 27
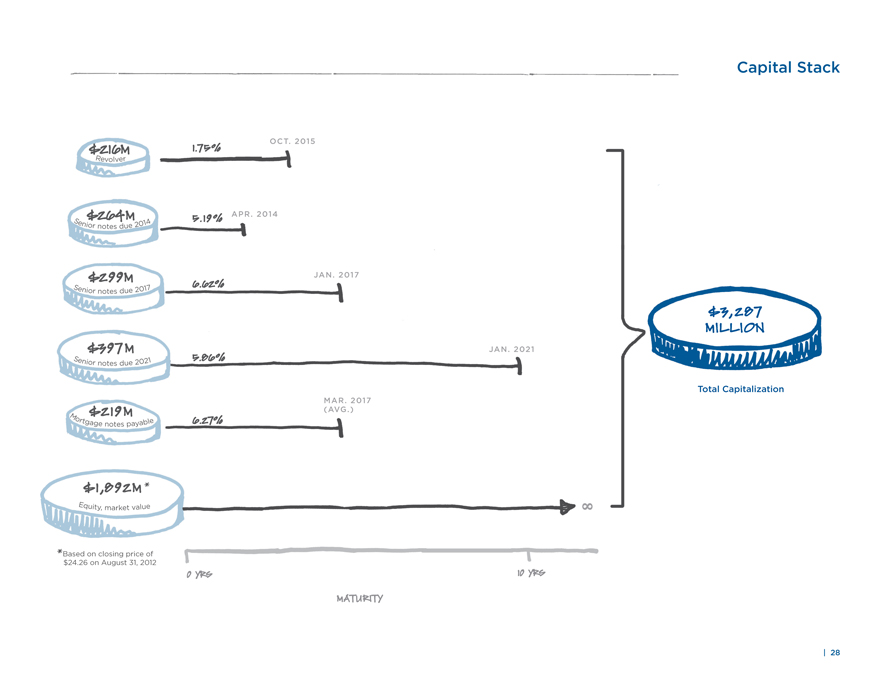
Capital Stack
$216M
1.75%
OCT. 2015
Revolver
$264M
5.19%
APR. 2014
Senior notes due 2014
$299M
Senior notes due 2017
6.62%
JAN. 2017
$3,287 MILLION
Total Capitalization
$397 M
5.86%
JAN. 2021
Senior notes due 2021
$219 M
Mortgage notes payable
6.27%
MAR. 2017 (AVG.)
$1,892M *
00
Equity, market value
*Based on closing price of $24.26 on August 31, 2012
0 YRS
10 YRS
MATURITY
| 28