Attached files
| file | filename |
|---|---|
| 8-K - 8-K - NATIONAL FUEL GAS CO | d405025d8k.htm |
 National Fuel Gas Company
Investor Presentation
September 2012
Exhibit 99 |
 September
2012 National Fuel Gas Company
2
Safe Harbor For Forward Looking Statements
This
presentation
may
contain
“forward-looking
statements”
as
defined
by
the
Private
Securities
Litigation
Reform
Act
of
1995,
including
statements
regarding
future
prospects,
plans,
performance and capital structure, anticipated capital expenditures and completion of
construction projects, as well as statements that are identified by the use of the words “anticipates,”
“estimates,”
“expects,”
“forecasts,”
“intends,”
“plans,”
“predicts,”
“projects,”
“believes,”
“seeks,”
“will,”
“may,”
and similar expressions. Forward-looking statements involve risks and
uncertainties, which could cause actual results or outcomes to differ materially from those
expressed in the forward-looking statements. The Company’s expectations, beliefs and
projections
contained
herein
are
expressed
in
good
faith
and
are
believed
to
have
a
reasonable
basis,
but
there
can
be
no
assurance
that
such
expectations,
beliefs
or
projections
will
result
or be achieved or accomplished.
In addition to other factors, the following are important factors that could cause actual
results to differ materially from results referred to in the forward-looking statements: factors
affecting the Company’s ability to successfully identify, drill for and produce
economically viable natural gas and oil reserves, including among others geology, lease availability, title
disputes, weather conditions, shortages, delays or unavailability of equipment and services
required in drilling operations, insufficient gathering, processing and transportation capacity,
the need to obtain governmental approvals and permits, and compliance with environmental laws
and regulations; changes in laws, regulations or judicial interpretations to which the
Company is subject, including those involving derivatives, taxes, safety, employment, climate
change, other environmental matters, real property, and exploration and production
activities
such
as
hydraulic
fracturing;
changes
in
the
price
of
natural
gas
or
oil;
impairments
under
the
SEC’s
full
cost
ceiling
test
for
natural
gas
and
oil
reserves;
uncertainty
of
oil
and
gas
reserve
estimates;
significant
differences
between
the
Company’s
projected
and
actual
production
levels
for
natural
gas
or
oil;
changes
in
demographic
patterns
and
weather
conditions;
changes
in
the
availability,
price
or
accounting
treatment
of
derivative
financial
instruments;
governmental/regulatory
actions,
initiatives
and
proceedings,
including
those
involving
rate
cases (which address, among other things, allowed rates of return, rate design and retained
natural gas), environmental/safety requirements, affiliate relationships, industry structure, and
franchise renewal; delays or changes in costs or plans with respect to Company projects or
related projects of other companies, including difficulties or delays in obtaining necessary
governmental approvals, permits or orders or in obtaining the cooperation of interconnecting
facility operators; financial and economic conditions, including the availability of credit, and
occurrences
affecting
the
Company’s
ability
to
obtain
financing
on
acceptable
terms
for
working
capital,
capital
expenditures
and
other
investments,
including
any
downgrades
in
the
Company’s
credit
ratings
and
changes
in
interest
rates
and
other
capital
market
conditions;
changes
in
economic
conditions,
including
global,
national
or
regional
recessions,
and
their
effect on the demand for, and customers’
ability to pay for, the Company’s products and services; the creditworthiness or
performance of the Company’s key suppliers, customers and counterparties; economic
disruptions or uninsured losses resulting from major accidents, fires, severe weather, natural disasters, terrorist activities, acts of war, cyber attacks or pest
infestation; changes in price differential between similar quantities of natural gas at
different geographic locations, and the effect of such changes on the demand for pipeline
transportation
capacity
to
or
from
such
locations;
other
changes
in
price
differentials
between
similar
quantities
of
oil
or
natural
gas
having
different
quality,
heating
value,
geographic
location or delivery date; significant differences between the Company’s projected and
actual capital expenditures and operating expenses; changes in laws, actuarial assumptions, the
interest
rate
environment
and
the
return
on
plan/trust
assets
related
to
the
Company’s
pension
and
other
post-retirement
benefits,
which
can
affect
future
funding
obligations
and
costs
and plan liabilities; the cost and effects of legal and administrative claims against the
Company or activist shareholder campaigns to effect changes at the Company; increasing health care
costs and the resulting effect on health insurance premiums and on the obligation to provide
other post-retirement benefits; or increasing costs of insurance, changes in coverage and the
ability to obtain insurance.
Forward-looking statements include estimates of oil and gas quantities.
Proved oil and gas reserves are those quantities of oil and gas
which, by analysis of geoscience and engineering
data, can be estimated with reasonable certainty to be economically producible under existing
economic conditions, operating methods and government regulations. Other estimates of
oil and
gas
quantities,
including
estimates
of
probable
reserves,
possible
reserves,
and
resource
potential,
are
by
their
nature
more
speculative
than
estimates
of
proved
reserves.
Accordingly, estimates other than proved reserves are subject to
substantially greater risk of being actually realized. Investors are urged to consider closely
the disclosure in our Form 10-K available
at
www.nationalfuelgas.com.
You
can
also
obtain
this
form
on
the
SEC’s
website
at
www.sec.gov.
For a discussion of the risks set forth above and other factors that could cause actual
results to differ materially from results referred to in the forward-looking statements, see “Risk
Factors”
in the Company’s Form 10-K for the fiscal year ended September 30, 2011 and Forms
10-Q for the periods ended December 31, 2011, March 31, 2012, and June 30, 2012. The
Company disclaims any obligation to update any forward-looking statements to reflect events
or circumstances after the date thereof or to reflect the occurrence of unanticipated events. |
 September
2012 National Fuel Gas Company
3
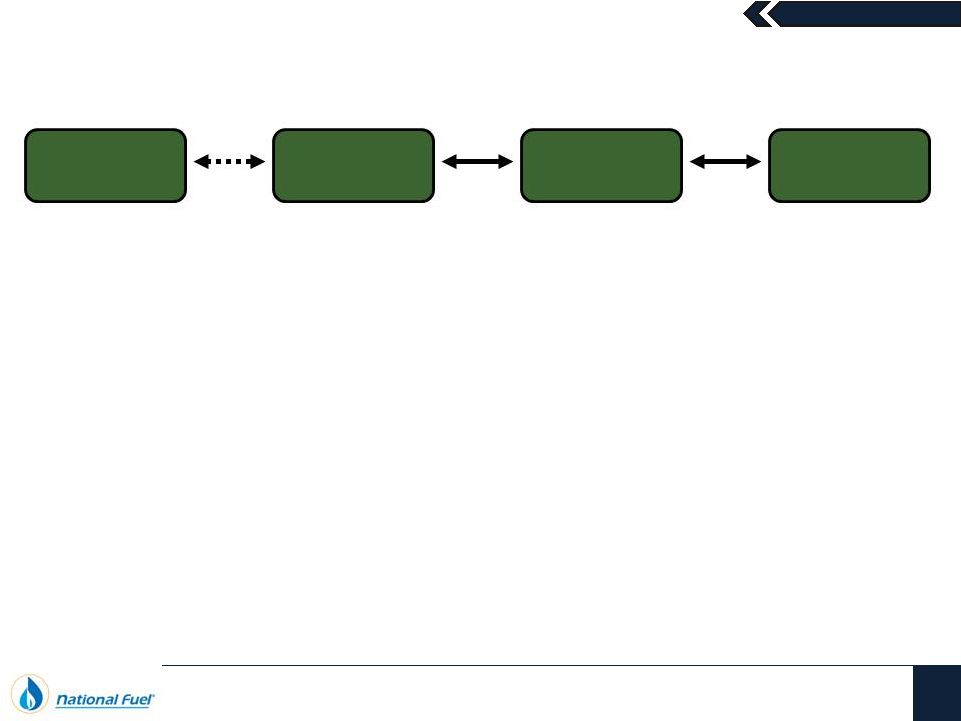
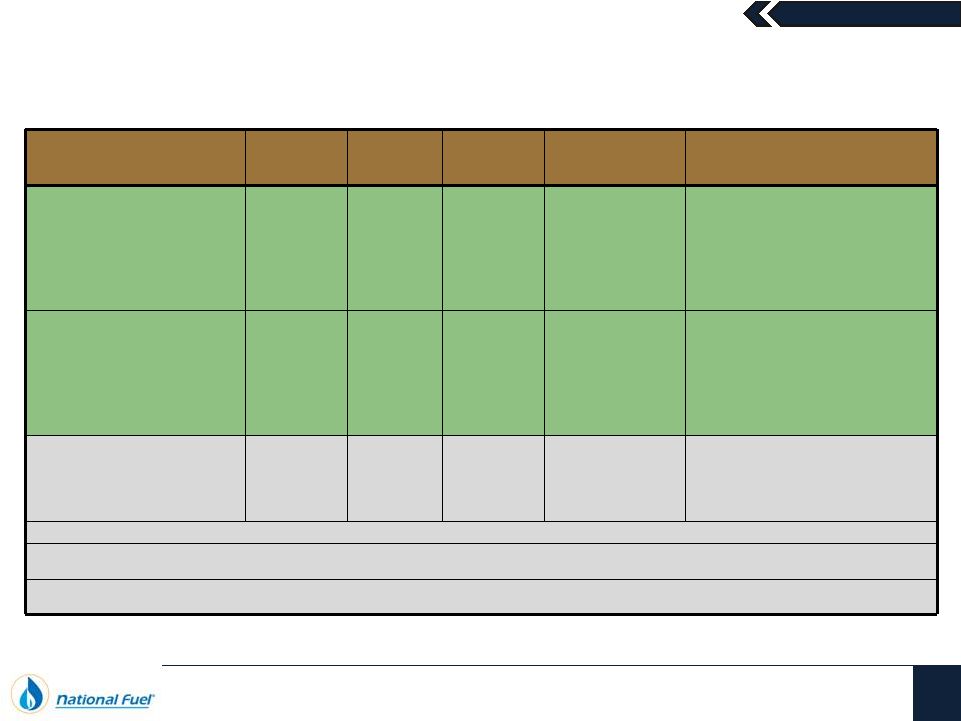
Our Business Mix Leads to Long-Term Value Creation
Upstream
Crude Oil
Midstream
Downstream
National Fuel Gas
Supply Corporation
Empire Pipeline, Inc.
National Fuel Gas
Midstream Corporation
National Fuel Gas
Distribution
Corporation
National Fuel
Resources, Inc.
The strategic, operational and financial benefits created by
the integrated mix of assets continues to generate
significant long-term value for the Company in nearly all
economic and commodity price scenarios
Upstream
Natural Gas
Seneca Resources
Corporation
(West Division)
Seneca Resources
Corporation
(East Division) |
 September
2012 National Fuel Gas Company
4
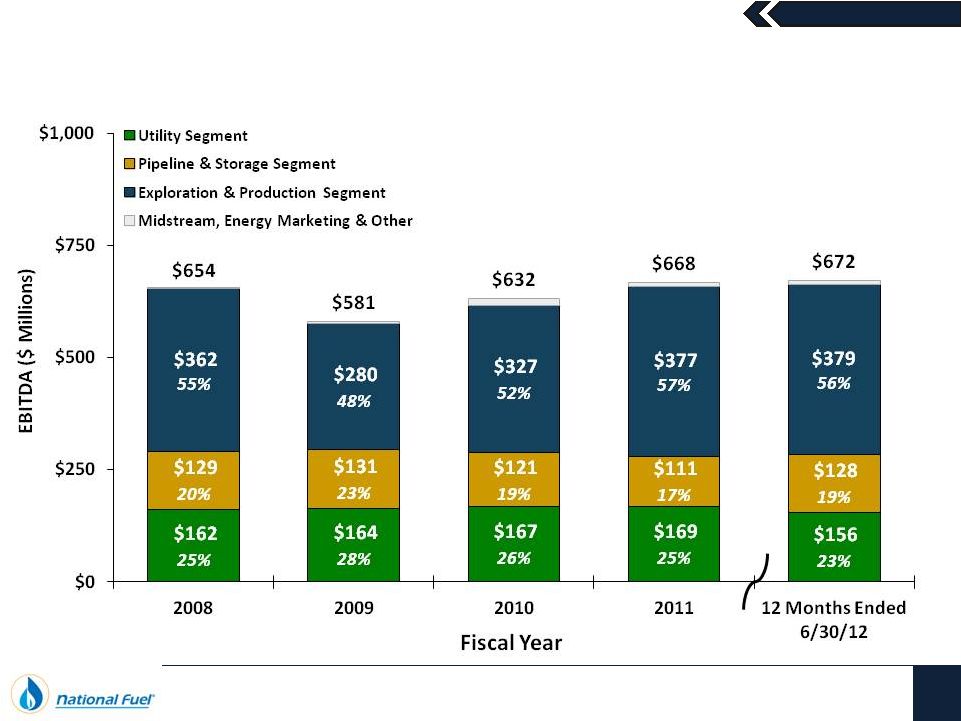
Integrated Business Mix Provides Financial Balance
Note: A reconciliation of EBITDA to Net Income as presented on the Consolidated Statement of
Income and Earnings is included at the end of this presentation. |
 September
2012 National Fuel Gas Company
5
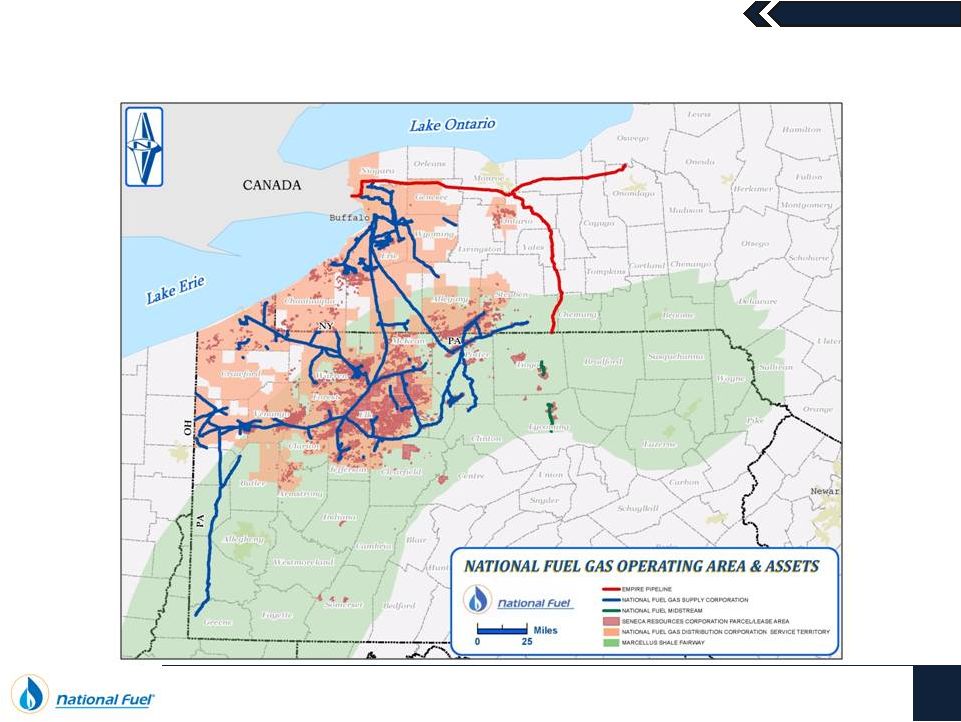
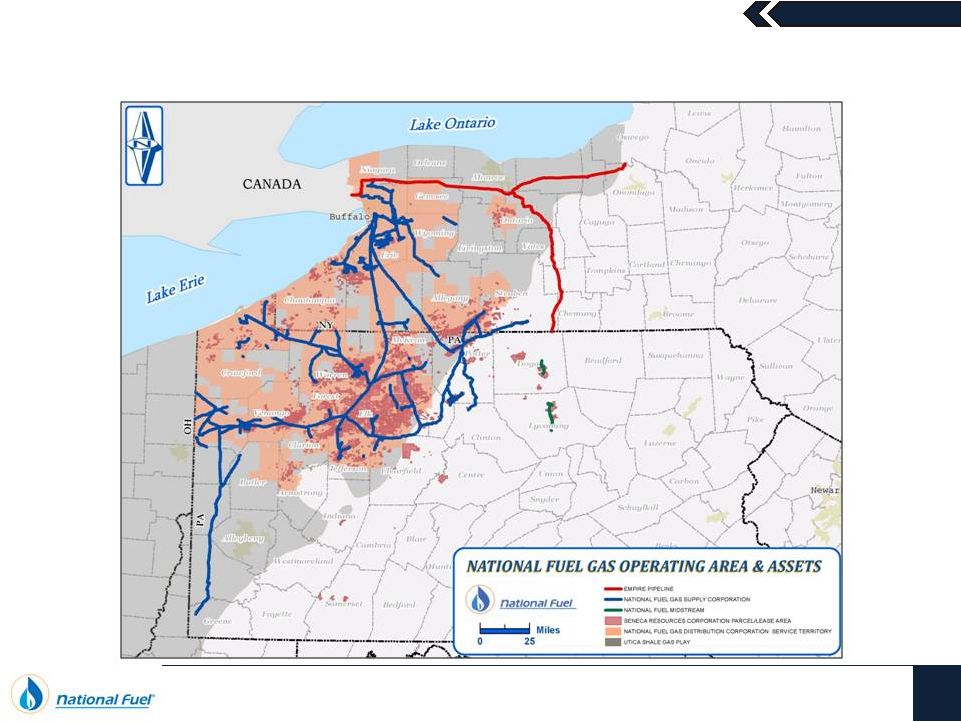
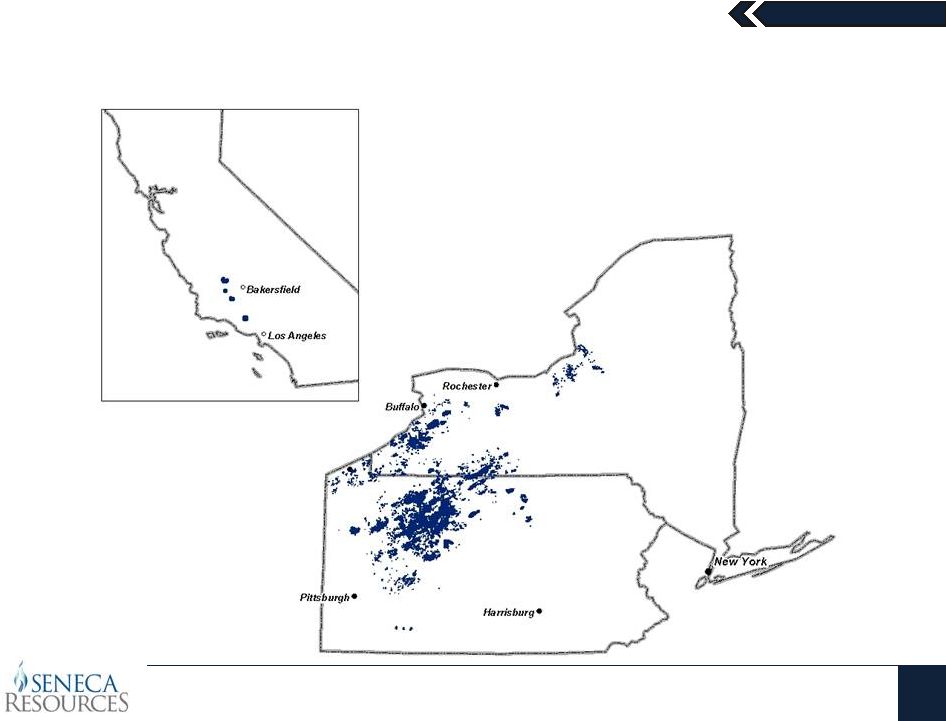
Highly Integrated Assets with Significant Marcellus Exposure…
|
 September
2012 National Fuel Gas Company
6
…And Exposure to Growth from the Utica Shale |
 September
2012 National Fuel Gas Company
7
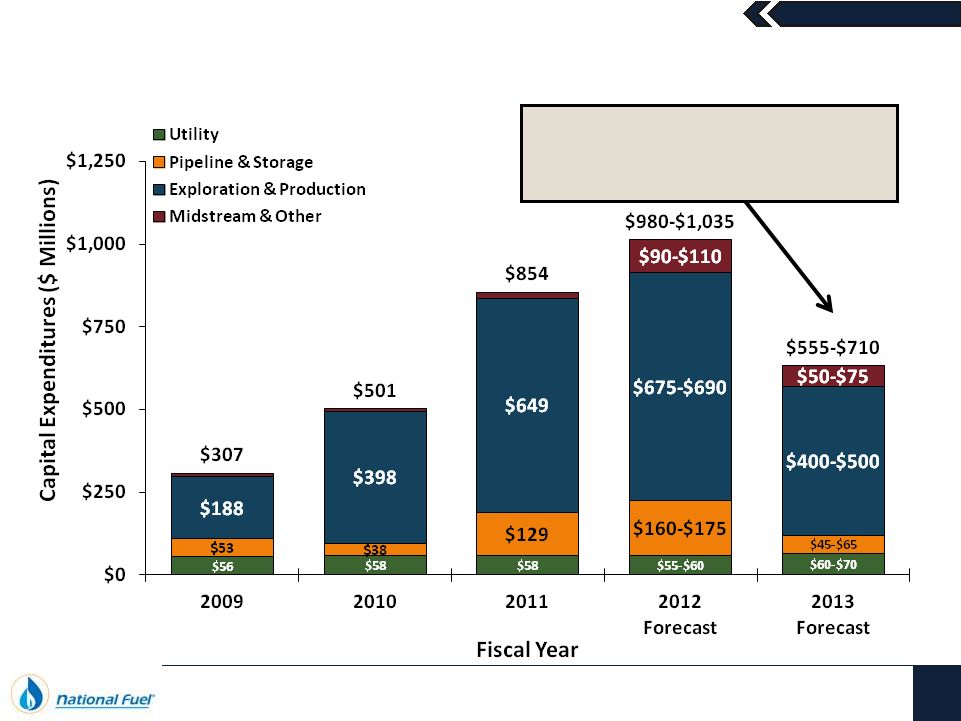
Capital Spending Flexibility to Maintain Financial Strength
Note: A reconciliation to Capital Expenditures as presented on the Consolidated Statement of
Cash Flows is included at the end of this presentation. To the extent additional
infrastructure expansions are available, additional capital
remains flexible and will be deployed based
upon return-driven decision making
September 2012 |
 September
2012 Short-Term
Debt
2.0%
National Fuel Gas Company
8
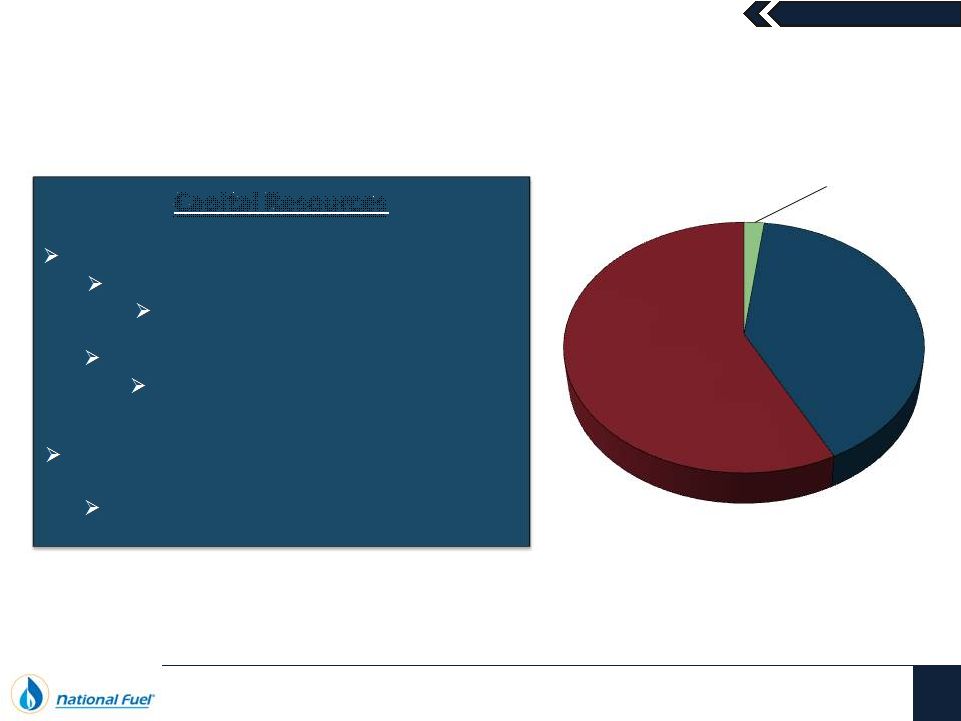
Strong Balance Sheet and Liquidity Position
Capital Resources
$3.458 Billion
(1)
As of June 30, 2012
(1) Includes Notes Payable to Banks and Commercial Paper of $70.2 million and Current Portion
of Long-Term Debt of $250.0 million as of June 30, 2012.
Shareholders’
Equity
57.5 %
Long-Term
Debt
40.5%
Total Short-Term Capacity: $1,085 Million
Committed Credit Facility: $750 Million
Syndicated facility extends until January 6,
2017
Uncommitted Lines of Credit: $335 Million
$20.2 million of outstanding short-term
notes payable to banks as of June 30, 2012
$300.0 Million Commercial Paper Program
backed by Committed Credit Facility
$50.0 million of outstanding commercial
paper as of June 30, 2012 |
 September
2012 National Fuel Gas Company
9
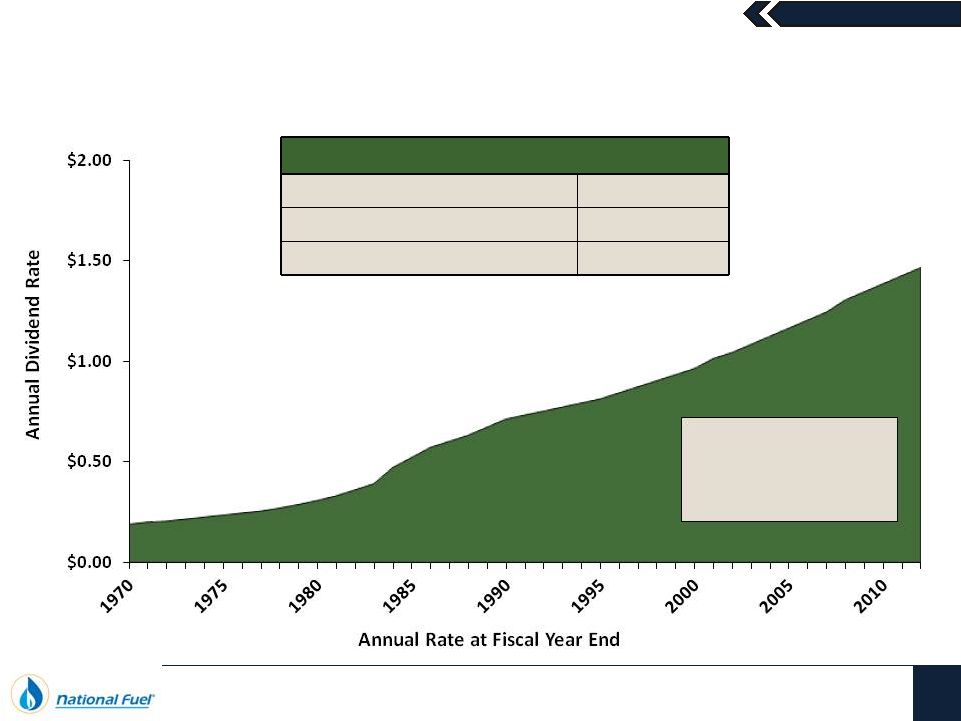
Dividend Track Record
Current
Dividend Yield
(1)
2.9%
Dividend Consistency
Consecutive Dividend Payments
110 Years
Consecutive Dividend Increases
42 Years
Current Annualized Dividend Rate
$1.46 per Share
(1) As of August 28, 2012 |
 September
2012 Pipeline & Storage / Midstream
10 |
 September
2012 Midstream Businesses
11
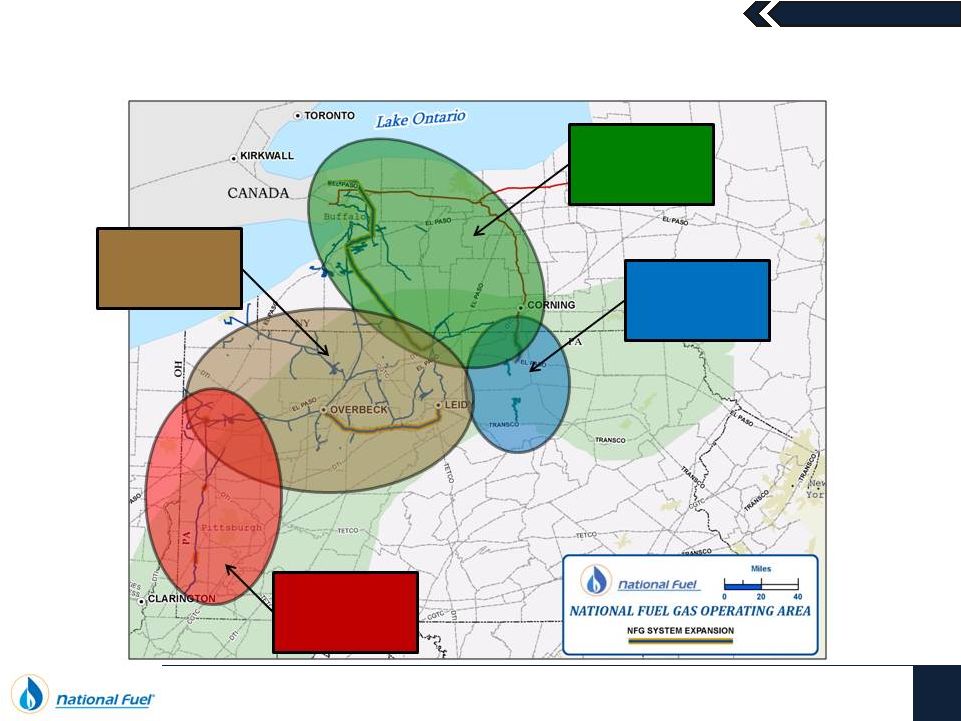
Ongoing Expansion to Transport Appalachian Production
Gathering
Marcellus
Production
Serving
Southwest PA
Producers
Longer-Term
Infrastructure
Expansions
Shipping Gas
to Canada &
Northeast |
 September
2012 Midstream Businesses
12
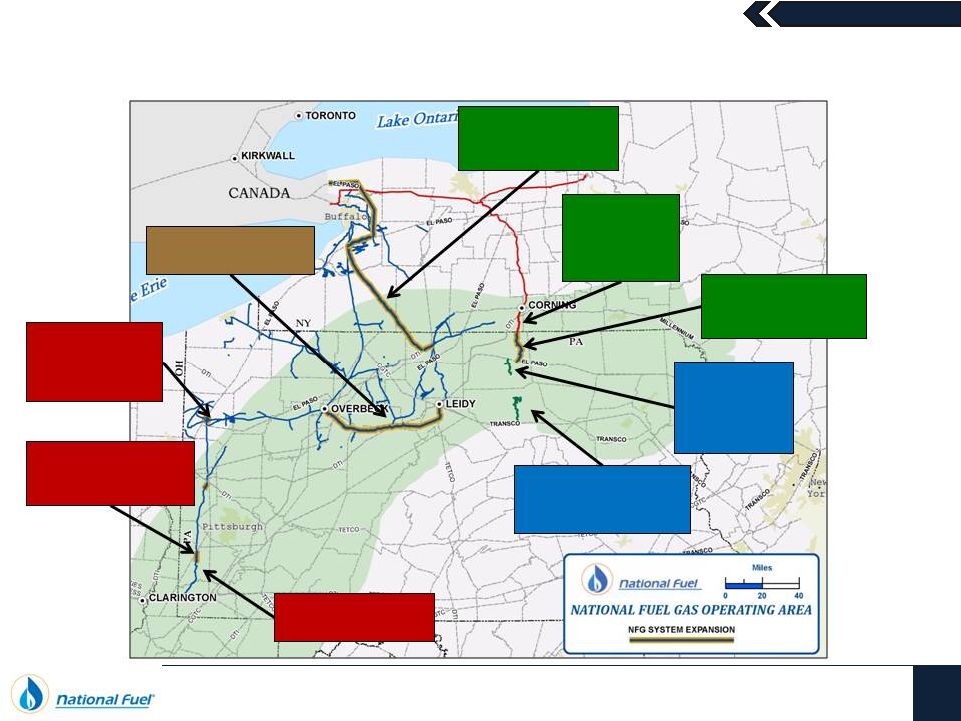
A Closer Look at the Expansion Progress
COVINGTON
GATHERING
SYSTEM
(In-Service)
TROUT RUN
GATHERING SYSTEM
(In-Service)
WEST TO EAST
OVERBECK TO LEIDY
TIOGA
COUNTY
EXTENSION
(In-Service)
LINE “N”
EXPANSION
(In-Service)
NORTHERN ACCESS
EXPANSION
(Under Construction)
CENTRAL TIOGA
COUNTY EXTENSION
(2014/2015)
LINE “N”
2012
EXPANSION
(Under Construction)
MERCER
EXPANSION
PROJECT
(2014 In-Service) |
 September
2012 NFG Midstream
13
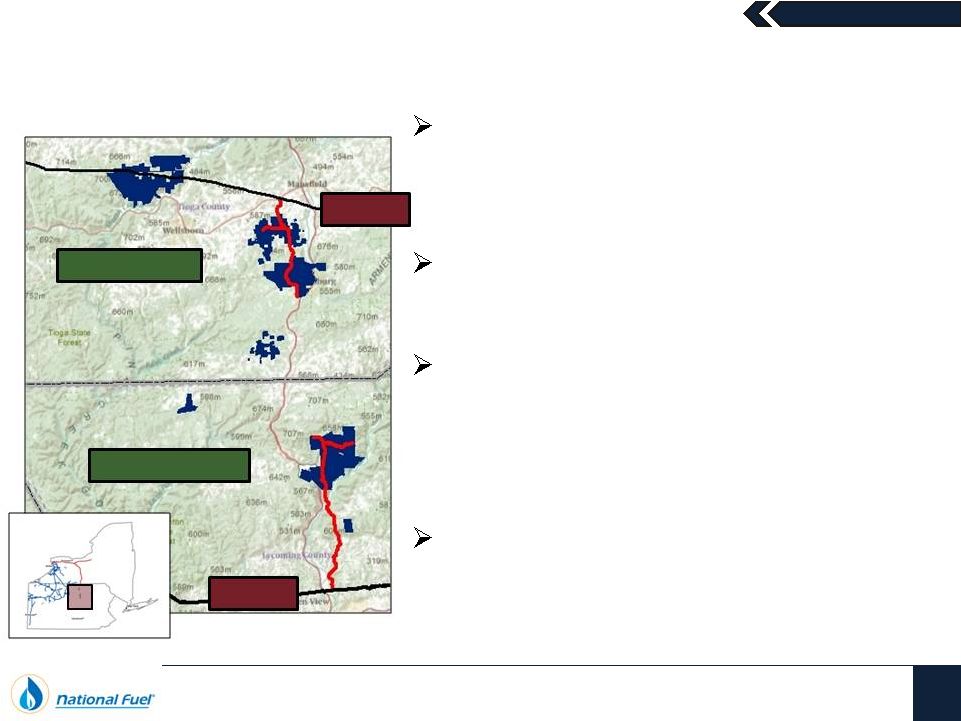
Using a History of Excellence to Serve Appalachian Producers
Midstream’s gathering systems are
critical to unlock remote, but highly
productive Marcellus acreage
History of operational success and
efficiency within Pennsylvania
Original priority had been to assist
Seneca’s growing development
program and utilize those systems to
gather 3
rd
party producer volumes
As a result of Seneca’s delayed
development plans, the current focus is
shifting to expanding infrastructure for
others in the basin
TGP 300
Transco
Tioga County
Lycoming County |
 September
2012 Pipeline & Storage
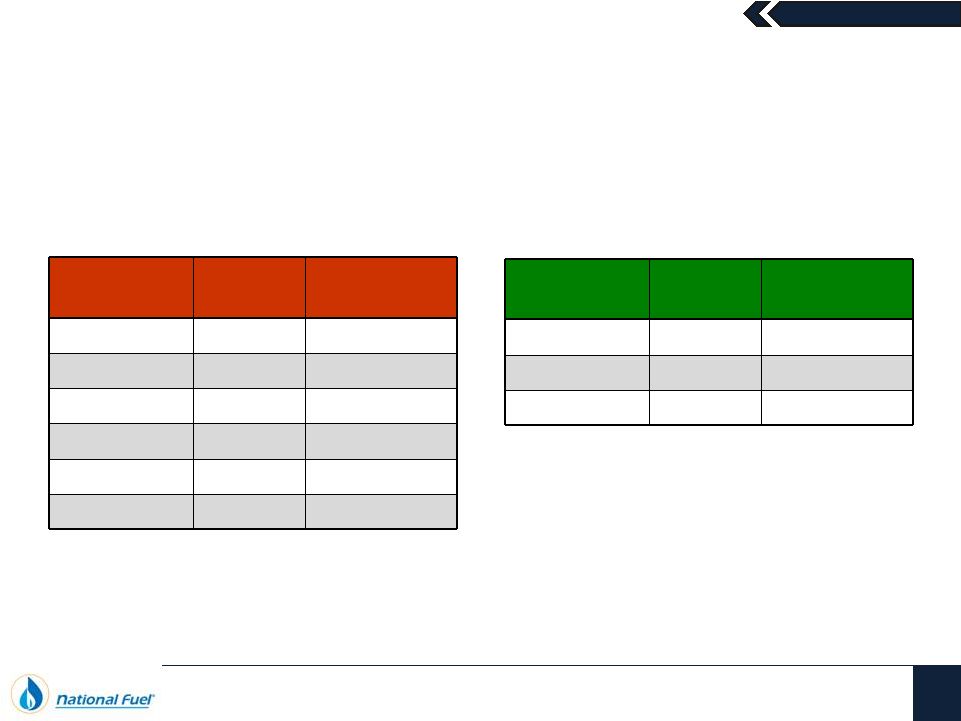
14
Regulatory Rate Filings
National Fuel Gas Supply Corporation
Empire Pipeline, Inc.
Filed a general rate case with FERC on
October 31, 2011 as part of an
agreement from a 2006 rate settlement
On April 14, 2012 an agreement in
principle was reached to settle the rate
case, with new rates effective May 1,
2012
Parties agreed to a cost of service of
$166.9 million
There was no agreed upon return on
equity (ROE)
A fuel tracker will replace the fuel
retainer of 1.4% in the previous rates
Filed a cost and revenue study on
March 14, 2012 as part of a 2006
FERC order related to Empire’s
transition to a FERC-regulated
interstate pipeline
Filing did not propose any changes
to the current rate structure |
 September
2012 Utility
15 |
 September
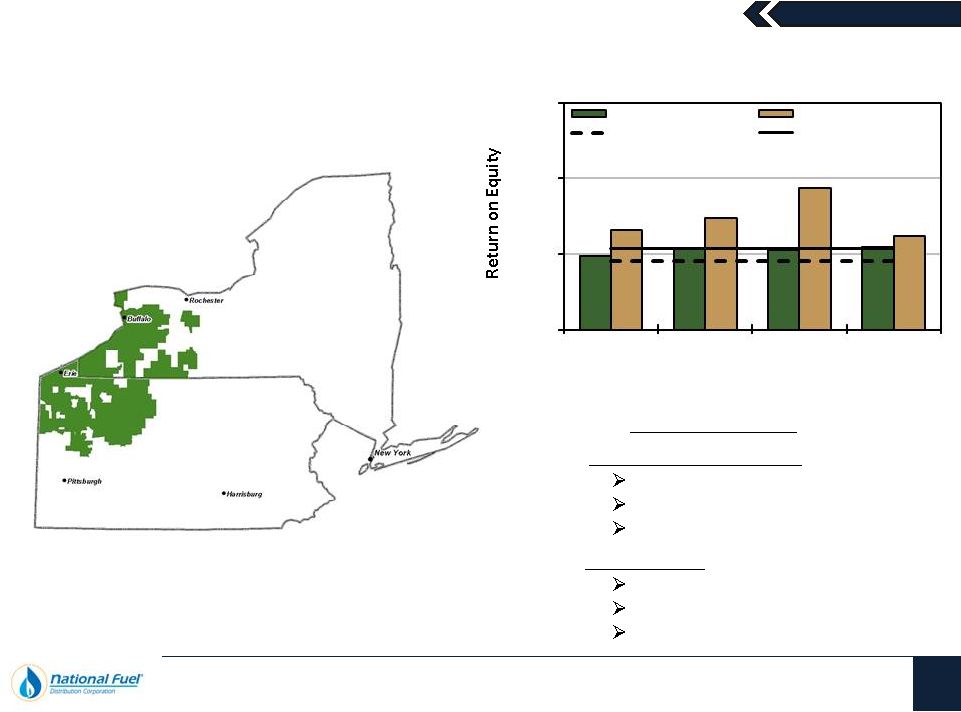
2012 Utility
16
Providing Financial Stability
9.8%
10.6%
10.5%
10.9%
13.2%
14.7%
18.8%
12.4%
0.0%
10.0%
20.0%
30.0%
2009
2010
2011
TME
6/30/2012
Fiscal Year
Return on Equity
NY
PA
Allowed ROE -
NY
Approx. Settled ROE -
PA
Rate Mechanisms
New York & Pennsylvania
Low Income Rates
Choice Program/POR
Merchant Function Charge
New York only
Revenue Decoupling
90/10 Sharing
Weather Normalization |
 September
2012 Utility
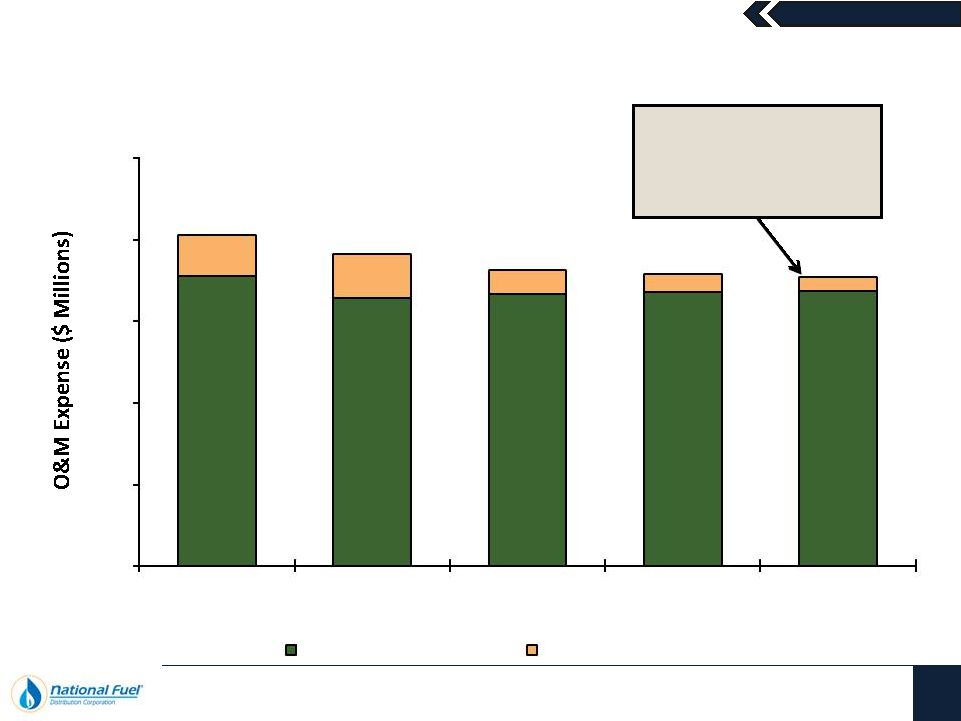
17
Continued Cost Control Helps Provide Earnings Stability
Low natural gas prices,
combined with a focus
on cost control, continue
to help reduce expenses
$178
$164
$167
$168
$168
$25
$27
$14
$11
$9
$203
$191
$181
$179
$177
$0
$50
$100
$150
$200
$250
2008
2009
2010
2011
12 Months Ended
June 30, 2012
Fiscal Year
All Other O&M Expenses
O&M Expense
-
Uncollectibles |
 September
2012 Utility
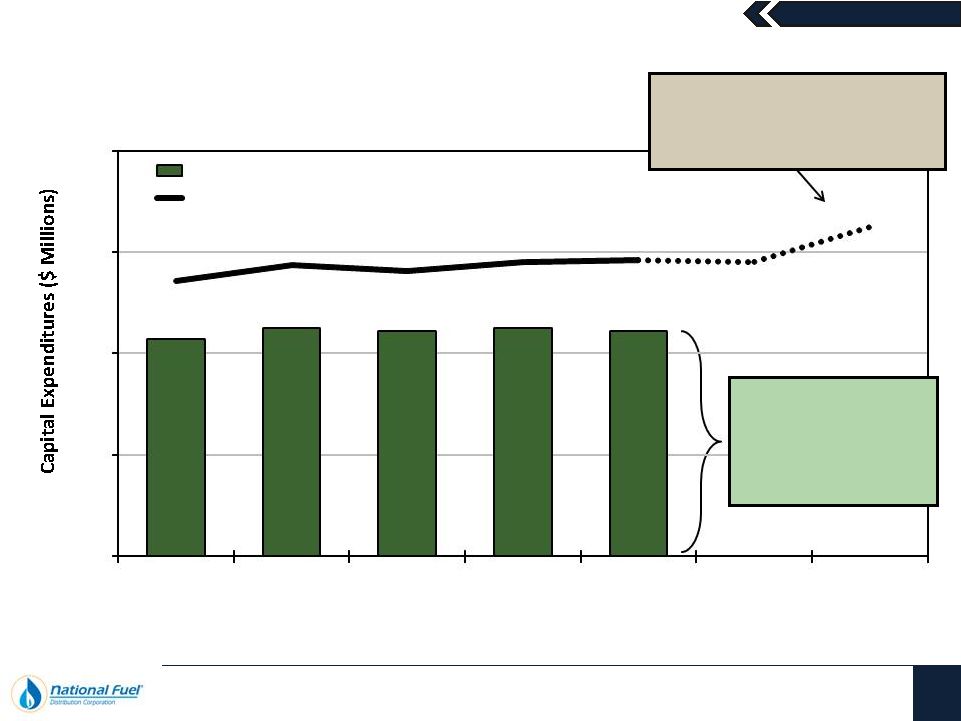
18
Strong Commitment to Safety
The anticipated increase in 2013
capital expenditures is largely due
to the implementation of a new
Customer Information System
$42.8
$45.1
$44.4
$45.0
$44.3
$54.2
$57.5
$56.2
$58.0
$58.4
$60
$70
$0
$20
$40
$60
$80
2007
2008
2009
2010
2011
2012
Forecast
2013
Forecast
Fiscal Year
Capital Expenditures for Safety
Total Capital Expenditures
$55-
$60-
The Utility remains
focused on consistent
spending to maintain
the ongoing safety and
reliability of its system |
 September
2012 Exploration & Production
19 |
 September
2012 Seneca Resources
20
Ongoing Strategic Responses to Low Gas Prices
Ongoing
Delineation in
Appalachia
Maintain Focus
on California
Crude Oil
Delaying
Marcellus
Completions
Reduction
in Rig Count
Production
Curtailment
Generated $175 million of EBITDA in the first nine months of fiscal 2012
Increased capital spending in California
Evaluate Marcellus rich-gas potential in the Western Development Area
Continue to delineate Seneca’s Utica Shale acreage potential
Delaying
completions
in
Tioga
County
(DCNR
Tract
595)
due
to
low
natural
gas prices on TGP 300
EOG
advised
Seneca
that
it
likely
will
not
be
drilling
any
wells
in
fiscal
2013
Seneca began fiscal 2012 with 6 rigs and will operate a 3 rig program in fiscal 2013
Managing production volumes and future completions in Tioga County, targeting
consistent
gross
volumes
of
130
MMcf
per
day
into
TGP
300,
which
is
equivalent
to existing firm sales commitments
Note: A reconciliation of Exploration & Production West Division EBITDA to Exploration &
Production Segment Net Income is included at the end of this presentation. |
 September
2012 Seneca Resources
21
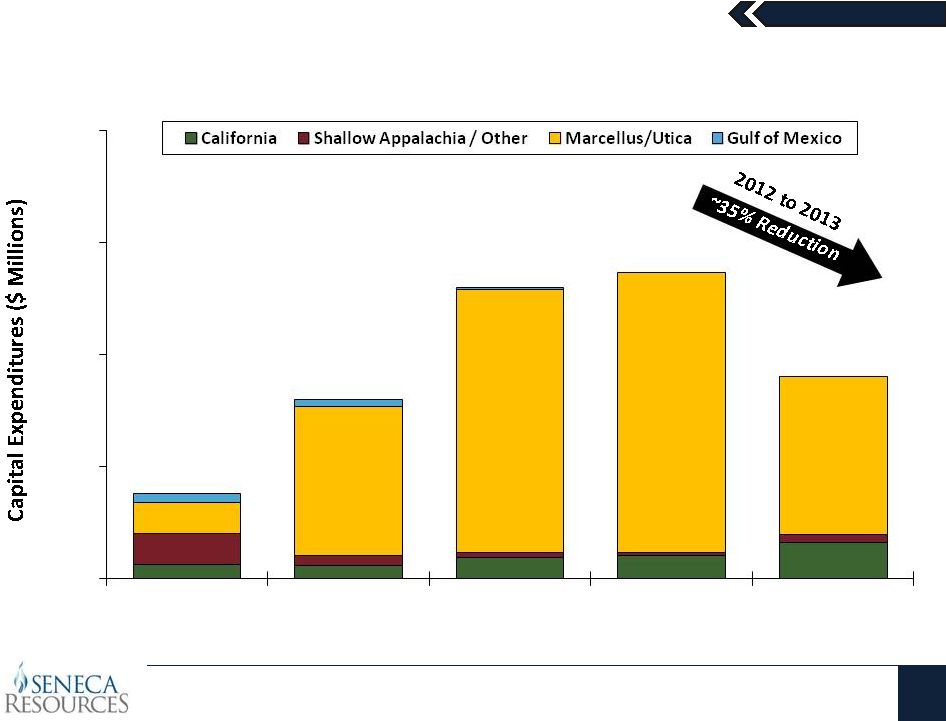
Increased California Spending with Ongoing Marcellus Cuts
(1)
Does not include the $34.9 MM acquisition of Ivanhoe’s U.S.-based assets in
California, as this was accounted for as an investment in subsidiaries on the
Statement of Cash Flows, and was not included in Capital Expenditures
$31
$31
(1)
$47
~$50
$70-$90
$68
$71
$332
$585
$625
-$640
$320
-
$385
$188
$398
(1)
$649
$675-$690
$400-$500
$0
$250
$500
$750
$1,000
2009
2010
2011
2012 Forecast
2013 Forecast
Fiscal Year |
 September
2012 Seneca Resources
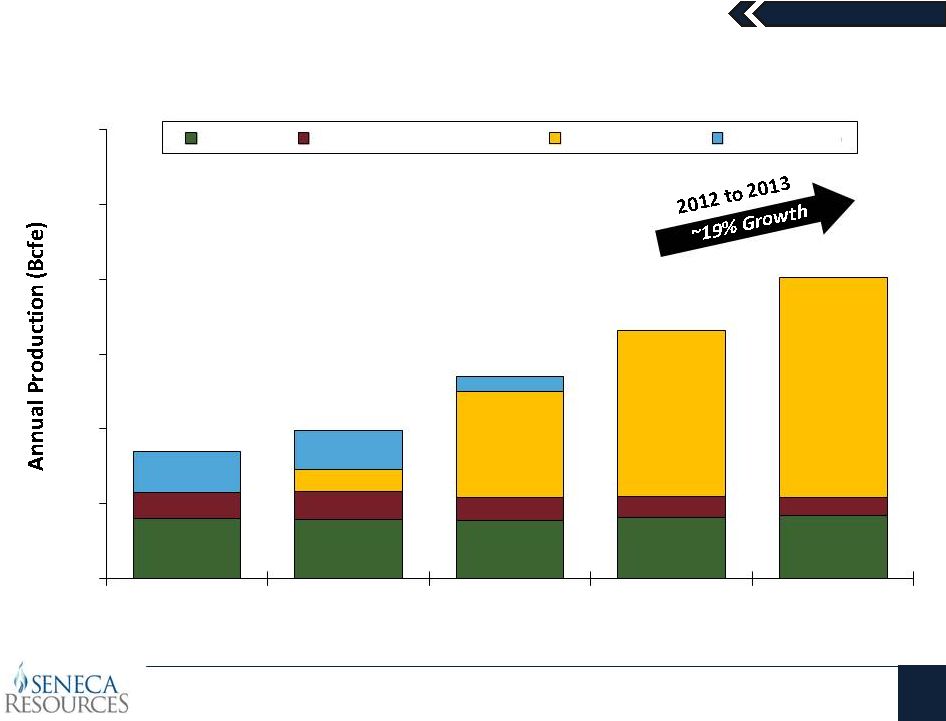
22
Production Still Growing
20.1
19.8
19.2
20
-
21
20
-
22
8.7
9.3
7.9
7
5-7
7.2
35.3
54
-
57
67
-
76
13.7
13.3
5.2
42.5
49.6
67.6
81
-
85
92
-
105
0
25
50
75
100
125
150
2009
2010
2011
2012 Forecast
2013 Forecast
Fiscal Year
California
Shallow Appalachia / Other
Marcellus/Utica
Gulf of Mexico |
 September
2012 Seneca Resources
23
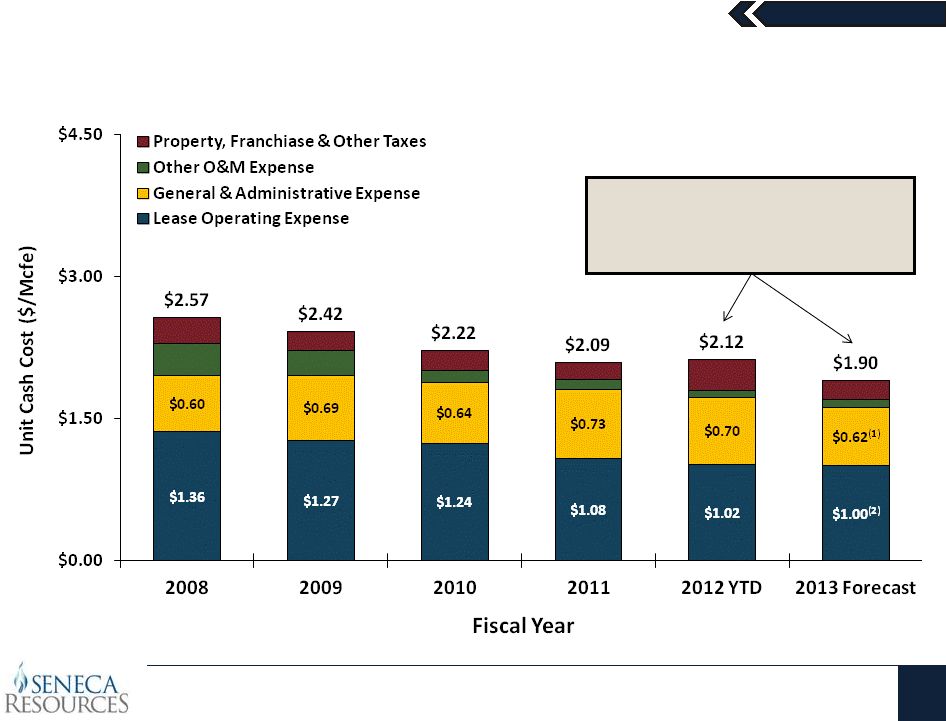
Continuing to Focus on Improving Its Cost Structure
The new Pennsylvania Impact Fee led to a
slight increase in 2012 unit cash costs,
however, costs are expected to decrease
~10% per unit from 2012 to 2013
(1)
Represents the midpoint of current General & Administrative Expense guidance of $59 to
$63 million, divided by the midpoint of current production guidance of 92 to 105 Bcfe
(2)
Represents the midpoint of current Lease Operating Expense Guidance of $0.90 to $1.10 per
Mcfe |
 September
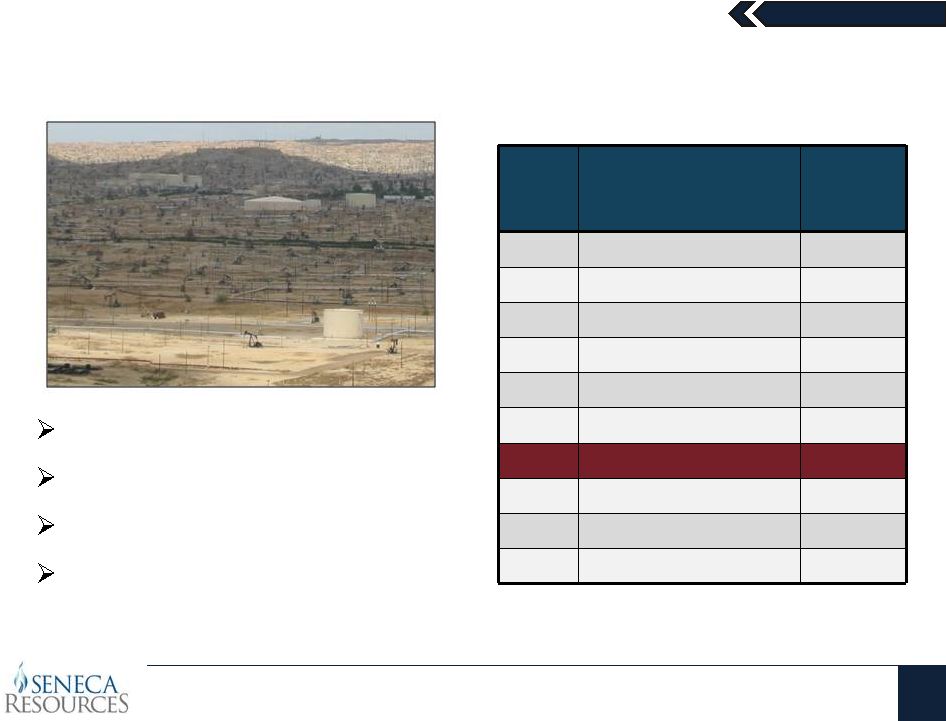
2012 California
24
Stable Production and Increasing Cash Flows
Net Acreage: 11,833 Acres
Net Wells: 1,322
Oil Gravity: 12 –
37°
Api
NRI: 87.64
Rank
Company
California
2011
BOEPD
1
Occidental
164,796
2
Chevron
163,153
3
Aera (Shell/Exxon)
149,974
4
Plains Exploration
36,775
5
Venoco Inc.
18,988
6
Berry Petroleum
18,872
7
Seneca Resources
9,209
8
Macpherson Oil
9,022
9
E&B Natural Resources
5,992
10
ExxonMobil
3,238 |
 September
2012 California
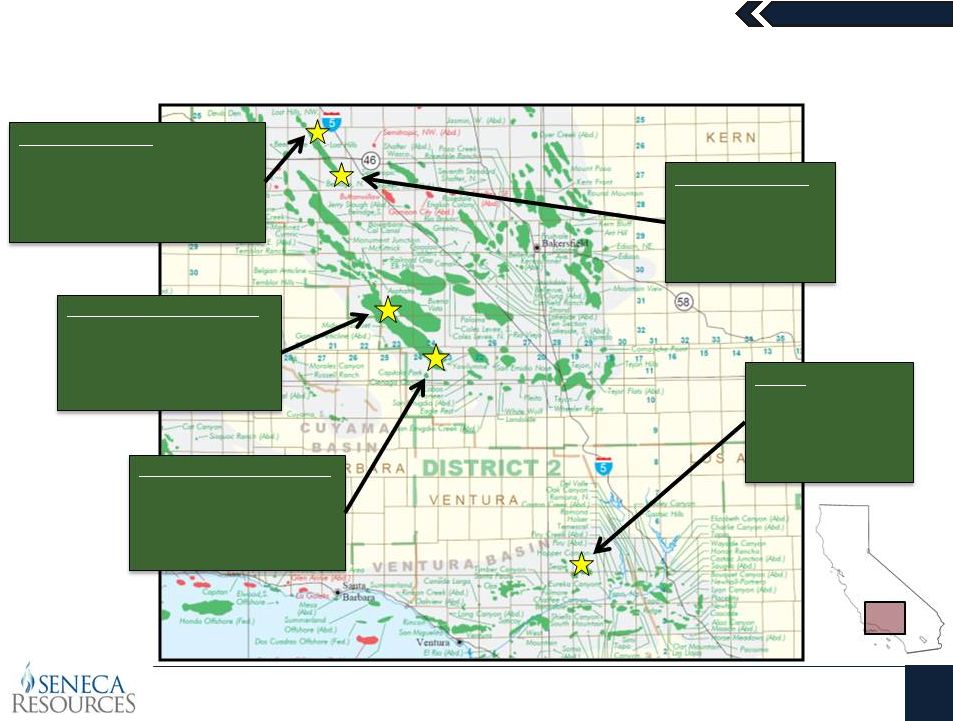
25
Stable Production Fields
South Lost Hills
~1,700 BOEPD
Monterey Shale
Primary
215 Active Wells
Sespe
~1,200 BOEPD
Sespe Formation
Primary
188 Active Wells
North Lost Hills
~1,200 BOEPD
Tulare & Etchegoin Formation
Primary & Steamflood
181 Active Wells
North Midway Sunset
~4,300 BOEPD
Potter & Tulare Formation
Steamflood
728 Active Wells
South Midway Sunset
~1,000 BOEPD
Antelope Formation
Steamflood
109 Active Wells |
 September
2012 California
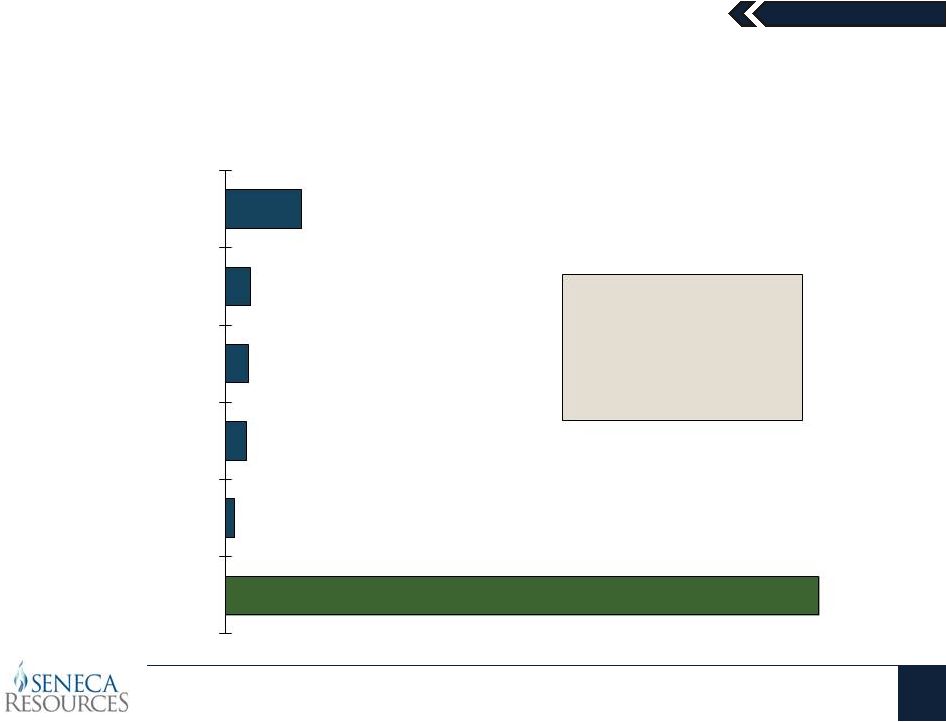
26
Strong Margins Support Significant Free Cash Flow
Average Revenue
in First Nine Months
of Fiscal 2012
$86.23 per BOE
$8.64
$2.83
$2.60
$2.37
$1.03
$67.64
Non-Steam Fuel LOE
Steam Fuel
G&A
Production & Other Taxes
Other Operating Costs
EBITDA
Fiscal Year 2012 (First Nine Months) EBITDA per BOE
Note: A reconciliation of Exploration & Production West Division EBITDA to Exploration
& Production Segment Net Income is included at the end of this presentation. |
 September
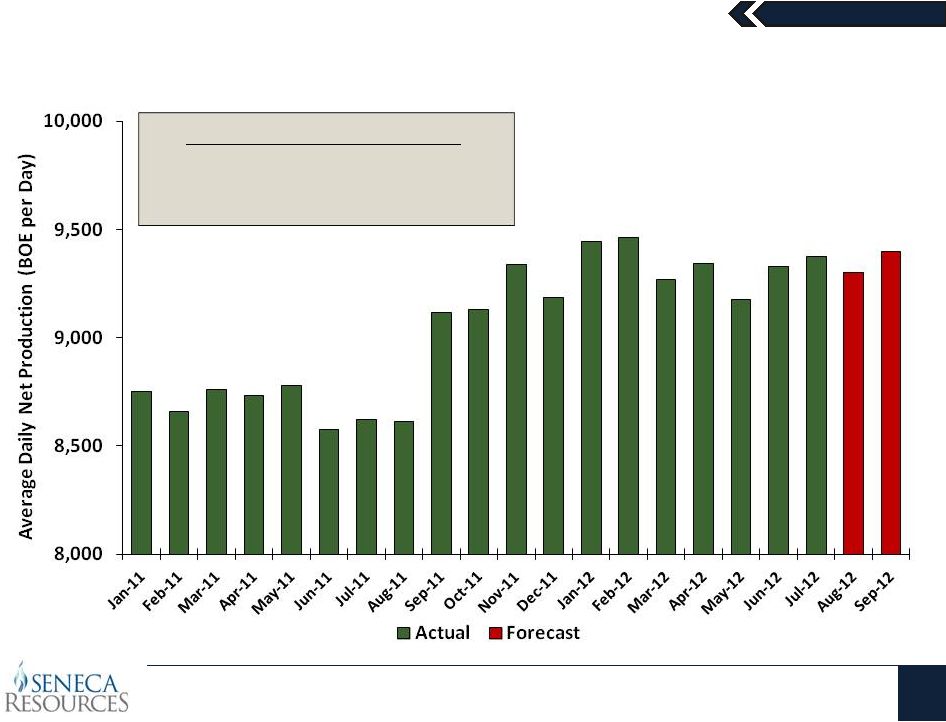
2012 Seneca Resources
27
California –
Recent Initiatives Driving Near-Term Growth
1.
North Midway Sunset Steaming
2.
South Midway Sunset Field Extensions
3.
Sespe Infill Drill Program
Production Increase Drivers |
 September
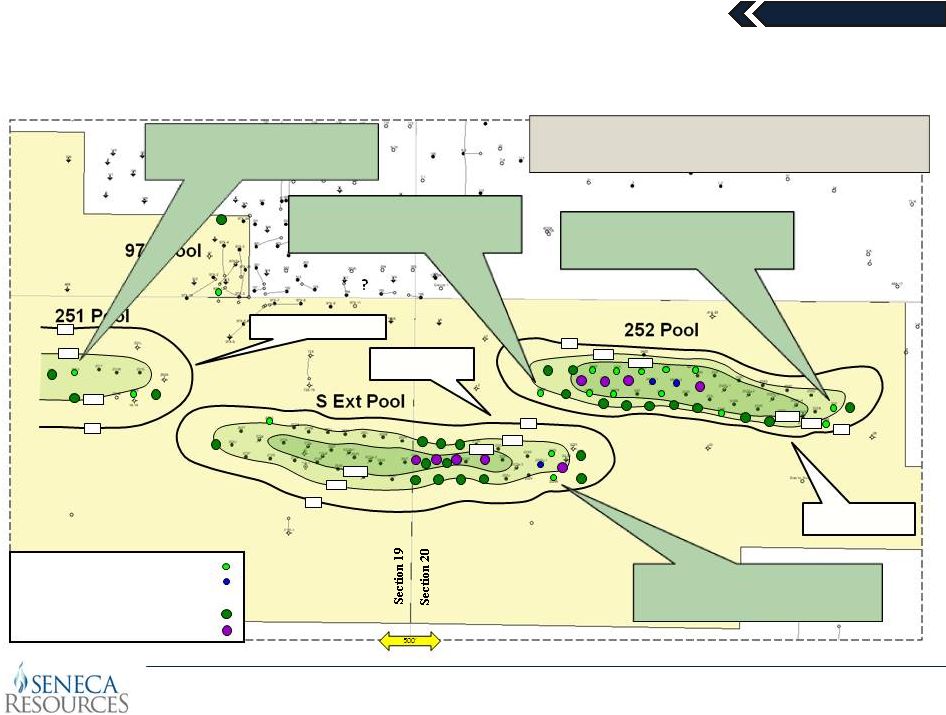
2012 Midway Sunset South Activity Update
Seneca Resources
?
500’
2012 Drill Program: 21 Wells / 3 Injectors
2013
Drill
Program:
17
-
23
Wells
/
5
-
9
Injectors
0 ft
50 ft
100 ft
100 ft
50 ft
50 ft
Antelope “A-1”
and “A-2”
Sands
Antelope “B”
and “C”
Sands
Antelope “A-1”
Sand
Seneca Western Minerals 232M
Extended 252 Pool to the West
Seneca Western Minerals 252I
Extended 252 Pool to the East
Seneca Western Minerals 222W
Extended S Ext Pool to the East
Seneca Western Minerals 251U
Extended 251 Pool to the West
100 ft
50 ft
100 ft
50 ft
0 ft
50 ft
0 ft
0 ft
0 ft
0 ft
2012 Drill Program
Producers
Injectors
2013 Drilling Locations
Producers
Injectors |
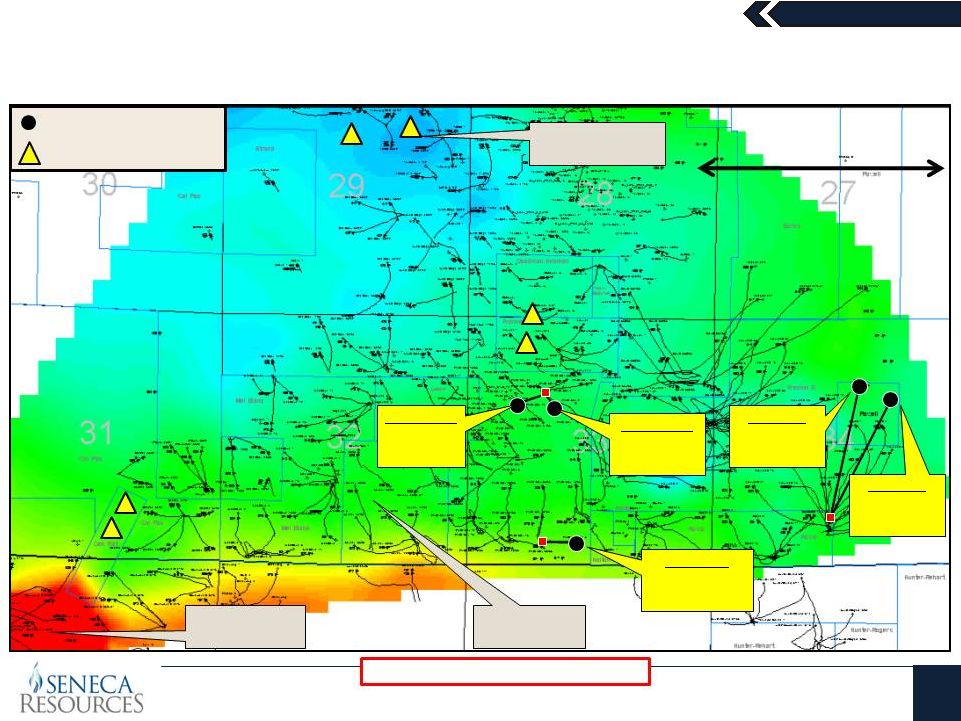 September
2012 29
350’
Thick
(Medium Blue)
800’
Thick
(Dark Red)
~550’
Thick
(Green)
Powell 4
61 BOEPD
1
Oil
11/11
WS 534-33
42 BOEPD
WS 48-33
1
Production
August 2012
WS 533-33
88 BOEPD
“X”
SANDS ISOCHORE (Thickness)
Seneca Resources
Sespe Field –
2011 & 2012 Drilling Programs and Results
Powell 3
136 BOEPD
1
Oil
10/11
1 Mile
2011 Sespe Wells (5)
2012 Sespe Wells (6)
st
st
st
1 Oil 1/12
1
Oil 1/12
st
st |
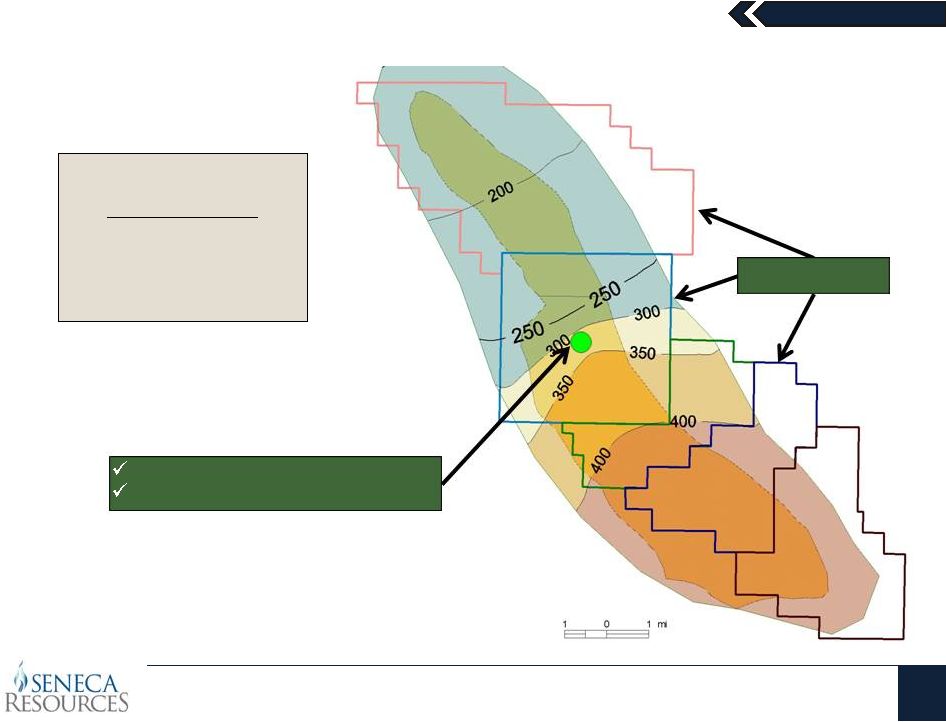 September
2012 Seneca Resources
30
Monterey Shale Play
Monterey Shale Play
Belridge Field
5 AMIs across the field
Seneca WI: 12.5%
Seneca NRI: 11.1%
Producing (Gross): 50 BOPD
3-4 Delineation Wells Planned
AMI Outlines
Gross Thickness of Monterey Interval |
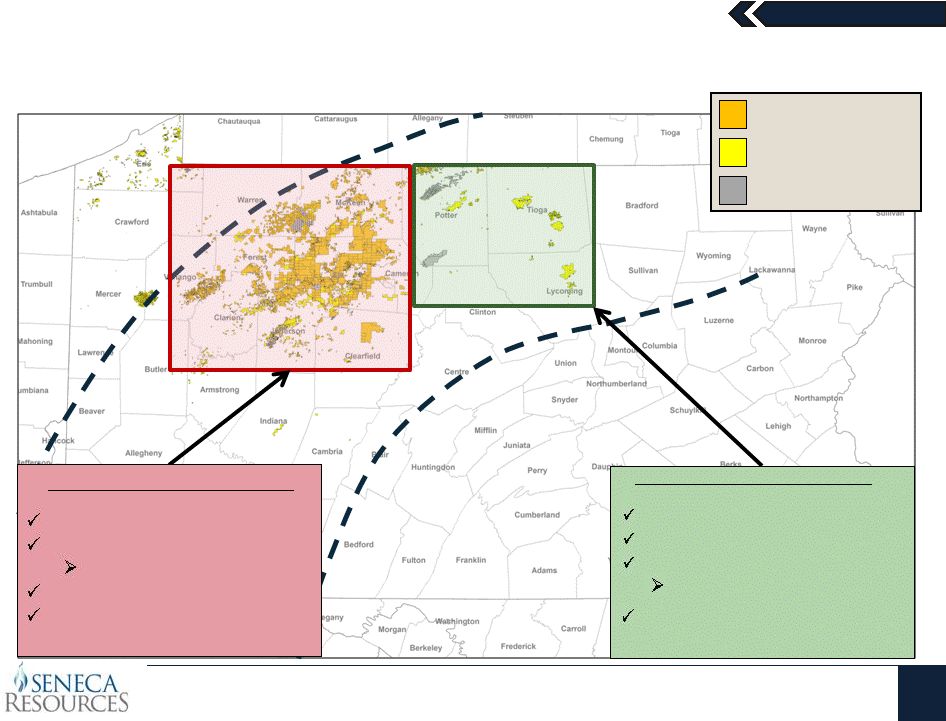 September
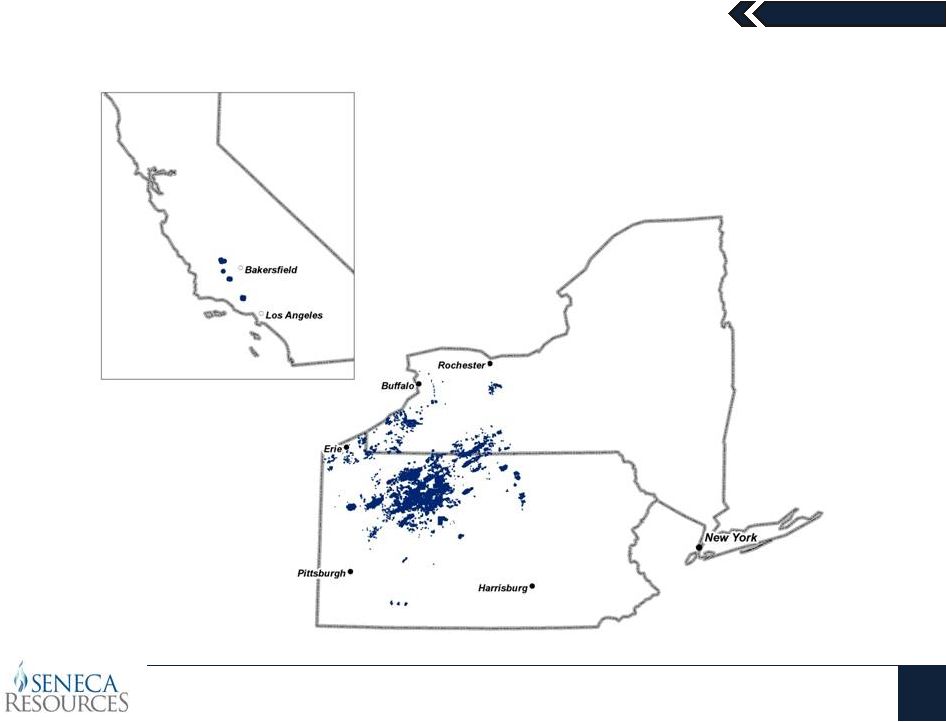
2012 Seneca Resources
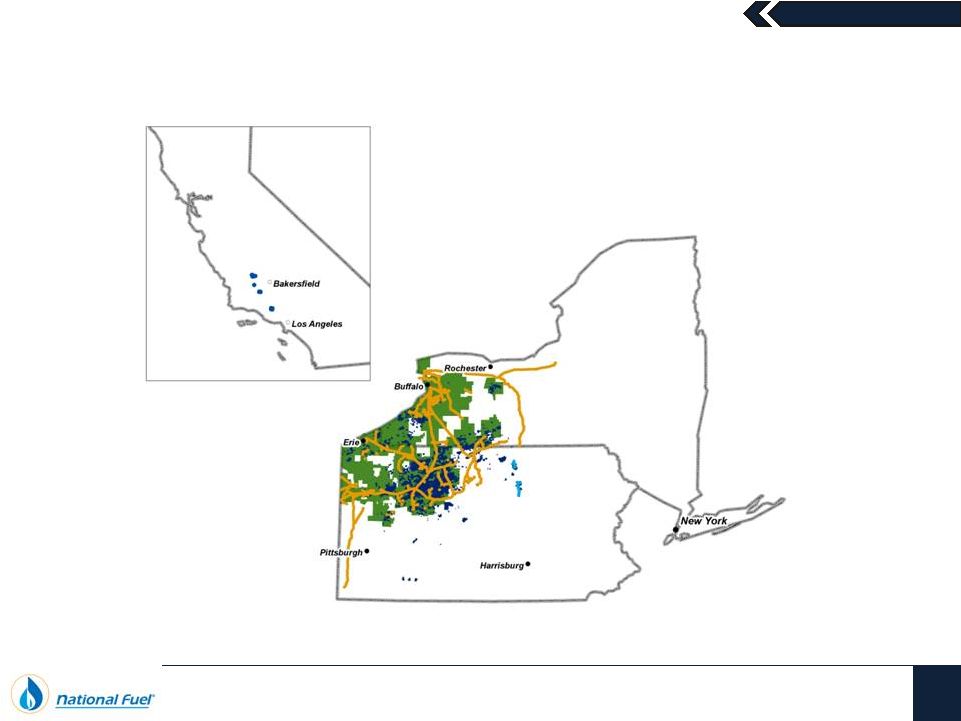
31
Expansive Pennsylvania Acreage Position
SRC Lease Acreage
SRC Fee Acreage
NFG Storage Acreage
Evaluating Marcellus rich-gas
and Utica Shale potential
Ongoing development drilling in
Tioga and Lycoming Counties
Eastern Development Area
Net Acreage: 55,000 acres
Mostly leased (16-18% royalty)
No near-term lease expiration
First large expiration: 2018
Western
Development
Area
Net
acreage:
~700,000
acres
Own
most
mineral
rights
Minimal
royalty
obligation
Minimal
lease
expiration |
 September
2012 Seneca Resources
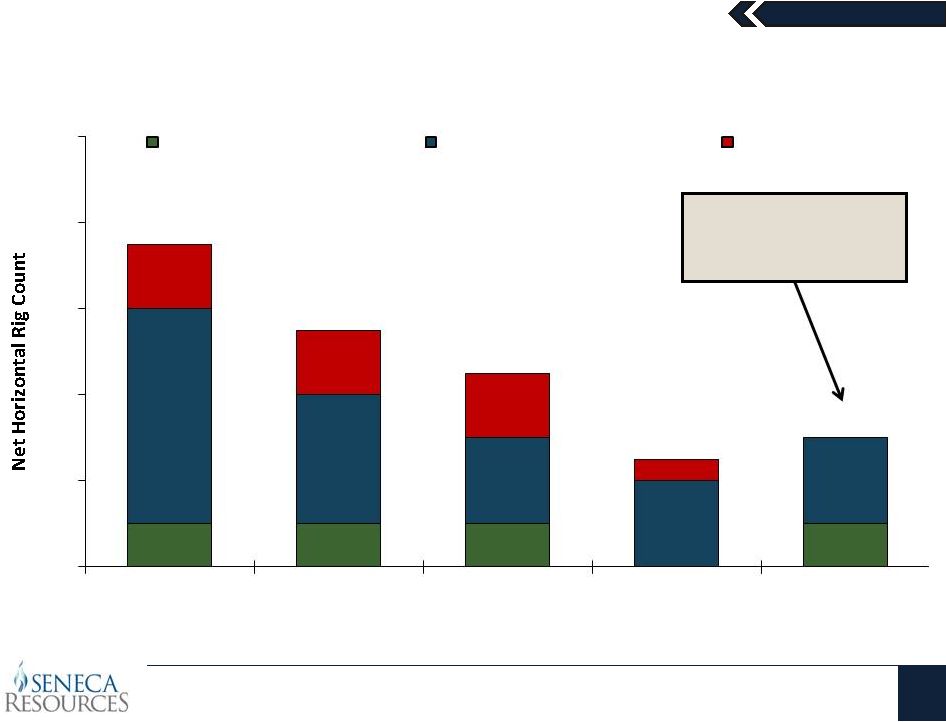
32
Net Rig Count (Working Interest)
Seneca anticipates
minimal joint venture
activity in fiscal 2013
1.0
1.0
1.0
1.0
5.0
3.0
2.0
2.0
2.0
1.5
1.5
1.5
0.5
7.5
5.5
4.5
2.5
3.0
0
2
4
6
8
10
Fiscal 2012 -
Q1
Fiscal 2012 -
Q2
Fiscal 2012 -
Q3
Current
Fiscal 2013
Rig Count
Forecast
-
-
Development
EOG Operated
Delineation
Seneca Operated
Seneca Operated |
 September
2012 Seneca Resources
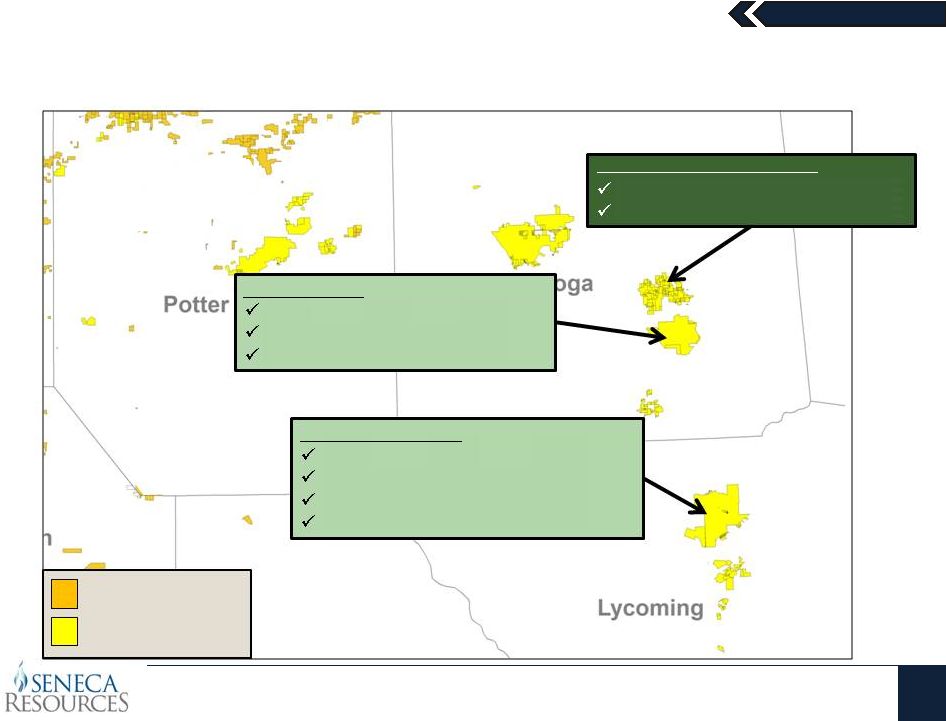
33
Eastern Development Area (EDA) –
Results & Plan Forward
SRC Lease Acreage
SRC Fee Acreage
IPs: 10 –
15 MMCFD
Gross Production: ~30-35 MMcf per Day
19 Wells Drilled
5 Wells Producing
DCNR
Tract
100
Area
Gross Production: ~70 MMcf per Day
33 Wells Drilled
19 Wells Producing
DCNR Tract 595
47 Wells Drilled and Producing
Gross Production: ~80 MMcf per Day
Covington
–
Fully
Developed |
 September
2012 Seneca Resources
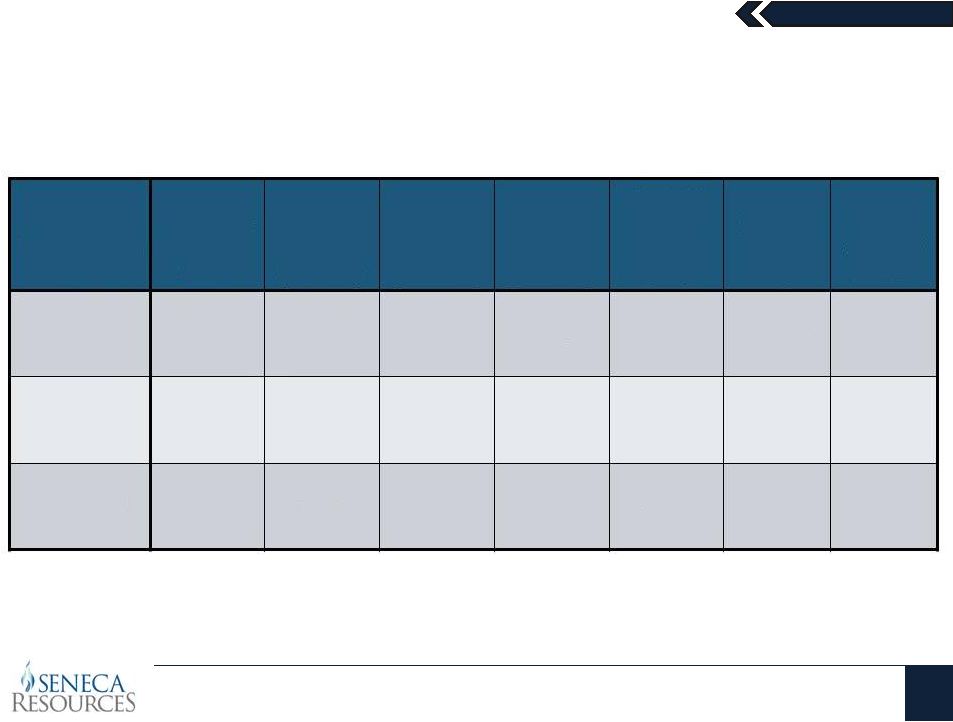
34
Lycoming and Tioga Counties Are Highly Productive Areas
Development
Area
Producing
Well
Count
Average
IP Rate
(MMcf/d)
Average
7-Day
(MMcf/d)
Average
30-Day
(MMcf/d)
Average
EUR
per Well
(Bcf)
Average
Lateral
Length
EUR per
1,000’
of
Lateral
Covington
(Tioga
County)
Tract 595
(Tioga
County)
47
5.2
4.7
4.1
5.1
4,049’
1.3
19
6.9
6.0
5.0
6.5
1.4
4,537’
Tract 100
(Lycoming
County)
4
12.4
11.0
9.5
10.8
5,525’
2.0 |
 September
2012 Seneca Resources
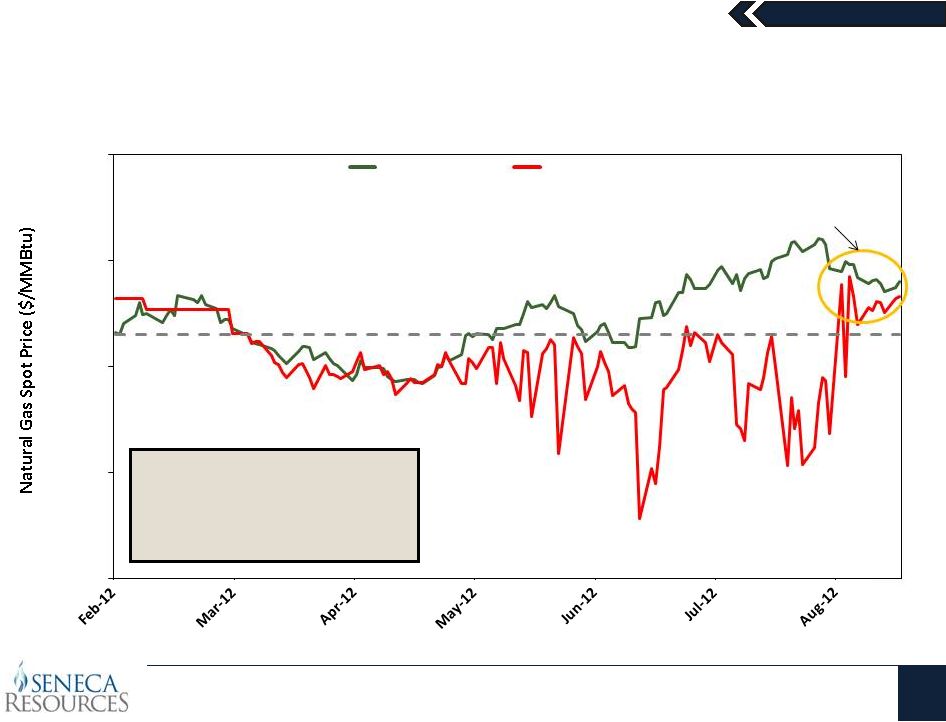
35
TGP 300 Pricing Dynamics Led to Production Curtailments
When TGP Zone 4 pricing was below
$2.30, Seneca’s production was
limited to its ~130 MMcf/d of firm
sales commitments at prices more
favorable than the spot market
In August, price
improvements
limited curtailments
Data provided by Bloomberg
$0.00
$1.00
$2.00
$3.00
$4.00
Henry Hub
TGP Zone 4 |
 September
2012 Seneca Resources
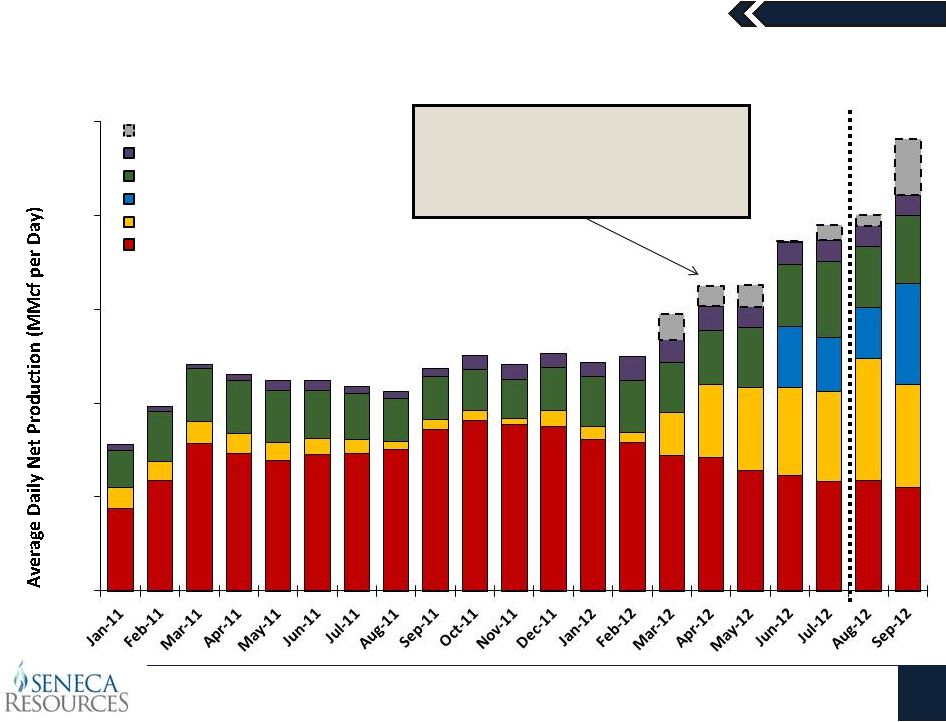
36
Ramping Marcellus Shale Production
Forecast
The gray bar represents potential
production into TGP 300 curtailed, in
excess of firm sales volumes, during the
month due to local spot prices below
$2.30/MMBtu
0
50
100
150
200
250
TGP 300 Curtailed Volumes
WDA/Other
EOG JV
Lycoming
DCNR 595
Covington |
 September
2012 Seneca Resources
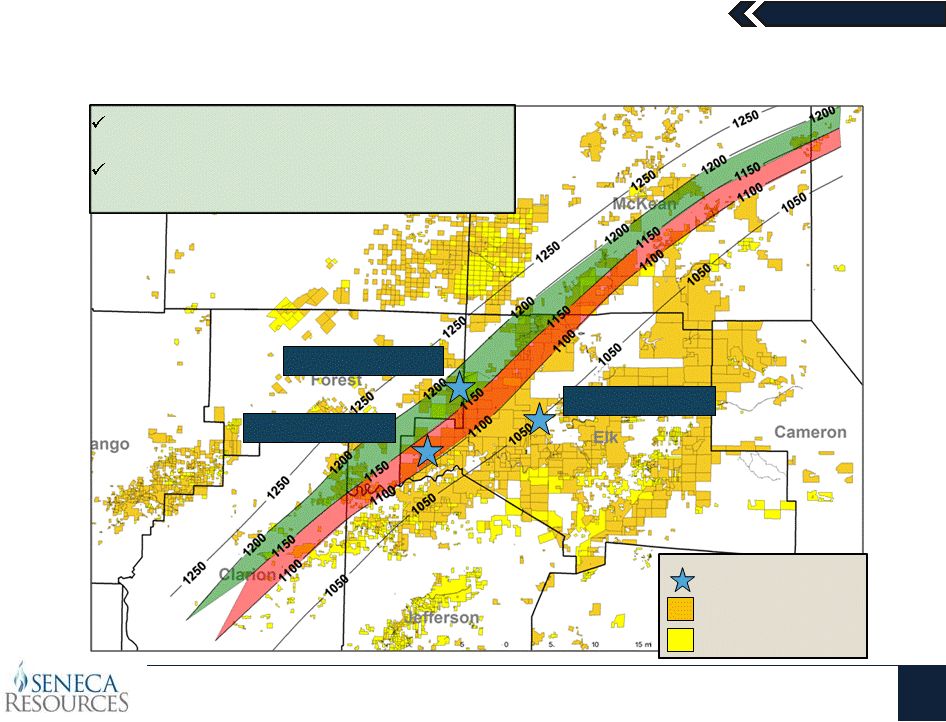
37
Evaluating Marcellus Wet Gas Potential
SRC Lease Acreage
SRC Fee Acreage
Proposed Hz Well
More than 100,000 acres within the
targeted window
of 1,100 Btu to 1,200 Btu
Will need cryogenic processing plant
running in “ethane rejection mode”
processing
Church Run (1 Well)
Owl’s Nest (2 Wells)
Ridgway (1 Well) |
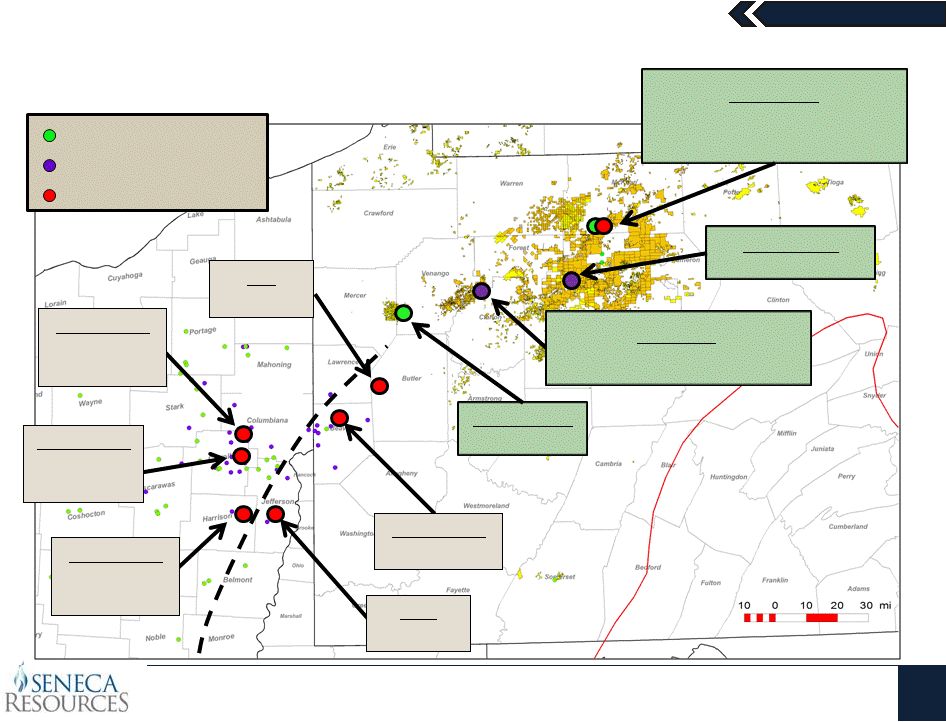 September
2012 38
Dry
Wet
Utica Shale –
Activity Summary
Seneca Resources
Chesapeake
9.5 MMCFD
1,425 BLPD
Chesapeake
3.8 MMCFD
980 BLPD
Chesapeake
3.1 MMCFD
1,015 BLPD
Hess
11 MMCFD
Chesapeake
6.4 MMCFD
Rex
9.2 MMCFD
Vertical Well Drilled
Horizontal Well Permit
Horizontal Well Drilled
Mt. Jewett
Vertical: Tested Dry Gas
Horizontal: Completing Fall 2012
Owl’s Nest
Horizontal FY2013
Tionesta
Horizontal: Completing Fall 2012
Henderson
Vertical Well |
 September
2012 National Fuel Gas Company
39
Appendix |
 September
2012 National Fuel Gas Company
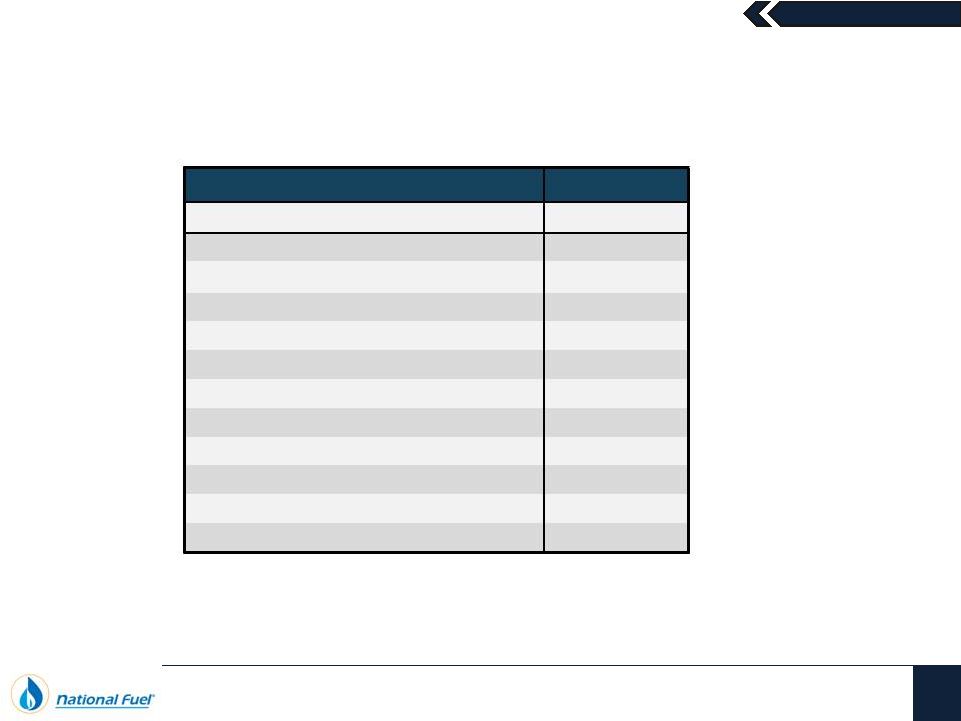
40
Fiscal Year 2013 Earnings Guidance Drivers
2013 Forecast
GAAP Earnings per Share
$2.45 -
$2.75
Exploration & Production Drivers
Total Production (Bcfe)
92 -
105
DD&A Expense
$2.30 -
$2.40
LOE Expense
$0.90 -
$1.10
G&A Expense
$59 -
$63 MM
Pipeline & Storage Drivers
O&M Expense
+3%
Revenue
$255 -
$265 MM
Utility Drivers
O&M Expense
+3%
Normal Weather in PA |
 September
2012 National Fuel Gas Company
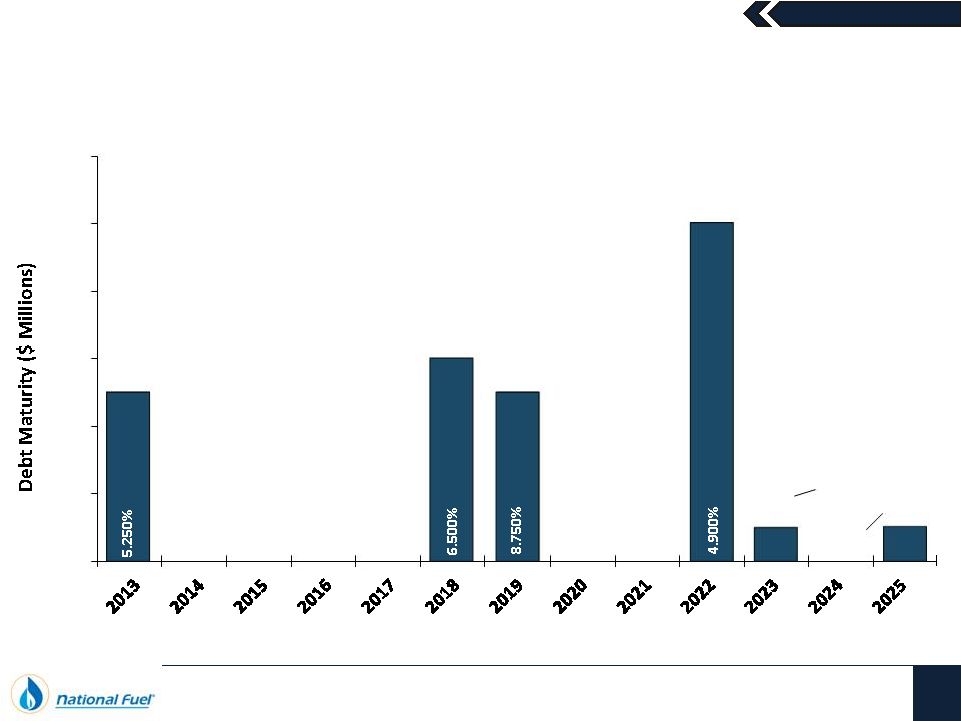
41
Manageable Debt Maturity Schedule
$250
$300
$250
$500
$49
$50
7.395%
7.375%
$0
$100
$200
$300
$400
$500
$600
Fiscal Year |
 September
2012 National Fuel Gas Company
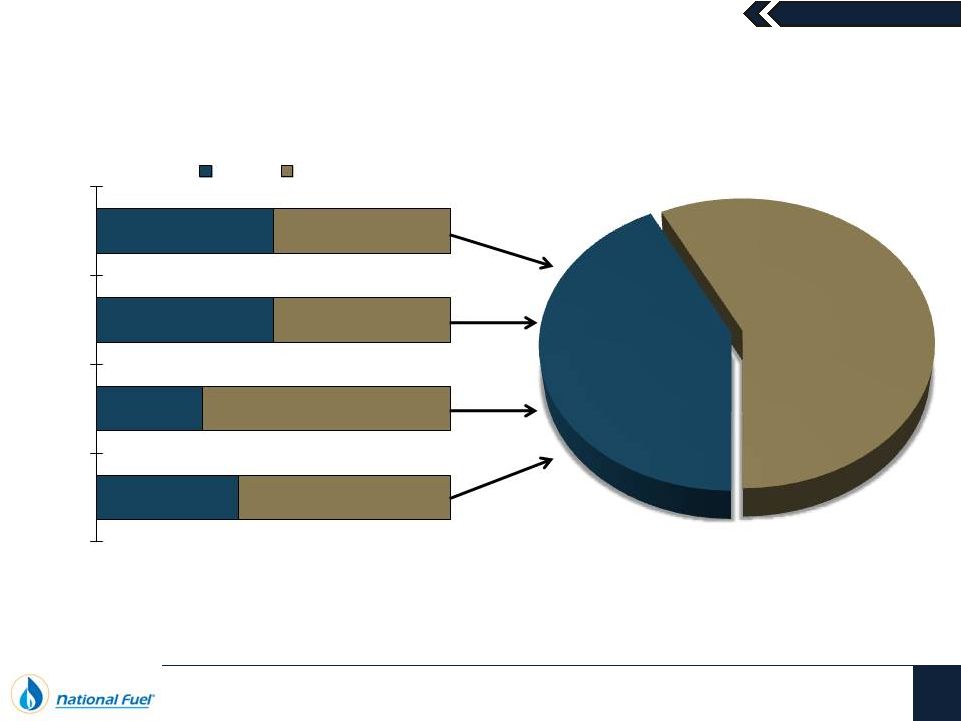
42
Targeted Capital Structure
Long-Term Consolidated
Capital Structure Target
Capital Structure
Targets by Segment
Debt
35% -
45%
Equity
55% -
65%
40%
50%
50%
70%
50%
All Other
E&P
P&S
Utility
Debt
Equity
30%
60%
50% |
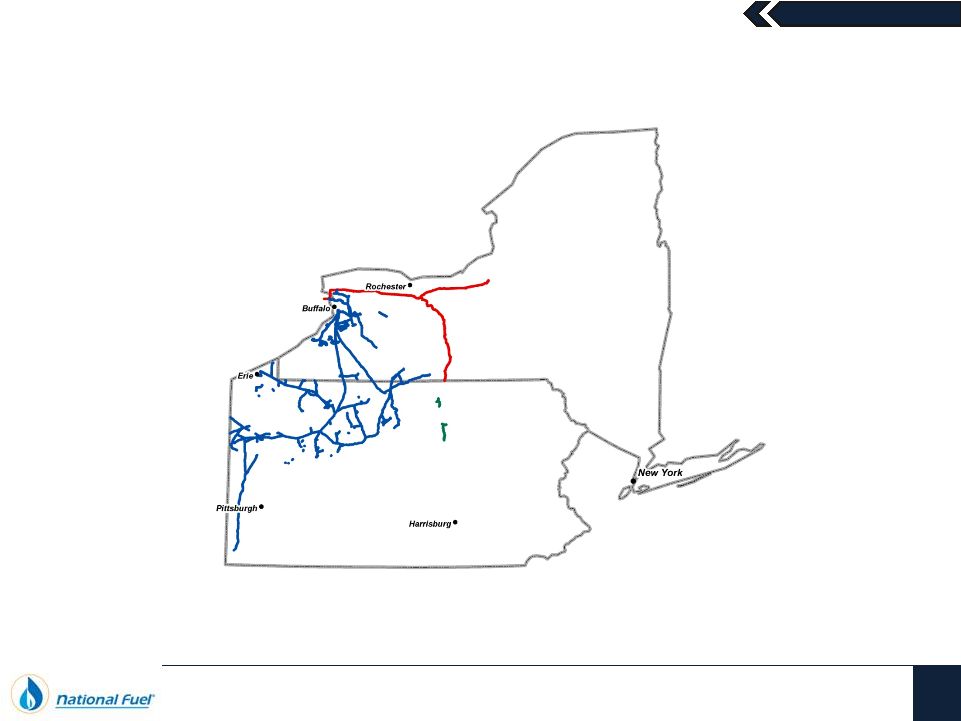 September
2012 Pipeline & Storage / Midstream
43
Appendix |
 September
2012 Pipeline & Storage
44
Expansion Initiatives
Project Name
Capacity
(Dth/D)
Est.
CapEx
In-Service
Market
Status
Lamont Compressor Station
40,000
$6 MM
6/2010
Fully Subscribed
Completed
Lamont Phase II Project
50,000
$7.6 MM
7/2011
Fully Subscribed
Completed
Line “N”
Expansion
160,000
$22 MM
10/2011
Fully Subscribed
Completed
Tioga County Extension
350,000
$56 MM
11/2011
Fully Subscribed
Completed
Northern Access Expansion
320,000
~$75 MM
~11/2012
Fully Subscribed
Currently under construction
Line “N”
2012 Expansion
163,000
~$43 MM
~11/2012
Fully Subscribed
Currently under construction
Line “N”
2013 Expansion
30,000
~$4 MM
11/2013
OS Concluded
Negotiating with an anchor shipper for all
capacity
Mercer Expansion Project
150,000
~$30 MM
~6/2014
OS Concluded
In discussions with an anchor shipper
Central Tioga County
Extension
~260,000
~$135 MM
2014/2015
OS Concluded
In discussions with an anchor shipper
West to East
~425,000
~$290 MM
~2015
29% Subscribed
Marketing continues with producers in
various stages of exploratory drilling
Total Firm Capacity: ~1,948,000 Dth/D
Capital Investment: ~$669 MM |
 September
2012 Midstream Corporation
45
Expansion Initiatives
Project Name
Capacity
(Mcf/D)
Est.
CapEx
In-Service
Date
Market
Comments
Covington Gathering System
220,000
$54 MM
Multiple
Phases -
Most
In-Service
Capacity
Available
[Marketing to
Third Parties]
Completed
–
Flowing into TGP 300
Line. This includes $30
million of current and future
spending to build compression
and pipeline to connect
additional wells
Trout Run Gathering System
466,000
$130 MM
May 2012
Capacity
Available
[Marketing to
Third Parties]
Completed
–
Flowing into Transco
Leidy Line. This includes $55
million of current and future
spending to build compression
and pipeline to connect
additional wells
Owl’s Nest Gathering System
200,000
$110 MM
First Phase
FY2014
Fully Subscribed
Preliminary work underway with
development phased in over a five
year period. Any processing costs
would be incremental.
Total Firm Capacity: ~886,000 Mcf/D
Capital Investment: ~$294 MM |
 September
2012 Exploration & Production
46
Appendix |
 September
2012 National Fuel Gas Company
47
Hedge Positions and Strategy
Natural Gas
Swaps
Volume
(Bcf)
Average
Hedge Price
Fiscal 2012
(1)
12.4
$4.99 / Mcf
Fiscal 2013
46.7
$4.82 / Mcf
Fiscal 2014
27.4
$4.26 / Mcf
Fiscal 2015
17.8
$4.07 / Mcf
Fiscal 2016
17.9
$4.07 / Mcf
Fiscal 2017
17.9
$4.07 / Mcf
Oil Swaps
Volume
(MMBbl)
Average
Hedge Price
Fiscal 2012
(1)
0.4
$77.03 / Bbl
Fiscal 2013
1.5
$92.52 / Bbl
Fiscal 2014
0.6
$95.68 / Bbl
Most hedges executed at sales point to eliminate basis risk
(1)
Fiscal 2012 hedge positions are for the remaining three months of the fiscal year
Seneca has hedged approximately 57% of its
forecasted production for Fiscal 2013 |
 September
2012 Marcellus Shale
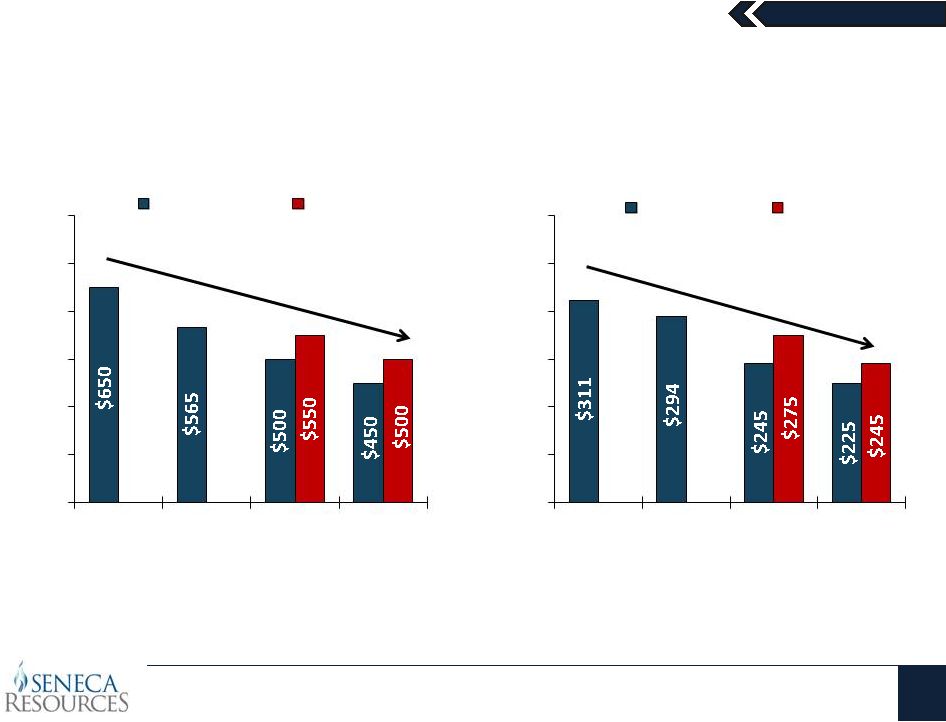
48
Targeting Continued Cost Reductions
$200
$300
$400
$500
$600
$700
$800
2010
2011
2012
Forecast
2013
Target
Drilling Cost per Lateral Foot
WDA/DCNR 595
DCNR 100
$100
$150
$200
$250
$300
$350
$400
2010
2011
2012
Forecast
2013
Target
Completion Cost per Stage ($000)
WDA/DCNR 595
DCNR 100 |
 September
2012 Marcellus Shale
49
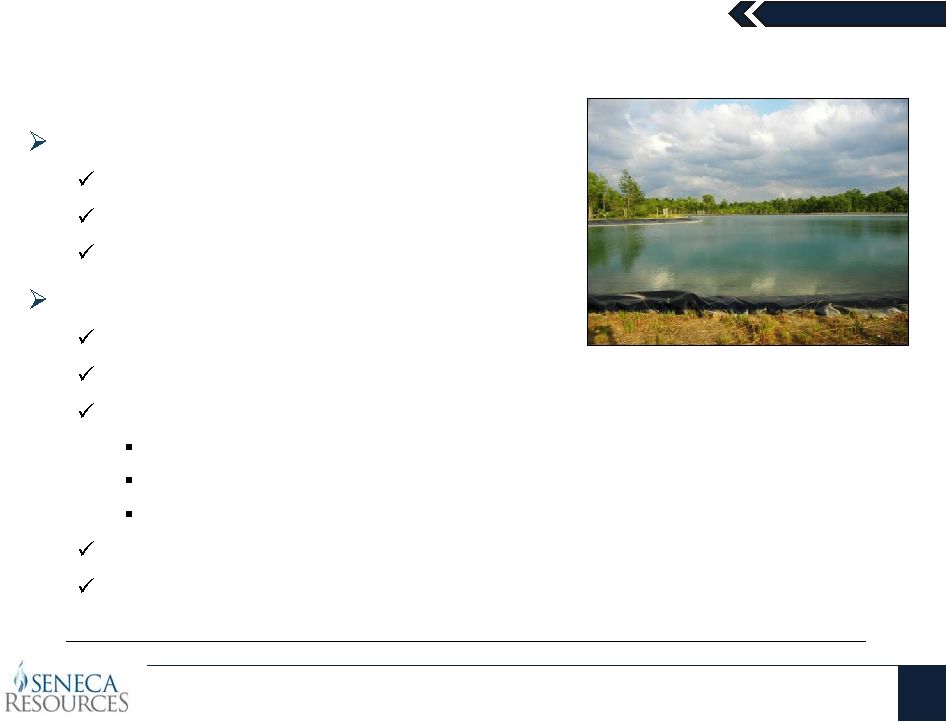
Water Management Program
Water Sourcing:
Coal mine runoff
Permitted freshwater sources
Recycled water
Water Management:
Instituted a “Zero Surface Discharge”
policy
Recycle Marcellus flowback and produced water
Centralized water handling in development areas
Tioga County –
DCNR 595 and Covington
Lycoming County –
DCNR 100
Elk County -
Owl’s Nest
Installing new evaporative technology
Investigating underground injection
Seneca is committed to protecting the surface from any type of pollution
|
 September
2012 Marcellus Shale
50
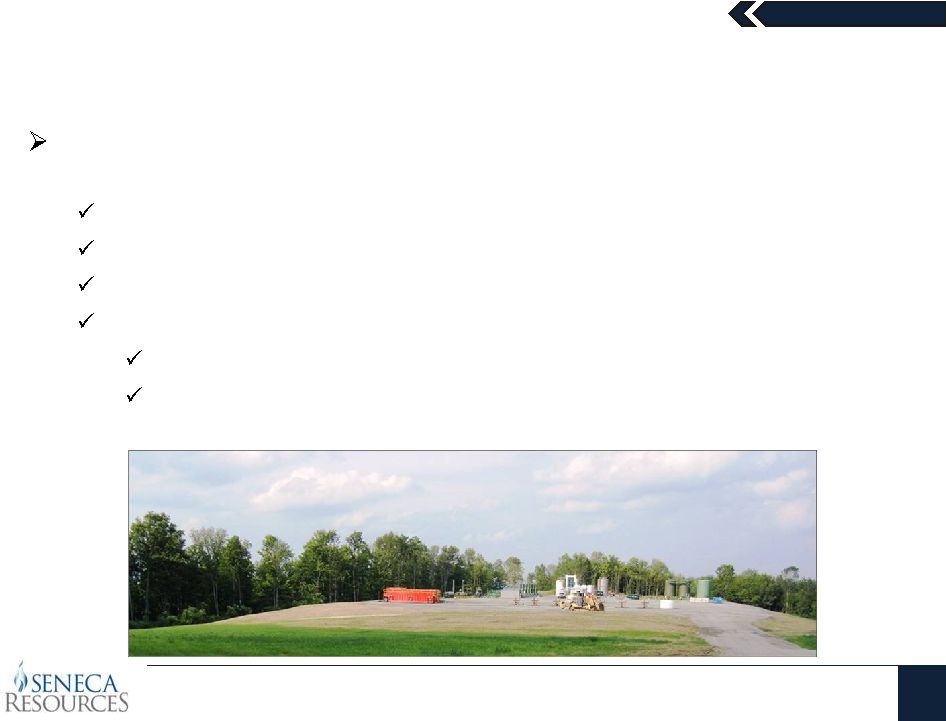
“Zero Liquid Discharge Operation”
Utilizing a state-of-the-art evaporative technology to ensure no liquid is
discharged at the surface
Building a centrally located unit in Eastern Development Area (EDA)
Removes all liquids from the production stream
Has the ability to be powered by the waste heat from a compressor station
End products:
Non-hazardous solidified salt material
Clean water vapor emissions |
 September
2012 National Fuel Gas Company
51
Comparable GAAP Financial Measure Slides and Reconciliations
This presentation contains certain non-GAAP financial measures. For pages
that contain non-GAAP financial measures, pages containing the most directly
comparable GAAP financial measures and reconciliations are provided in the
slides that follow.
The Company believes that its non-GAAP financial measures are useful to
investors because they provide an alternative method for assessing the
Company’s operating results in a manner that is focused on the performance
of the Company’s ongoing operations, or on earnings absent the effect of
certain credits and charges, including interest, taxes, and depreciation,
depletion and amortization. The Company’s management uses these non-
GAAP financial measures for the same purpose, and for planning and
forecasting purposes. The presentation of non-GAAP financial measures is not
meant to be a substitute for financial measures prepared in accordance with
GAAP. |
Reconciliation of Segment Capital Expenditures to
Consolidated Capital Expenditures
($ Thousands)
| FY 2009 | FY 2010 | FY 2011 | FY 2012 Forecast | FY 2013 Forecast | ||||||||||||||||
| Capital Expenditures from Continuing Operations |
||||||||||||||||||||
| Exploration & Production Capital Expenditures |
$ | 188,290 | $ | 398,174 | $ | 648,815 | $ | 675,000-690,000 | $ | 400,000-500,000 | ||||||||||
| Pipeline & Storage Capital Expenditures - Expansion |
52,504 | 37,894 | 129,206 | $ | 160,000-175,000 | $ | 45,000-65,000 | |||||||||||||
| Utility Capital Expenditures |
56,178 | 57,973 | 58,398 | $ | 55,000-60,000 | $ | 60,000-70,000 | |||||||||||||
| Marketing, Corporate & All Other Capital Expenditures |
9,829 | 7,311 | 17,767 | $ | 90,000-110,000 | $ | 50,000-75,000 | |||||||||||||
|
|
|
|
|
|
|
|
|
|
|
|||||||||||
| Total Capital Expenditures from Continuing Operations |
$ | 306,801 | $ | 501,352 | $ | 854,186 | $ | 980,000-1,035,000 | $ | 555,000-710,000 | ||||||||||
| Capital Expenditures from Discountinued Operations |
||||||||||||||||||||
| All Other Capital Expenditures |
216 | $ | 150 | $ | — | $ | — | $ | — | |||||||||||
|
|
|
|
|
|
|
|
|
|
|
|||||||||||
| Plus (Minus) Accrued Capital Expenditures |
||||||||||||||||||||
| Exploration & Production FY 2011 Accrued Capital Expenditures |
$ | — | $ | — | $ | (63,460 | ) | $ | — | $ | — | |||||||||
| Pipeline & Storage FY 2011 Accrued Capital Expenditures |
— | — | (7,271 | ) | — | — | ||||||||||||||
| All Other FY 2011 Accrued Capital Expenditures |
— | — | (1,389 | ) | — | — | ||||||||||||||
| Exploration & Production FY 2010 Accrued Capital Expenditures |
— | (55,546 | ) | 55,546 | — | — | ||||||||||||||
| Exploration & Production FY 2009 Accrued Capital Expenditures |
(9,093 | ) | 9,093 | — | — | — | ||||||||||||||
| Pipeline & Storage FY 2008 Accrued Capital Expenditures |
16,768 | — | — | — | — | |||||||||||||||
| All Other FY 2009 Accrued Capital Expenditures |
(715 | ) | 715 | — | — | — | ||||||||||||||
|
|
|
|
|
|
|
|
|
|
|
|||||||||||
| Total Accrued Capital Expenditures |
$ | 6,960 | $ | (45,738 | ) | $ | (16,574 | ) | $ | — | $ | — | ||||||||
| Eliminations |
$ | (344 | ) | $ | — | $ | — | $ | — | $ | — | |||||||||
|
|
|
|
|
|
|
|
|
|
|
|||||||||||
| Total Capital Expenditures per Statement of Cash Flows |
$ | 313,633 | $ | 455,764 | $ | 837,612 | $ | 980,000-1,035,000 | $ | 555,000-710,000 | ||||||||||
|
|
|
|
|
|
|
|
|
|
|
|||||||||||
Reconciliation of Exploration & Production West Division EBITDA to
Exploration & Production Segment Net Income
($ Thousands)
| 9 Months Ended June 30, 2012 |
||||
| Exploration & Production - West Division EBITDA |
$ | 174,568 | ||
| Exploration & Production - All Other Divisions EBITDA |
111,944 | |||
|
|
|
|||
| Total Exploration & Production EBITDA |
$ | 286,512 | ||
| Minus: Exploration & Production Net Interest Expense |
(19,794 | ) | ||
| Minus: Exploration & Production Income Tax Expense |
(56,034 | ) | ||
| Minus: Exploration & Production Depreciation, Depletion & Amortization |
(136,262 | ) | ||
|
|
|
|||
| Exploration & Production Net Income |
$ | 74,422 | ||
| Exploration & Production Net Income |
$ | 74,422 | ||
| Exploration & Production - West Division Production (MBoe) |
2,581 | |||
|
|
|
|||
| Exploration & Production - Net Income per West Division Production (Boe) |
$ | 28.83 | ||
| Exploration & Production - West Division EBITDA |
$ | 174,568 | ||
| Exploration & Production - West Division Production (MBoe) |
2,581 | |||
|
|
|
|||
| Exploration & Production - West Division EBITDA per West Division Production (Boe) |
$ | 67.64 | ||
Reconciliation of EBITDA to Net Income
($ Thousands)
| FY 2008 | FY 2009 | FY 2010 | FY 2011 | 12 Months Ended June 30, 2012 |
||||||||||||||||
| Exploration & Production - West Division EBITDA |
$ | 188,008 | $ | 170,611 | $ | 187,838 | $ | 187,603 | $ | 223,155 | ||||||||||
| Exploration & Production - All Other Divisions EBITDA |
174,216 | 109,100 | 139,624 | 189,854 | 156,138 | |||||||||||||||
|
|
|
|
|
|
|
|
|
|
|
|||||||||||
| Total Exploration & Production EBITDA |
$ | 362,224 | $ | 279,711 | $ | 327,462 | $ | 377,457 | $ | 379,293 | ||||||||||
| Exploration & Production EBITDA |
$ | 362,224 | $ | 279,711 | $ | 327,462 | $ | 377,457 | $ | 379,293 | ||||||||||
| Utility EBITDA |
161,575 | 164,443 | 167,328 | 168,540 | 155,530 | |||||||||||||||
| Pipeline & Storage EBITDA |
129,171 | 130,857 | 120,858 | 111,474 | 128,372 | |||||||||||||||
| Energy Marketing EBITDA |
8,699 | 11,589 | 13,573 | 13,178 | 6,107 | |||||||||||||||
| Corporate & All Other EBITDA |
(8,156 | ) | (5,575 | ) | 2,429 | (2,960 | ) | 2,508 | ||||||||||||
|
|
|
|
|
|
|
|
|
|
|
|||||||||||
| Total EBITDA |
$ | 653,513 | $ | 581,025 | $ | 631,650 | $ | 667,689 | $ | 671,810 | ||||||||||
| Total EBITDA |
$ | 653,513 | $ | 581,025 | $ | 631,650 | $ | 667,689 | $ | 671,810 | ||||||||||
| Minus: Net Interest Expense |
(62,555 | ) | (81,013 | ) | (90,217 | ) | (75,205 | ) | (78,234 | ) | ||||||||||
| Plus: Other Income |
7,164 | 8,200 | 3,638 | 6,706 | 5,954 | |||||||||||||||
| Minus: Income Tax Expense |
(167,672 | ) | (52,859 | ) | (137,227 | ) | (164,381 | ) | (135,003 | ) | ||||||||||
| Minus: Depreciation, Depletion & Amortization |
(169,846 | ) | (170,620 | ) | (191,199 | ) | (226,527 | ) | (255,835 | ) | ||||||||||
| Minus: Exploration & Production Impairment |
(182,811 | ) | — | |||||||||||||||||
| Plus/Minus: Income/(Loss) from Discontinued Operations, Net of Tax |
1,821 | (2,776 | ) | 6,780 | — | — | ||||||||||||||
| Plus: Gain on Sale of Unconsolidated Subsidiaries |
— | — | — | 50,879 | — | |||||||||||||||
| Plus/Minus: Income/(Loss) from Unconsolidated Subsidiaries |
6,303 | 3,366 | 2,488 | (759 | ) | (61 | ) | |||||||||||||
| Minus: Impairment of Investment in Partnership |
— | (1,804 | ) | — | ||||||||||||||||
|
|
|
|
|
|
|
|
|
|
|
|||||||||||
| Net Income |
$ | 268,728 | $ | 100,708 | $ | 225,913 | $ | 258,402 | $ | 208,631 | ||||||||||