Attached files
| file | filename |
|---|---|
| 8-K - 8-K - Oak Valley Bancorp | a12-19492_18k.htm |
Exhibit 99.1
|
|
[LOGO] |
|
|
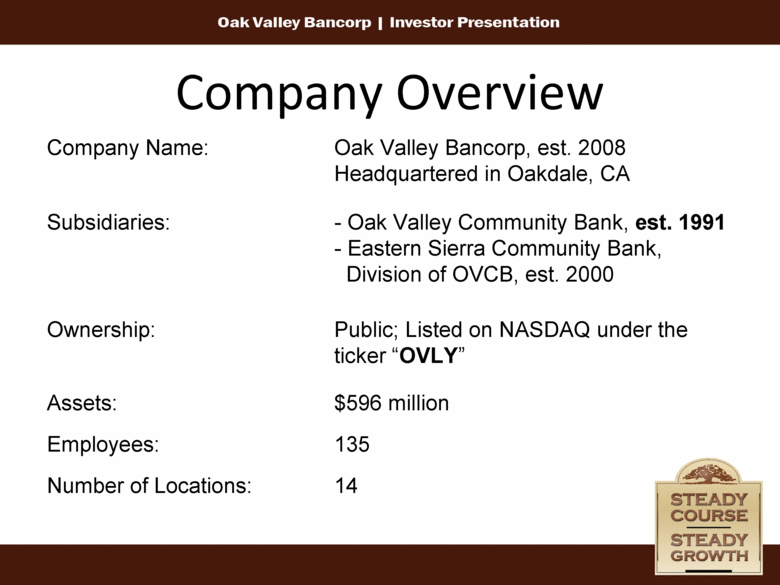
Company Overview Company Name: Oak Valley Bancorp, est. 2008 Headquartered in Oakdale, CA Subsidiaries: - Oak Valley Community Bank, est. 1991 - Eastern Sierra Community Bank, Division of OVCB, est. 2000 Ownership: Public; Listed on NASDAQ under the ticker “OVLY” Assets: $596 million Employees: 135 Number of Locations: 14 |
|
|
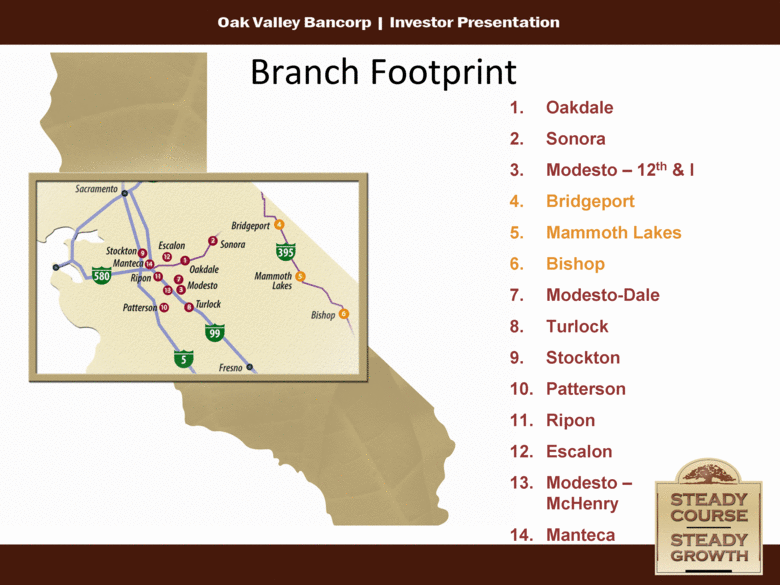
Branch Footprint Oakdale Sonora Modesto – 12th & I Bridgeport Mammoth Lakes Bishop Modesto-Dale Turlock Stockton Patterson Ripon Escalon Modesto – McHenry Manteca 1. 2. 3. 4. 5. 6. 7. 8. 9. 10. 11. 12. 13. 14. |
|
|
Central Valley Economy Strength Highly Diversified Agricultural Based Economy Dairy, Grapes, Almonds, Walnuts, Tomatoes, Peaches, Apples, Cherries, Cattle, Chickens, Turkeys and others Indirect Agriculture Packing, Shipping, Processing, Irrigation, Pesticides and a myriad of specialties Multiplier Effect: Every $1 of agricultural income generates $3 - $4 of indirect revenue Weakness High Foreclosure Volume High Unemployment Low Median Income |
|
|
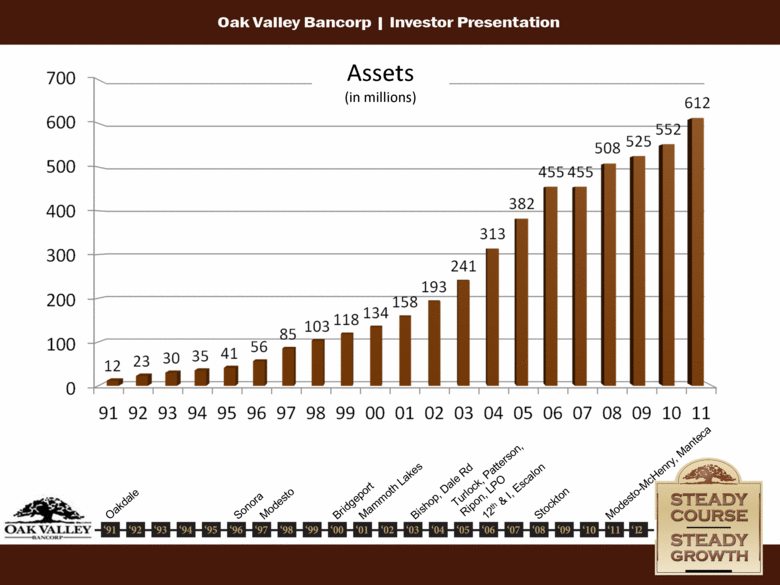
Stockton 12th & I, Escalon Sonora Oakdale Modesto Bridgeport Mammoth Lakes Bishop, Dale Rd Turlock, Patterson, Ripon, LPO Modesto-McHenry, Manteca Assets (in millions) |
|
|
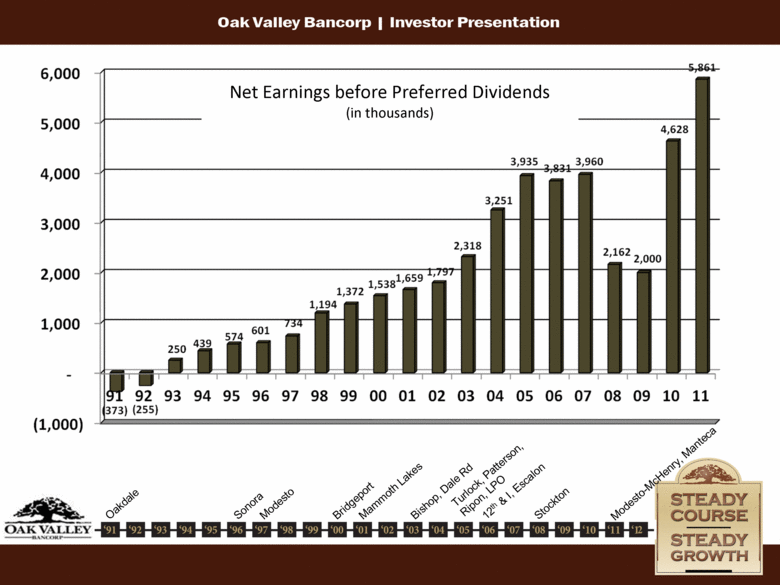
Net Earnings before Preferred Dividends (in thousands) Stockton 12th & I, Escalon Sonora Oakdale Modesto Bridgeport Mammoth Lakes Bishop, Dale Rd Turlock, Patterson, Ripon, LPO Modesto-McHenry, Manteca |
|
|
[LOGO] |
|
|
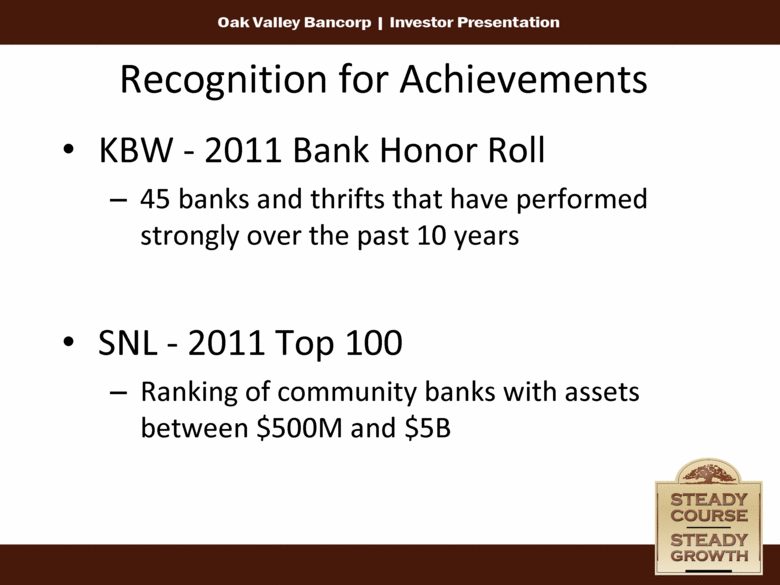
Recognition for Achievements KBW - 2011 Bank Honor Roll 45 banks and thrifts that have performed strongly over the past 10 years SNL - 2011 Top 100 Ranking of community banks with assets between $500M and $5B |
|
|
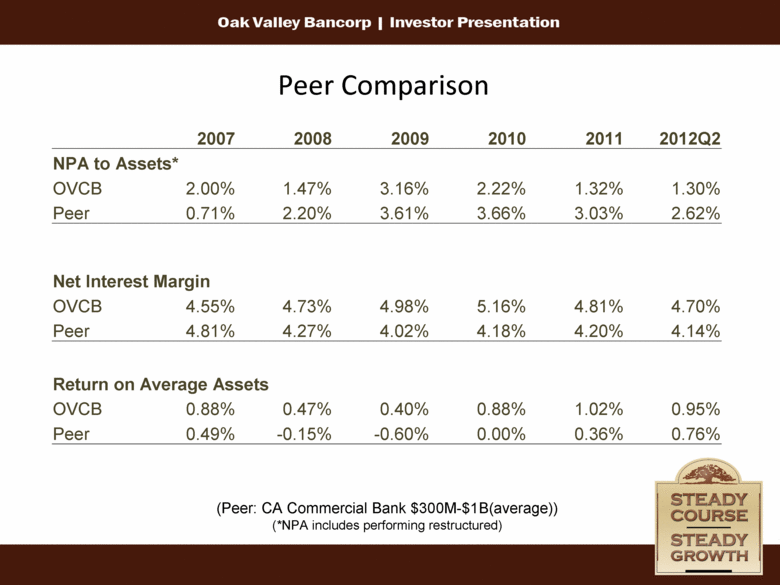
Peer Comparison 2007 2008 2009 2010 2011 2012Q2 NPA to Assets* OVCB 2.00% 1.47% 3.16% 2.22% 1.32% 1.30% Peer 0.71% 2.20% 3.61% 3.66% 3.03% 2.62% Net Interest Margin OVCB 4.55% 4.73% 4.98% 5.16% 4.81% 4.70% Peer 4.81% 4.27% 4.02% 4.18% 4.20% 4.14% Return on Average Assets OVCB 0.88% 0.47% 0.40% 0.88% 1.02% 0.95% Peer 0.49% -0.15% -0.60% 0.00% 0.36% 0.76% (Peer: CA Commercial Bank $300M-$1B(average)) (*NPA includes performing restructured) |
|
|
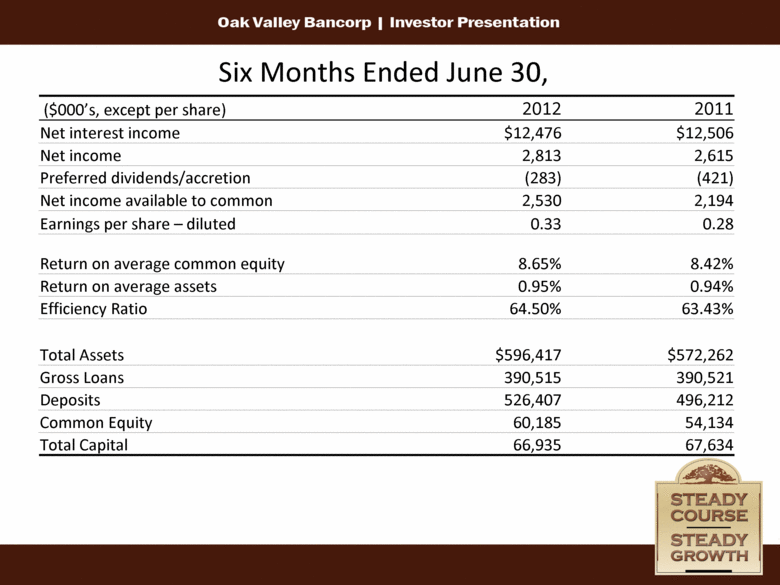
Six Months Ended June 30, ($000’s, except per share) 2012 2011 Net interest income $12,476 $12,506 Net income 2,813 2,615 Preferred dividends/accretion (283) (421) Net income available to common 2,530 2,194 Earnings per share – diluted 0.33 0.28 Return on average common equity 8.65% 8.42% Return on average assets 0.95% 0.94% Efficiency Ratio 64.50% 63.43% Total Assets $596,417 $572,262 Gross Loans 390,515 390,521 Deposits 526,407 496,212 Common Equity 60,185 54,134 Total Capital 66,935 67,634 |
|
|
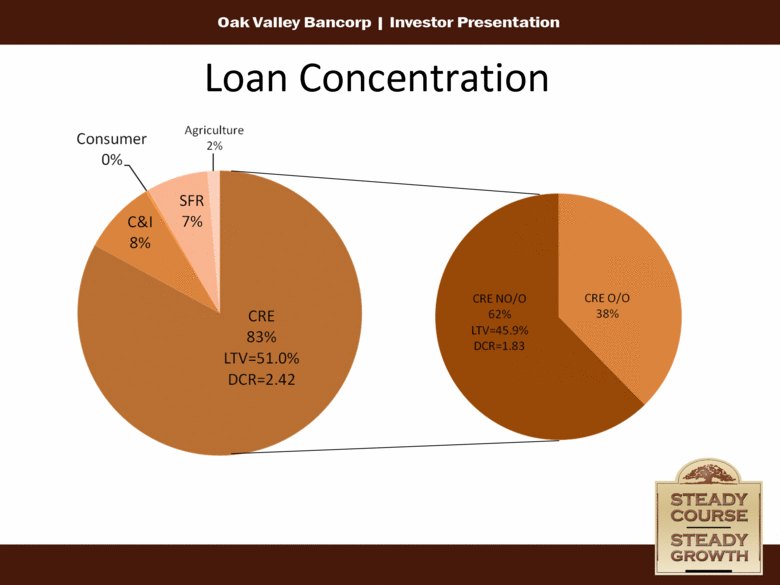
Loan Concentration |
|
|
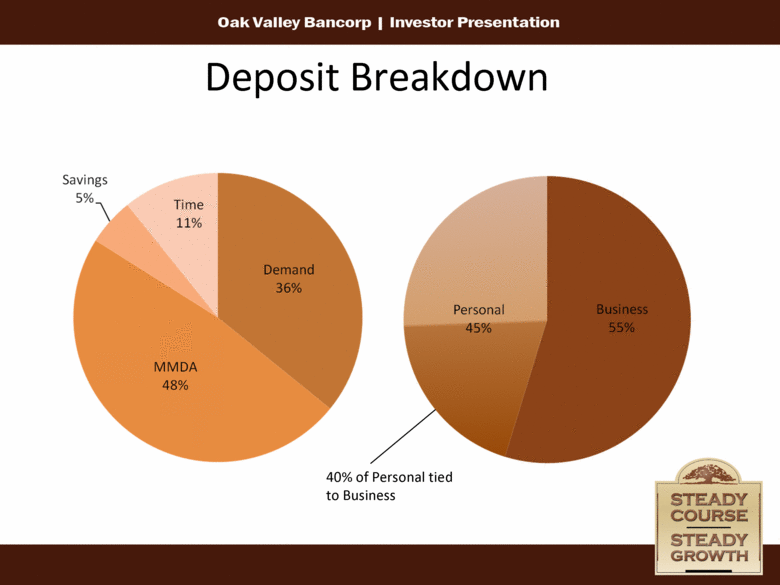
Deposit Breakdown 40% of Personal tied to Business |
|
|
Strategic Direction Relationship Banking High Level of Customer Contact Low-Cost Core Deposits Strong Risk Management Strategic Opportunity |
|
|
[LOGO] |

