Attached files
| file | filename |
|---|---|
| 8-K - FORM 8-K - Approach Resources Inc | d403149d8k.htm |
 INVESTOR
PRESENTATION
AUGUST / SEPTEMBER 2012
Exhibit 99.1 |
 Forward Looking-Statements
2
Cautionary Statements Regarding Oil & Gas Quantities
This presentation contains forward-looking statements within the meaning of Section 27A of the
Securities Act of 1933 and Section 21E of the Securities Exchange Act of 1934. All statements, other
than statements of historical facts, included in this presentation that address activities, events or
developments that the Company expects, believes or anticipates will or may occur in the future are
forward-looking statements. Without limiting the generality of the foregoing, forward-looking
statements contained in this presentation specifically include the expectations of management regarding
plans, strategies, objectives, anticipated financial and operating results of the Company, including as
to the Company’s Wolffork shale resource play, estimated resource potential and recoverability
of the oil and gas, estimated reserves and drilling locations, capital expenditures, typical well
results, and well profiles, type curve, and production and operating expenses guidance included in the
presentation. These statements are based on certain assumptions made by the Company based on
management's experience and technical analyses, current conditions, anticipated future
developments and other factors believed to be appropriate and believed to be reasonable by management.
When used in this presentation, the words “will,” “potential,” “believe,” “intend,” “expect,”
“may,” “should,” “anticipate,” “could,” “estimate,”
“plan,” “predict,” “project,” “target,” “profile,” “model” or their negatives, other similar expressions or the statements that include those words, are
intended to identify forward-looking statements, although not all forward-looking statements
contain such identifying words. Such statements are subject to a number of assumptions, risks and
uncertainties, many of which are beyond the control of the Company, which may cause actual results to
differ materially from those implied or expressed by the forward-looking statements. In
particular, careful consideration should be given to the cautionary statements and risk factors
described in the Company's most recent Annual Report on Form 10-K and Quarterly Report on
Form 10-Q. Any forward-looking statement speaks only as of the date on which such
statement is made and the Company undertakes no obligation to correct or update any forward-looking
statement, whether as a result of new information, future events or otherwise, except as required by
applicable law. The Securities and Exchange Commission (“SEC”) permits oil and gas companies, in their
filings with the SEC, to disclose only proved, probable and possible reserves that meet the SEC’s
definitions for such terms, and price and cost sensitivities for such reserves, and prohibits
disclosure of resources that do not constitute such reserves. The Company uses the terms “estimated
ultimate recovery” or “EUR,” reserve or resource “potential,” and other
descriptions of volumes of reserves potentially recoverable through additional drilling or recovery techniques that the SEC’s
rules may prohibit the Company from including in filings with the SEC. These estimates are by their
nature more speculative than estimates of proved, probable and possible reserves and accordingly
are subject to substantially greater risk of being actually realized by the Company.
EUR estimates, potential drilling locations and resource potential estimates have not been risked by
the Company. Actual locations drilled and quantities that may be ultimately recovered from the
Company’s interest may differ substantially from the Company’s estimates. There is no
commitment by the Company to drill all of the drilling locations that have been attributed these quantities.
Factors affecting ultimate recovery include the scope of the Company’s ongoing drilling program,
which will be directly affected by the availability of capital, drilling and production costs, availability of
drilling and completion services and equipment, drilling results, lease expirations, regulatory
approval and actual drilling results, as well as geological and mechanical factors Estimates of unproved
reserves, type/decline curves, per well EUR and resource potential may change significantly as
development of the Company’s oil and gas assets provides additional data.
Type/decline curves, estimated EURs, resource potential, recovery factors and well costs represent
Company estimates based on evaluation of petrophysical analysis, core data and well logs, well
performance from limited drilling and recompletion results and seismic data, and have not been
reviewed by independent engineers. These are presented as hypothetical recoveries if assumptions
and estimates regarding recoverable hydrocarbons, recovery factors and costs prove correct. The Company
has very limited production experience with these projects, and accordingly, such estimates may
change significantly as results from more wells are evaluated. Estimates of resource potential and EURs do not constitute reserves, but constitute estimates of contingent resources
which the SEC has determined are too speculative to include in SEC filings. Unless otherwise noted, IRR
estimates assume NYMEX forward-curve oil and gas pricing and Company-generated EUR and
decline curve estimates based on Company drilling and completion cost estimates that do not include land, seismic or G&A costs.
|
 Notes: Proved reserves and acreage as of 6/30/2012. All Boe and Mcfe calculations
are based on a 6 to 1 conversion ratio. Enterprise value is equal to market
capitalization
using
the
closing
share
price
of
$27.73
per
share
on
8/23/2012,
plus
net
debt
as
of
6/30/2012.
Company Overview
•
Enterprise value $1.1 BN
•
High quality reserve base
83.7 MMBoe proved reserves, 37% PD
99% Permian Basin
•
Permian core operating area
166,000 gross (146,000 net) acres
500+ MMBoe gross, unrisked resource
potential
2,900+ drilling and recompletion opportunities
•
Oil-driven, high margin production
2Q’12 Production 7.7 MBoe/d, 65% oil & NGLs
2Q’12 Revenue mix 64% oil, 25% NGLs and
11% natural gas
3
AREX OVERVIEW
ASSET OVERVIEW |
 AREX
2Q’12 Highlights 4
•
Oil
growth
key
contributor
to
total
production
growth
•
Production totaled 7.7 MBoe/d, up 16% and 7% over 2Q’11 and 1Q’12,
respectively •
Oil growth up 120% over 2Q’11 and 20% over 1Q’12
•
Oil
growth
key
contributor
to
total
reserves
growth
at
MY’12
•
Estimated proved reserves total 83.7 MMBoe, up 9% and 25% over YE’11 and
MY’11 proved reserves, respectively
•
Oil proved reserves total 23.5 MMBbls, increasing 30% and 132% over YE’11 and
MY’11 proved reserves, respectively
•
Horizontal Wolfcamp delivering strong results
•
Strong
well
performance
from
horizontal
Wolfcamp
“B”
in
Project
Pangea
•
Encouraging
well
performance
from
horizontal
Wolfcamp
“A”
pilot
wells
in
Pangea
West |
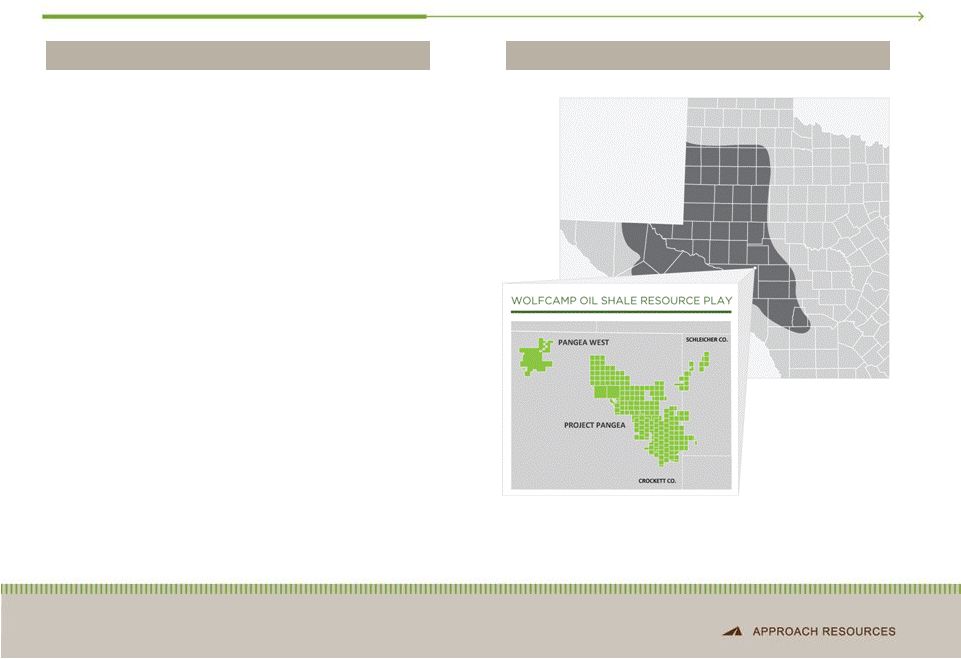
 Quarterly Liquids Production
5
2Q’12 LIQUIDS PRODUCTION
•
2Q’12 Liquids production up 33% over 2Q’11
65% total production volumes
•
2Q’12 Oil production up 120% over 2Q’11
28% total production volumes |
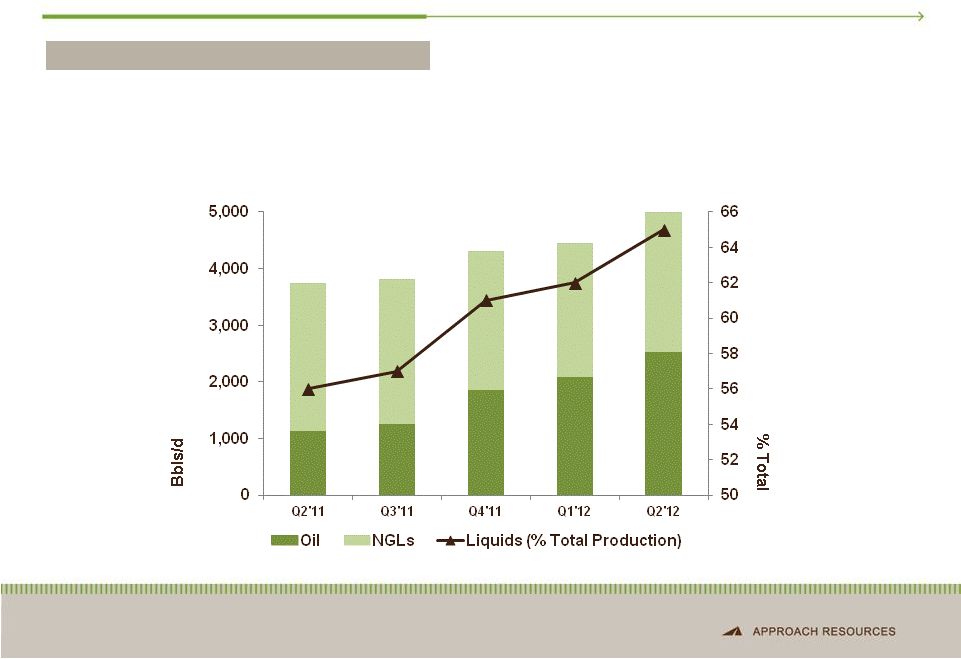
 Track
Record of Reserve and Production Growth •
MY’12 reserves up 25% YoY and 9% over YE’12
Oil reserves up 33% to 23.5 MMbbls
•
Wolfcamp Shale key contributor to reserve growth
500+ MMBoe gross, unrisked resource potential
6
RESERVE GROWTH
PRODUCTION GROWTH
•
2011 production increased 50% YoY
•
Targeting 28% production growth in 2012
•
Strong liquids production growth
2012E production 65% liquids
0
10
20
30
40
50
60
70
80
90
2004
2005
2006
2007
2008
2009
2010
2011
MY'12
Natural Gas (MMBoe)
Oil & NGLs (MMbbls)
0.0
1.0
2.0
3.0
4.0
5.0
6.0
7.0
8.0
2004
2005
2006
2007
2008
2009
2010
2011
MY'12
Natural Gas (MBoe/d)
Oil & NGLs (Mbbls/d) |
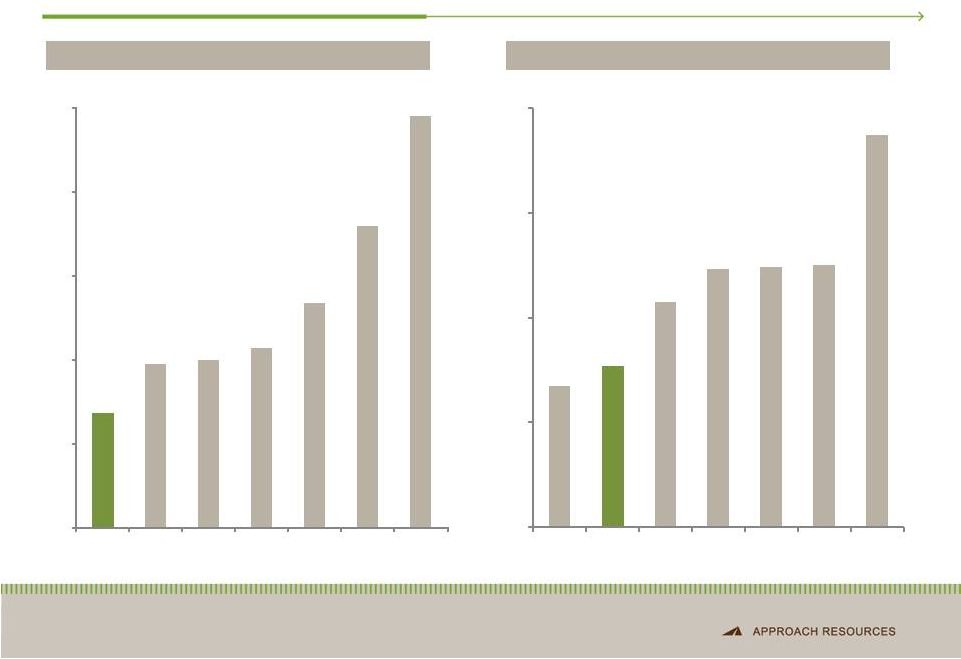 Low-Cost Operator
7
3-YR AVERAGE F&D COSTS ($/BOE)
2Q’12 LIFTING COSTS ($/BOE)
Notes: Oil weighted peers include BRY, CXO, KOG, LPI, NOG, OAS. Data based on SEC
filings and J.S. Herold data. 3-YR F&D costs represent drill-bit F&D
costs (drill-bit F&D costs defined as Exploration and Development Costs
divided by Reserve Extensions & Discoveries and Revisions less Production). Lifting
costs defined as lease operating expense plus taxes other than income and gathering
and transportation expense. $8.20
$11.71
$11.98
$12.84
$16.06
$21.57
$29.40
$0
$6
$12
$18
$24
$30
AREX
Peer 1
Peer 2
Peer 3
Peer 4
Peer 5
Peer 6
$8.04
$9.23
$12.85
$14.73
$14.89
$14.96
$22.43
$0
$6
$12
$18
$24
Peer 1
AREX
Peer 2
Peer 3
Peer 4
Peer 5
Peer 6 |
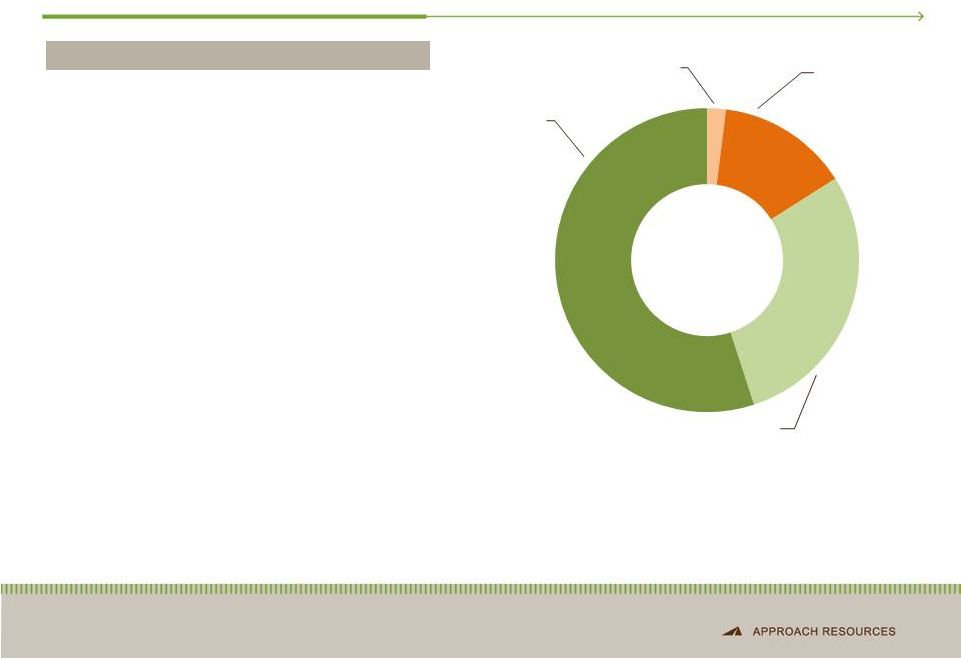 2012
Capital Program 8
•
Horizontal Wolfcamp
2 horizontal rigs
Beginning development program of B zone
Testing A & C zones
•
Vertical Clearfork & Wolfcamp
1 vertical rig and recompletion program
•
Infrastructure & Equipment
Upfront investments to prepare for large-scale field
development
-
Lower drilling and completion costs
-
Transportation for growing crude production
•
Acreage –
Strategic, bolt-on additions
•
Targeting 28% production growth
2012
production
guidance
2.9
MMBoe
–
3.1
MMBoe
2012 PROGRAM OVERVIEW
2012 Capital Program $260 MM
2%
14%
29%
55%
Horizontal
Wolfcamp
Acreage
Infrastructure &
Equipment
Vertical Wolffork &
Recompletions |
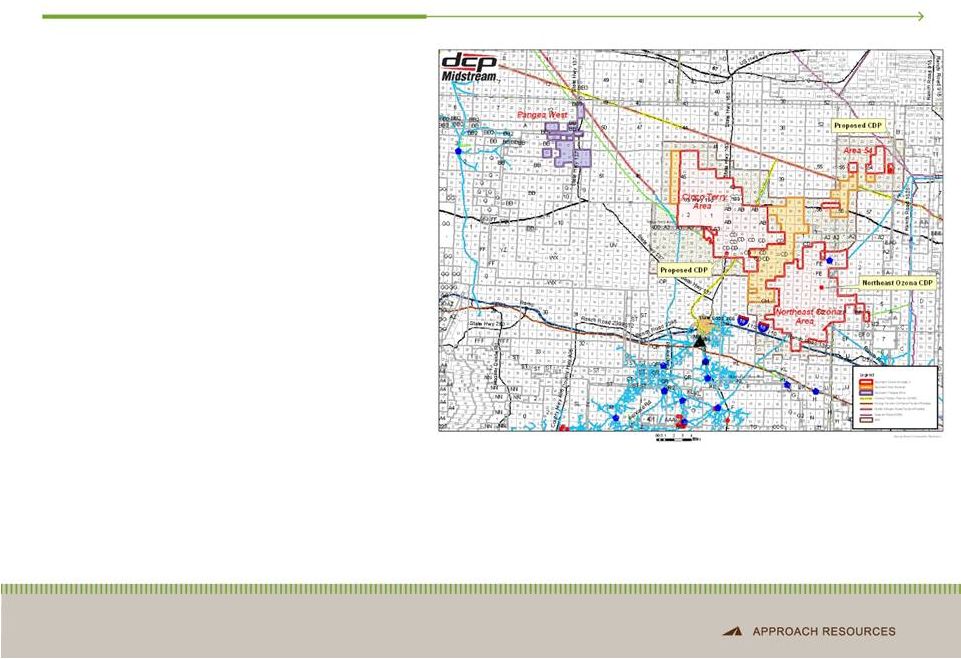 Major
Infrastructure in Place 9
•
Gas Processing –
DCP
•
Gas Processing –
WTG
•
NGL Pipeline
CP Chemical EZ Line to Mont Belvieu
Sand Hills Pipeline will provide new capacity for
NGLs to Mont Belvieu (initial capacity 200
MBbls/d; expected to be operational for
Permian Basin barrels in 3Q’13)
•
Oil Transportation
WTG Benedum Gas Plant (current capacity 110
MMcf/d)
Ozona Gas Plant (current capacity 120 MMcf/d)
SW Ozona Gas Plant (current capacity 100
MMcf/d)
Company owned and third-party oil hauling
trucks |
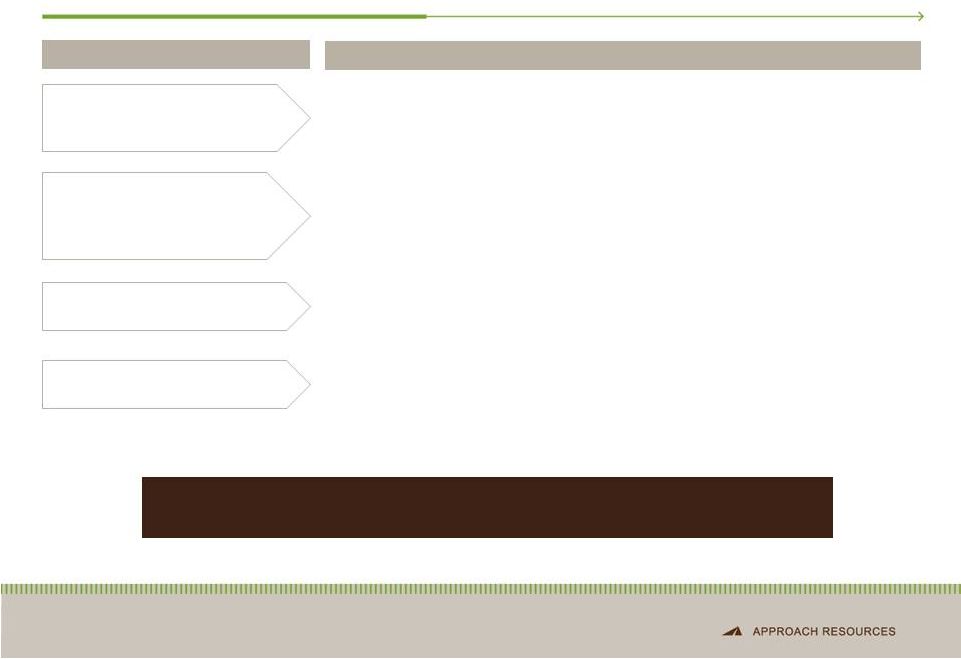 Infrastructure & Equipment Projects
10
•
Safely and securely transport water across Project Pangea and Pangea West
and reduce truck traffic
•
Reduce time and money spent on water hauling and disposal
•
Replace rental equipment and contractors with Company-owned and operated
equipment and personnel
•
Reduce money spent on flowback operations
•
Facilitate large-scale field development
•
Reduce fresh water use
•
Reduce water costs
•
Efficiently transport crude oil to market and reduce inventory
•
Reduce oil differential
Purchasing and installing water
transfer equipment
Drilling and/or converting SWD
wells
Purchasing and installing flowback
equipment
Securing water supply
Testing non-potable water and
recycling flowback water
Installing crude takeaway lines
Purchased oil hauling trucks
PROJECTS
BENEFITS
Infrastructure and equipment projects are key to large-scale field
development and to reducing D&C costs and
monthly LOE |
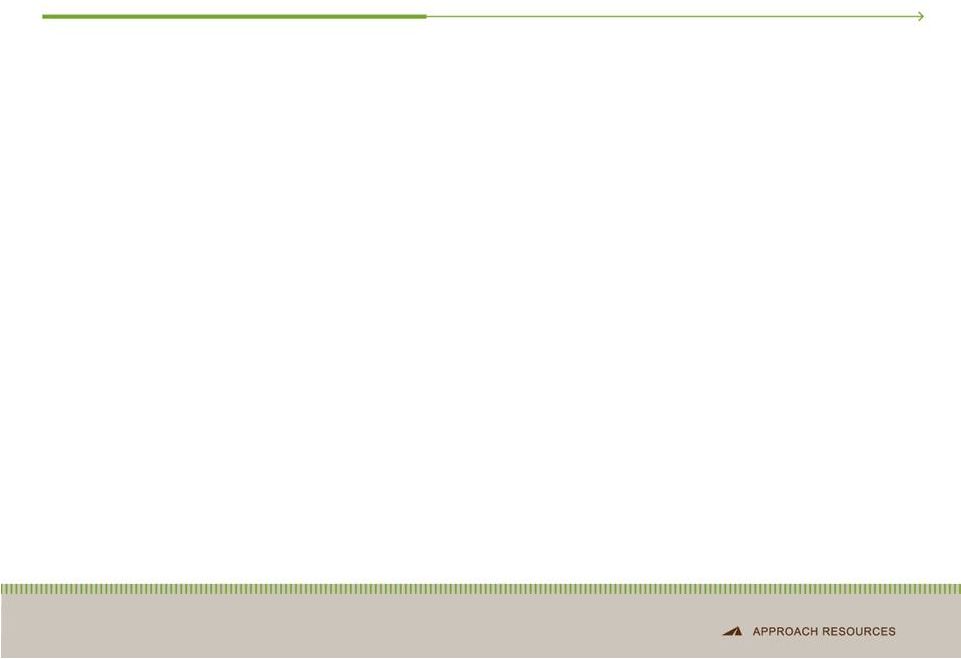
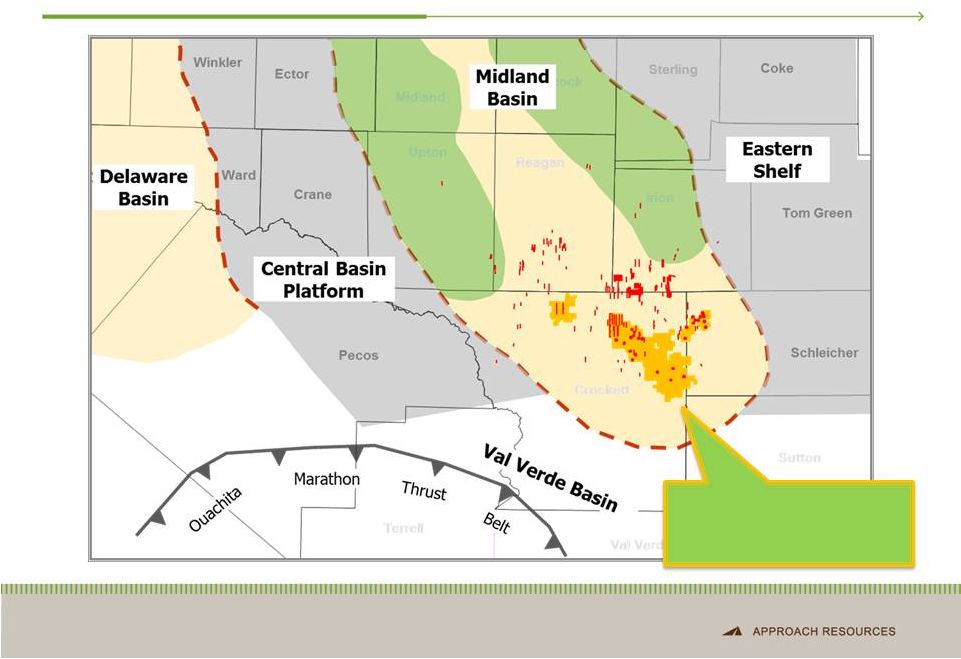 AREX
Wolfcamp Play Favorably Located in the S. Midland Basin 11
Wolfcamp / Wolffork Oil
Shale Resource Play |
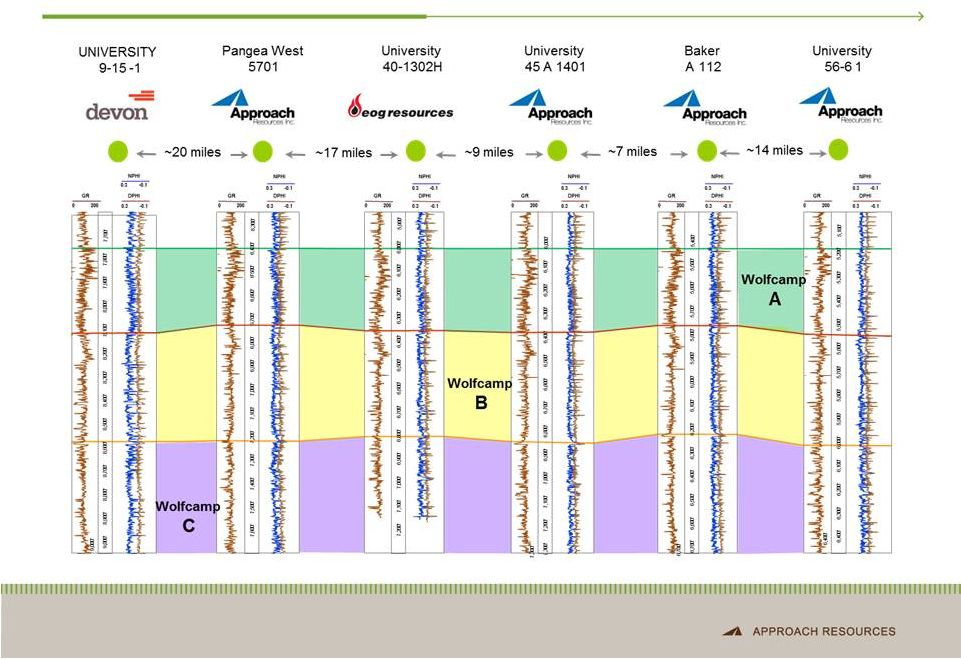 12
Wolfcamp Oil Shale Play –
Widespread, Thick, Consistent & Repeatable |
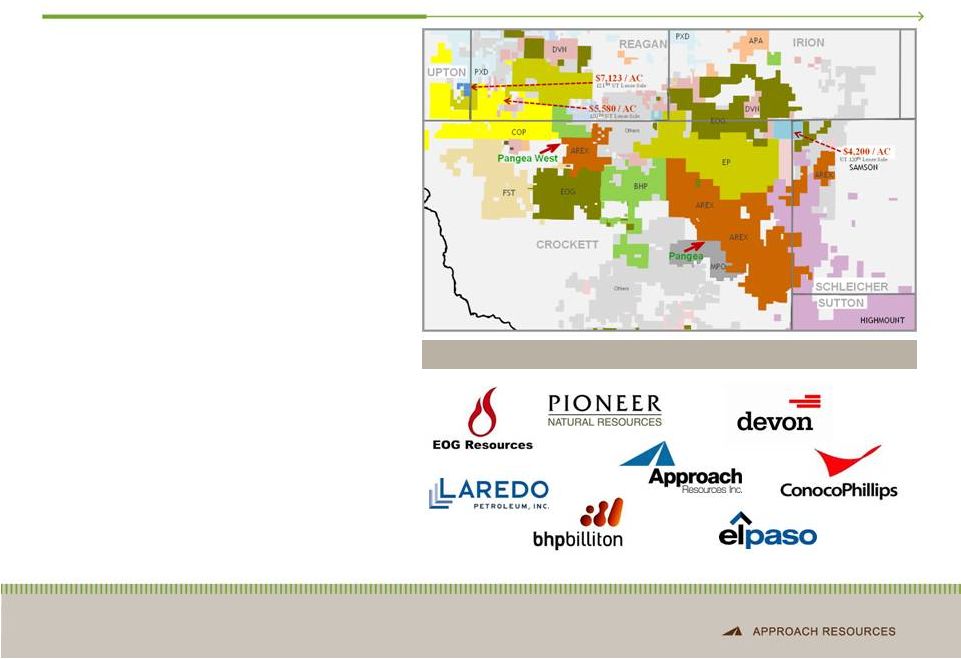 AREX
Wolfcamp Oil Shale Resource Play 13
ACTIVE PARTICIPANTS IN THE PLAY
Large, primarily contiguous acreage position
Liquids-rich, multiple pay zones
166,000 gross (146,000 net) acres
Low acreage cost ~$500 per acre
2,900+ drilling and recompletion opportunities
Transitioning Wolfcamp B to development
Testing multiple horizontal laterals targeting
Testing tighter well spacing
Preparing field for large-scale development
Broad industry participation de-risking play
41 Horizontal Wolfcamp rigs as of July 2012
Average peak IP rate of 807 Boe/d in 2Q’12
Average lateral well length of ~7,100 ft.
500+ MMBoe gross, unrisked resource
500+ MMBoe gross, unrisked resource
potential
Early-stage development
mode
the Wolfcamp A and C
Note: Number of Horizontal Wolfcamp rigs per PXD July 2012 investor presentation. Average peak IP
rate and average lateral well length based on public disclosure from AREX, EOG, PXD. |
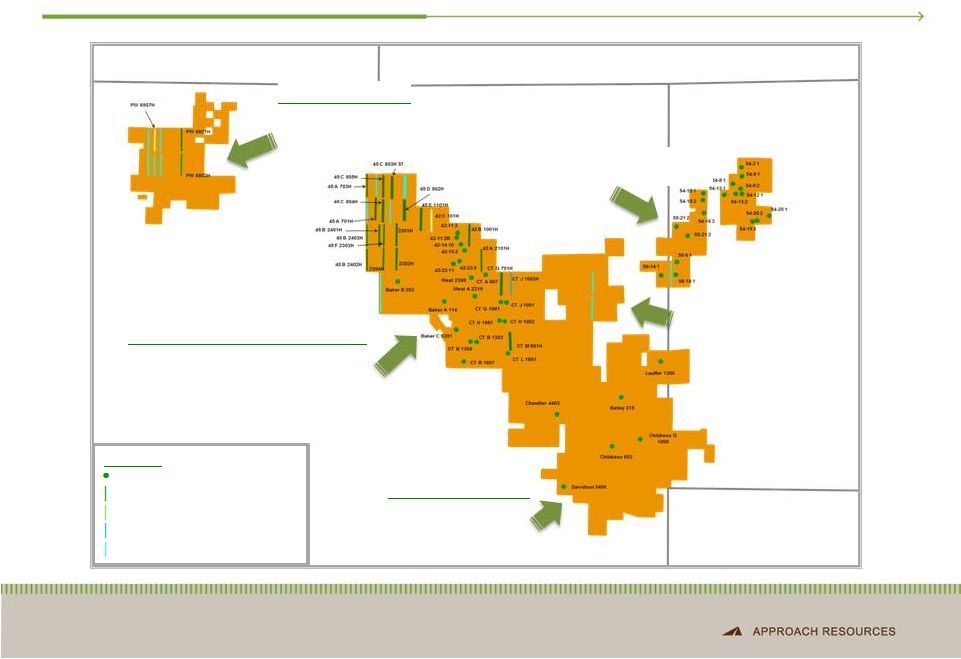 AREX
Wolfcamp Play – Activity Map
14
Pangea West
North & Central Pangea
South Pangea
•
18,000 gross acres
•
2 horizontal pilot wells with encouraging
results
Schleicher
Crockett
Irion
Reagan
•
3D Seismic planning underway
•
Targeting horizontal pilot well in
4Q’12
•
Interpreting newly acquired
3D seismic
•
Targeting horizontal pilot
well in 4Q’12
•
59,000 gross acres
•
Continuing
completion design
improvement
•
89,000 gross acres
•
Continuing horizontal and vertical
development
•
Continuing refining completion designs
Sutton
Legend
Vertical Producer
HZ Producer
HZ –
Waiting on Completion
HZ –
Drilling
HZ –
Permit |
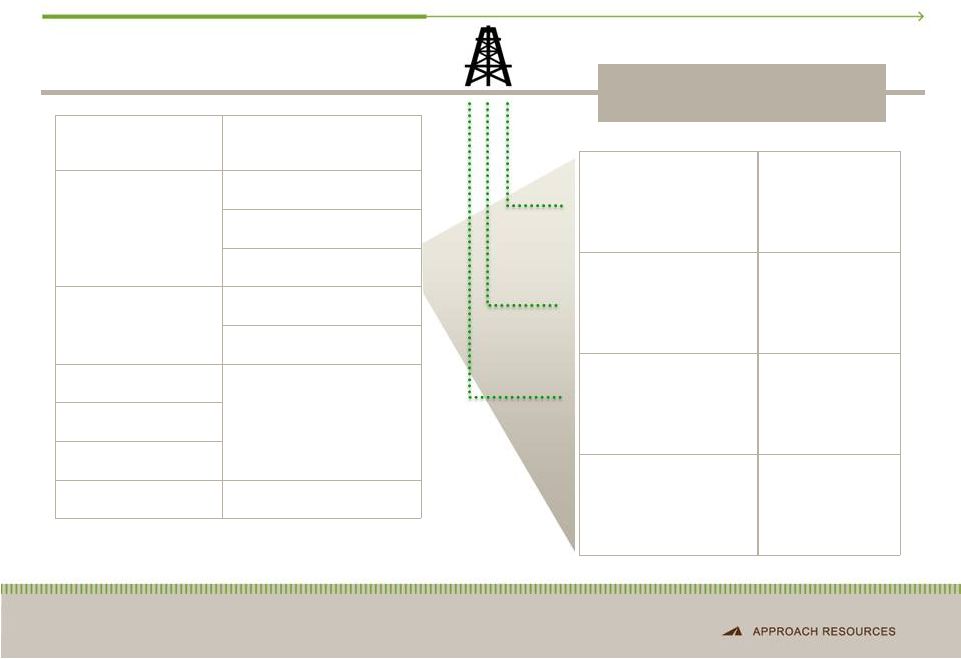
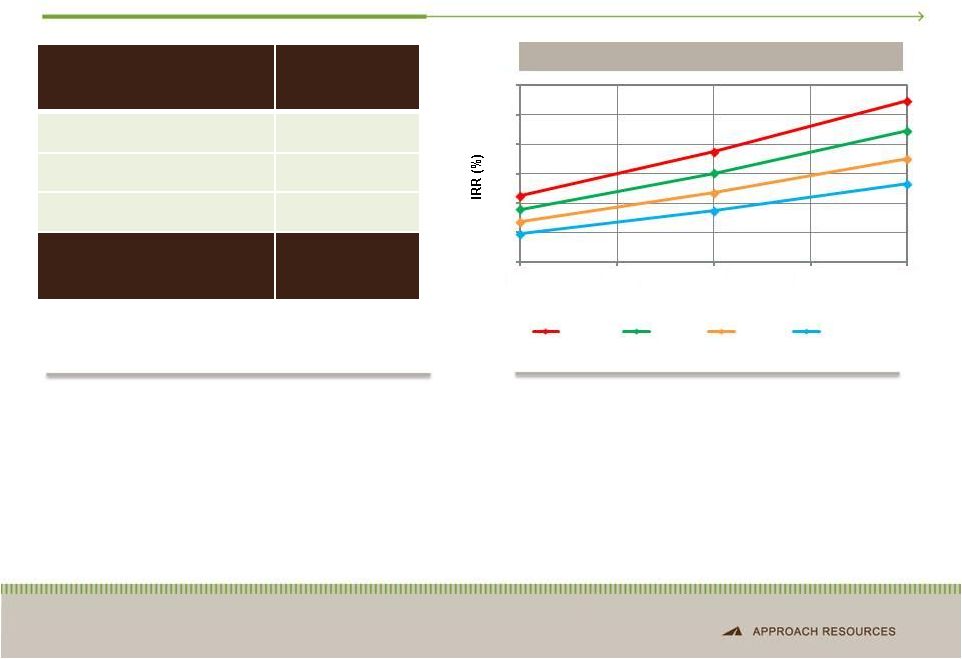 Horizontal Wolfcamp Economics
15
BTAX IRR SENSITIVITIES
•
Horizontal drilling improves recoveries and
returns
•
Multiple, stacked horizontal targets
•
7,000’+ lateral length
•
~80% of EUR made up of oil and NGLs
•
2 horizontal rigs running in Project Pangea /
Pangea West
•
Improving IPs and liquids ratio driving higher
returns
•
Recent well results range from 634 BOEPD to
1,310 BOEPD, made up of 84% to 97% liquids
•
875 BOEPD initial IP for Univ. 45 A 703H, made up of
85% oil and 93% total liquids
•
612 BOEPD and 539 BOEPD average 30-day and
60-day rates, respectively, for Univ. 45 A 703H
Notes: Potential locations based on 1,000-feet spacing between each horizontal
well. Economics assume NYMEX gas strip 2/2012 and NGL price based on 50% WTI
oil price. 0
10
20
30
40
50
60
350
400
450
500
550
Well EUR (MBoe)
$100 / bbl
$90 / bbl
$80 / bbl
$70 / bbl
Play Type
Horizontal
Wolfcamp
Avg. EUR
450 MBoe
Targeted Well Cost
$5.5 MM
Potential Locations
500
Gross Resource
Potential
225 MMBoe |
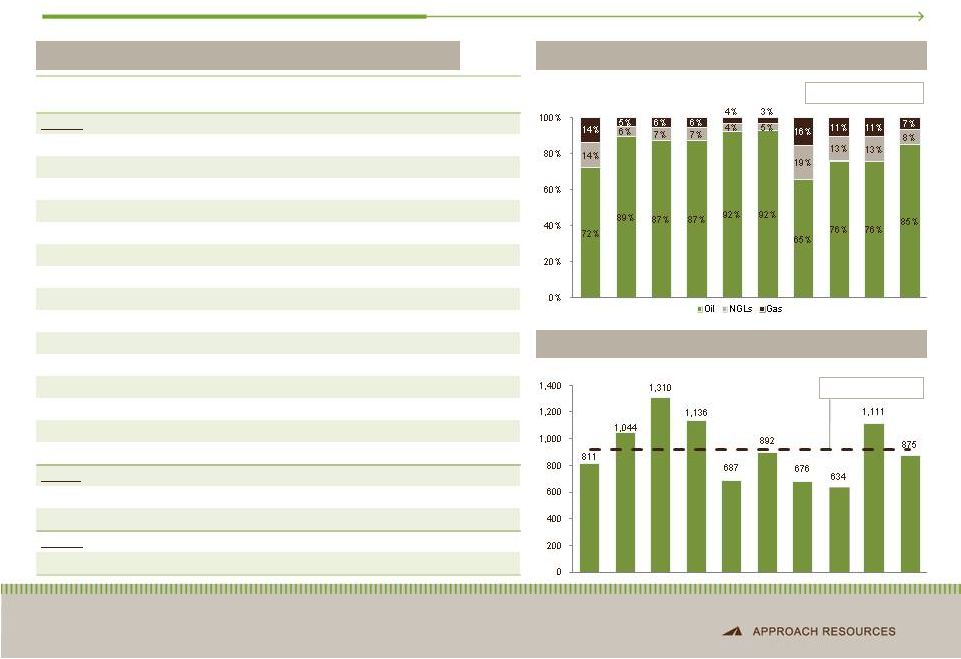 Recent Well Results
16
Note: IP mix based on 24 hr.-IP rates.
IP
MIX
–
LAST
10
HZ
B
WELLS
24 HR.-
IP –
LAST 10 HZ B WELLS
Completion
date
Well name
IP
(Boe/d)
Oil
(Bbl/d)
NGL
(Bbl/d)
Gas
(Mcfe/d)
IP %
Liquids
No. of
stages
Lateral
length
(ft.)
B Bench:
May 2012
University 45 A #703H
875
743
73
354
93%
29
7,672
Mar 2012
University 45 F #2304H
1,111
840
150
729
89%
28
7,641
Mar 2012
University 45 F #2303H
634
481
84
412
89%
30
7,999
Feb 2012
University 45 C #805H
676
441
130
632
84%
28
7,849
Feb 2012
University 45 C #804H
892
823
38
185
97%
35
7,811
Dec 2011
University 45 E #1101H
687
632
30
147
96%
35
7,712
Dec 2011
University 45 F #2302H
1,136
986
83
404
94%
28
7,698
Dec 2011
University 45 F #2301H
1,310
1,136
96
467
94%
34
7,749
Sep 2011
University 45 C #803H
1,044
931
57
335
95%
23
7,358
Sep 2011
University 45 B #2401H
811
582
116
677
86%
23
7,613
Sep 2011
University 45 D #902H
798
611
95
552
88%
23
7,770
Jun 2011
University 45 A #701H
694
613
41
237
94%
21
6,859
May 2011
CT G #701H
328
168
81
473
76%
23
7,609
Apr 2011
University 42-21 #1H
316
132
93
543
71%
21
7,037
Mar 2011
CT M #901H
171
51
61
355
65%
15
5,377
A Bench:
Jun 2012
Pangea West #6601H
461
388
40
196
93%
29
7,742
Jun 2012
Pangea West #6602H
494
391
57
278
91%
28
7,828
C Bench:
Nov 2011
University 42 B #1001H
541
324
120
584
82%
28
7,769
HZ WOLFCAMP WELL RESULTS
Boe/d
Average: 918 Boe/d
Average: 82% oil |
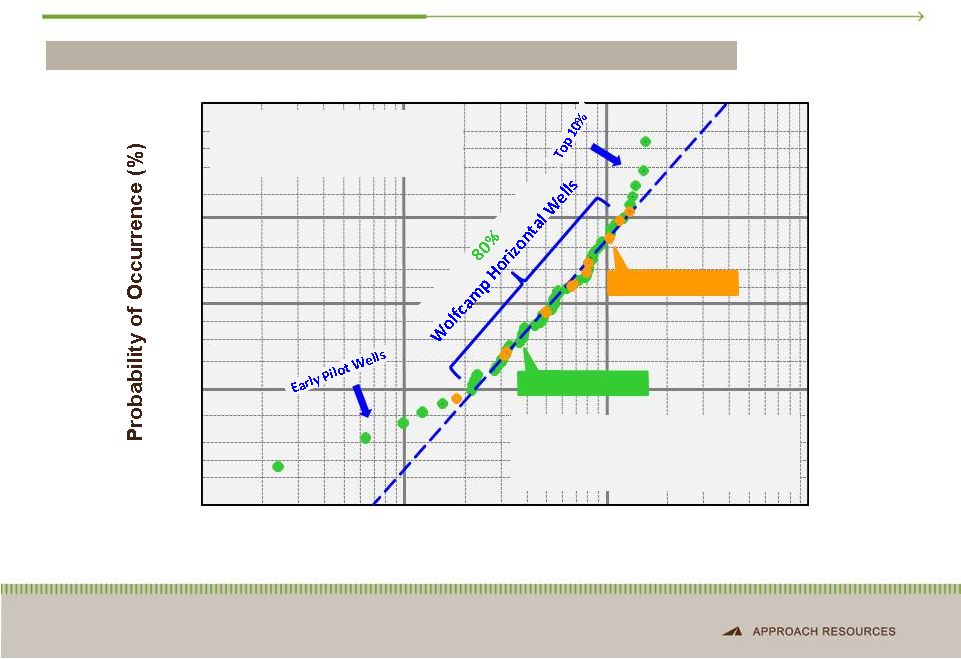 Distribution of IP Rates –
Horizontal Wolfcamp Wells
WOLFCAMP
OIL
SHALE
RESOURCE
PLAY
–
SOUTHERN
MIDLAND
BASIN
17
10%
50%
90%
10.0
100
1,000
10,000
Initial Daily Production Rate (BOEPD)
Industry Wells
AREX Wells
99%
1%
Available Data = 65 HZ Wells
P50 ~ 504 BOEPD
Majority Completed Last 12 Months
Many factors affect IPs, including learning curve, number of frac
stages, fluid type and amount, proppant amount, pumping rate,
lateral landing point and fracture density
Data from public domain and company IR presentations |
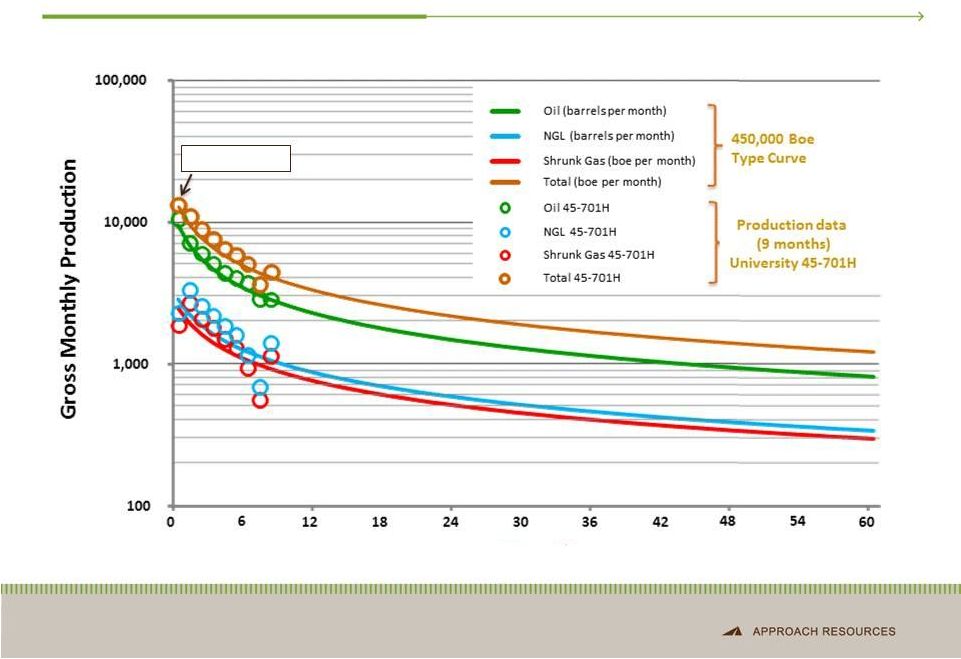 Horizontal Wolfcamp –Type Curve
18
Month
IP 694 BOEPD |
 Horizontal Wolfcamp Targets
19
SYSTEM
STRATIGRAPHIC
UNIT
Permian
Clearfork/Spraberry
Dean
Wolfcamp
Pennsylvanian
Canyon
Strawn
Mississippian
Devonian
Silurian
Ordovician
Ellenburger
WOLFCAMP A
WOLFCAMP B
WOLFCAMP C
WOLFCAMP D
Pilot
Transitioning to
Development
Pilot –
Recent
Results
Encouraging
Under Evaluation
POTENTIAL HORIZONTAL
WOLFCAMP TARGETS |
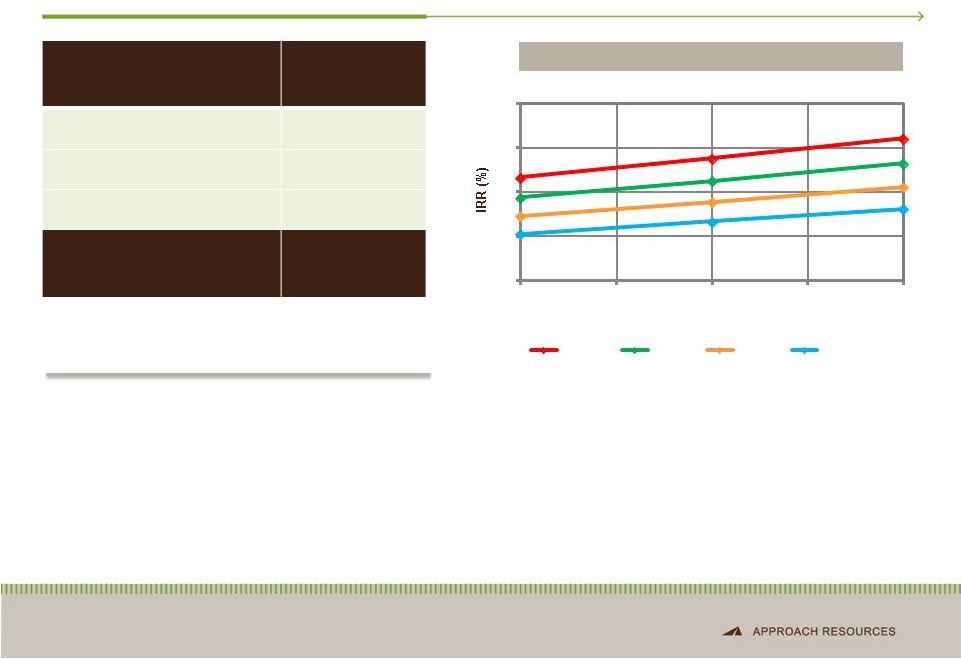 Vertical Clearfork & Wolfcamp (“Wolffork”) Economics
20
BTAX IRR SENSITIVITIES
•
Vertical pilot program in development mode
•
190 BOEPD average IP for 12 recent vertical
Wolffork wells (73% liquids), 5 of which
averaged 300 BOEPD
Notes: Potential locations based on 20-acre spacing. Economics assume
NYMEX gas strip 2/2012 and NGL price based on 50% WTI oil price. 0
10
20
30
40
100
105
110
115
120
Well EUR (MBoe)
$100 / bbl
$90 / bbl
$80 / bbl
$70 / bbl
Play Type
Vertical
Wolffork
Gross Resource
Potential
200+ MMBoe
Avg. EUR
Targeted Well Cost
Potential Locations
110 MBoe
$1.2 MM
1,825 |
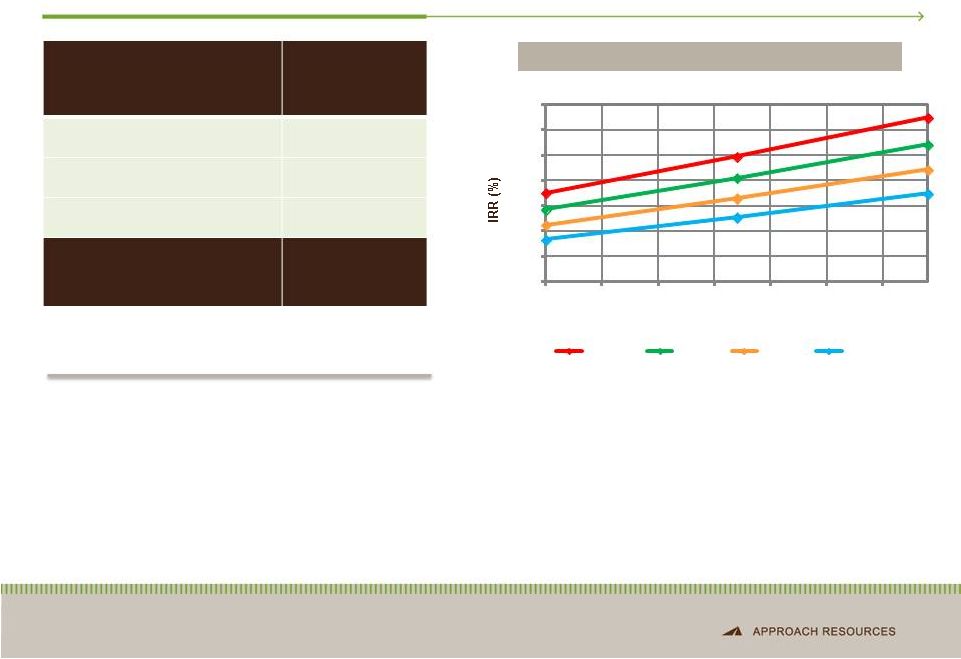 Vertical Wolffork Recompletion Economics
21
BTAX IRR SENSITIVITIES
•
186 BOEPD average IP for 9 recent vertical
Wolffork recompletions (78% liquids)
•
Recent recompletion IPs include 315 and 250
BOEPD IPs from two recompletions,
respectively
Notes: Potential locations based on 20 to 40-acre spacing. Economics
assume NYMEX gas strip 2/2012 and NGL price based on 50% WTI oil price.
0
10
20
30
40
50
60
70
76
81
86
91
96
101
106
Well EUR (MBoe)
$100 / bbl
$90 / bbl
$80 / bbl
$70 / bbl
Play Type
Vertical
Wolffork
Recompletion
Avg. EUR
93 MBoe
Targeted Well Cost
$0.75 MM
Potential Locations
190
Gross Resource
Potential
17+ MMBoe |
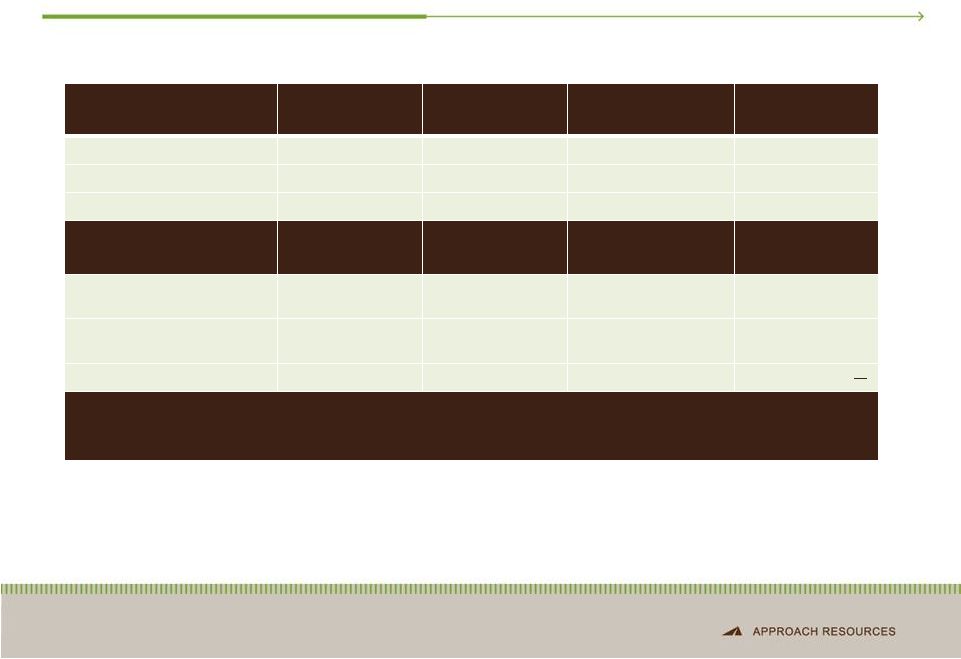 AREX
Drilling Targets & Resource Potential 22
PLAY TYPE
Horizontal
Wolfcamp
Vertical
Wolffork
Vertical Wolffork
Recompletion
Vertical Canyon
Wolffork
EUR (MBoe)
450
110
93
193
Targeted well cost ($MM)
$5.5
$1.2
$0.75
$1.5
Potential locations
500
1,825
190
440
GROSS RESOURCE
POTENTIAL (MMBoe)
225
200+
17+
85
Target
Wolfcamp
Clearfork,
Wolfcamp
Clearfork, Wolfcamp
Canyon, Clearfork,
Wolfcamp
Drilling depth (ft.)
7,000+ (lateral
length)
< 7,500
< 7,500
< 8,500
Activity (# of rigs)
2
1
2 -
4 recompl. / month
500+ MMBoe Total Gross Resource Potential
20+ Years of Drilling Inventory¹
Notes: Potential locations based on 1,000-feet spacing between each horizontal
well for Horizontal Wolfcamp, 20-acre spacing for Vertical Wolffork, 20 to 40-
acre spacing for Vertical Wolffork Recompletion and 40-acre spacing for Vertical
Canyon Wolffork. ¹
Assumes 24 horizontal and 35 vertical wells drilled per year.
|
 Creating Value Through Growth
23
•
Concentrated geographic footprint in the Southern Midland Basin
•
Strong growth track record at competitive costs
•
Detailed technical evaluation led to discovery of significant growth
potential in the Wolfcamp / Wolffork oil shale resource play
•
Rigorous pilot program de-risked ~100,000 gross acres
•
Capital discipline for Wolfcamp / Wolffork program acceleration
|
 Financial
NON-GAAP RECONCILIATIONS
Framework |
 2012
Operating and Financial Guidance 25
2012 GUIDANCE
2012 Guidance
Production
Total (MBoe)
2,900 -
3,100
Percent Oil & NGLs
65%
Operating costs and expenses ($/per Boe)
Lease operating
$
5.50 –
6.50
Severance and production taxes
$
2.50 –
4.00
Exploration
$
4.00 –
5.00
General and administrative
$
7.00 –
8.00
Depletion, depreciation and amortization
$
15.00 –
18.00
Capital expenditures ($MM)
Approximately $260 |
 Hedge Position
26
CURRENT HEDGE POSITION
Commodity and Time Period
Type
Volume
Price
Crude Oil
2012
Collar
700 Bbls/d
$85.00/Bbl -
$97.50/Bbl
2012
Collar
500 Bbls/d
$90.00/Bbl -
$106.10/Bbl
September
2012
–
December
2012
Collar
350 Bbls/d
$90.00/Bbl -
$102.30/Bbl
2013
Collar
650 Bbls/d
$90.00/Bbl -
$105.80/Bbl
2013
Collar
450 Bbls/d
$90.00/Bbl -
$101.45/Bbl
2014
Collar
550 Bbls/d
$90.00/Bbl -
$105.50/Bbl
Natural Gas Liquids
Natural
Gasoline
–
February
2012
–
December
2012
Swap
225 Bbls/d
$95.55/Bbl
Normal
Butane
–
March
2012
–
December
2012
Swap
225 Bbls/d
$73.92/Bbl
Natural Gas
2012
Call
230,000 MMBtu/month
$6.00/MMBtu
July 2012 –
December 2012
Swap
360,000 MMBtu/month
$2.70/MMBtu
•
Recently increased crude oil derivatives positions in 2012 (collar covering 350
Bbls/d) and 2013 (collar covering 450 Bbls/d):
|
 Financial Strength
27
Liquidity
(unaudited)
is
calculated
by
adding
the
net
funds
available
under
our
revolving
credit
facility
and
cash
and
cash
equivalents.
We
use
liquidity as an indicator of the Company’s ability to fund development and
exploration activities. Liquidity has limitations, and can vary from year
to year for the Company and can vary among companies based on what is or is not
included in the measurement on a company’s financial statements.
Liquidity is provided in addition to, and not as an alternative for, and should be read in conjunction with, the information contained in
our financial statements prepared in accordance with GAAP (including the notes),
included in our SEC filings and posted on our website. The table below
summarizes our liquidity at June 30, 2012 (in thousands). Liquidity
(unaudited) June 30, 2012
Borrowing base
$
270,000
Cash and cash equivalents
402
Long-term debt
(145,400)
Unused letters of credit
(350)
Liquidity
$
124,652
Long-term
debt-to-capital
ratio
(unaudited)
is
calculated
as
of
June
30,
2012,
and
by
dividing
long-term
debt
(GAAP)
by
the
sum
of
total
stockholders’
equity (GAAP) and long-term debt (GAAP). We use the long-term
debt-to-capital ratio as a measurement of our overall financial
leverage. However, this ratio has limitations. This ratio can vary from
year-to-year for the Company and can vary among companies based on
what is or is not included in the ratio on a company’s financial statements.
This ratio is provided in addition to, and not as an alternative for, and
should be read in conjunction with, the information contained in
our financial statements prepared in accordance with GAAP (including the notes),
included in our SEC filings and posted on our website. The table below
summarizes our long-term debt-to-capital ratio at June 30, 2012 (in
thousands).
Long-term debt-to-capital (unaudited)
June 30, 2012
Long-term debt
$
145,400
Total stockholders’
equity
480,333
625,733
Long-term debt-to-capital
23.2% |
 Contact
Information
MEGAN P. HAYS
Manager, Investor Relations & Corporate Communications
817.989.9000 x 2108
mhays@approachresources.com
www.approachresources.com |