Attached files
| file | filename |
|---|---|
| 8-K - 8-K - InvenTrust Properties Corp. | a12-18935_18k.htm |
Exhibit 99.1
|
|
PERFORMANCE DRIVEN SUSTAINABLE DISTRIBUTIONS August 23, 2012 Second Quarter 2012 Earnings Call |
|
|
2 Forward-Looking Statements This presentation may contain forward-looking statements. Forward-looking statements are statements that are not historical, including statements regarding management's intentions, beliefs, expectations, representations, plans or predictions of the future, and are typically identified by such words as "believe," "expect," "anticipate," "intend," "estimate," "may," "will," "should" and "could." We intend that such forward-looking statements be subject to the safe harbor provisions created by Section 27A of the Securities Act of 1933 and Section 21E of the Securities Exchange Act of 1934. These forward-looking statements involve numerous risks and uncertainties that could cause actual results to be materially different from those set forth in the forward-looking statements. These risks are outlined more particularly in our annual report on Form 10-K for the year ended December 31, 2011 and any subsequent Quarterly Reports on Form 10-Q to include but are not limited to: recent disruptions in the financial markets and current economic conditions could adversely affect our ability to refinance or secure additional debt financing at attractive terms as well as the values of our investments there is no assurance that we will be able to continue paying cash distributions or that distributions will increase over time funding distributions from sources other than cash flow from operating activities may negatively impact our ability to sustain or pay distributions and will result in us having less cash available for other uses there is no public market for our shares, and stockholders may not be able to sell their shares, including through our share repurchase program increasing vacancy rates for certain classes of real estate assets resulting from the recent economic downturn and disruption in the financial markets could adversely affect the value of our assets we may suffer adverse consequences due to the financial difficulties, bankruptcy or insolvency of our tenants our investments in equity and debt securities have materially impacted, and may in the future, materially impact our results our borrowings may reduce the funds available for distribution and increase the risk of loss since defaults may cause us to lose the properties securing the loans we are subject to conflicts of interest with affiliates of our sponsor, which may affect our acquisition of properties and financial performance we rely on our business manager and property managers to manage our business and assets, and pay significant fees to these parties if we fail to qualify as a REIT, our operations and distributions to stockholders will be adversely affected This material is neither an offer to sell nor the solicitation of an offer to buy any security, which can be made only by the prospectus which has been filed or registered with appropriate state and federal regulatory agencies. No regulatory agency has passed on or endorsed the merits of this offering. Any representation to the contrary is unlawful. The companies depicted in the photographs herein may have proprietary interests in their trade names and trademarks and nothing herein shall be considered to be an endorsement, authorization or approval of Inland American by the companies. Furthermore, none of these companies are affiliated with Inland American in any manner. The Inland name and logo are registered trademarks being used under license. |
|
|
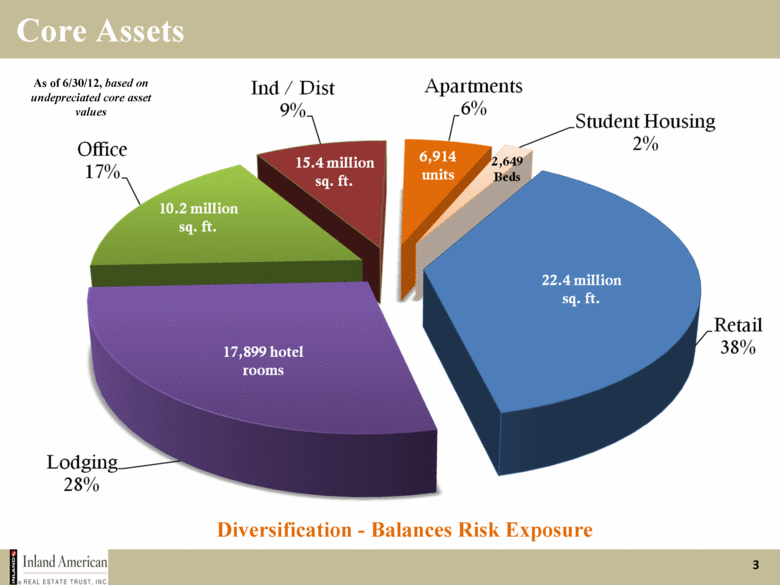
3 Core Assets As of 6/30/12, based on undepreciated core asset values Diversification - Balances Risk Exposure |
|
|
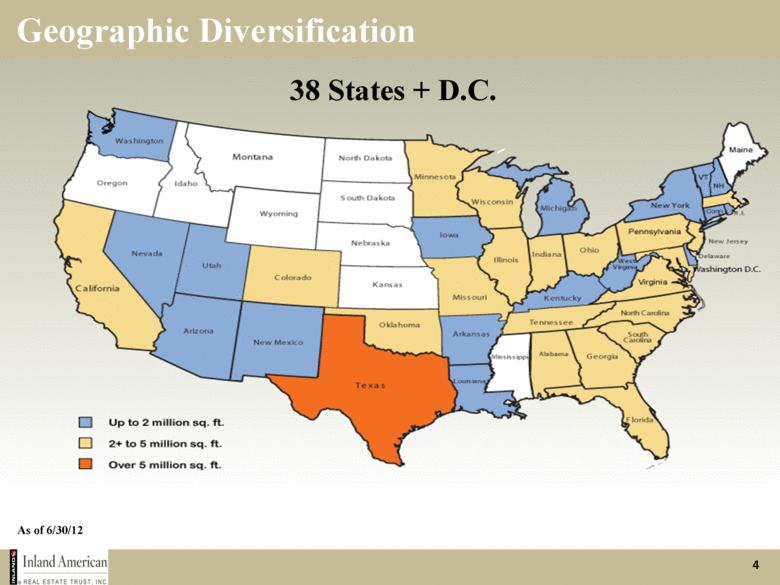
4 Geographic Diversification As of 6/30/12 38 States + D.C. |
|
|
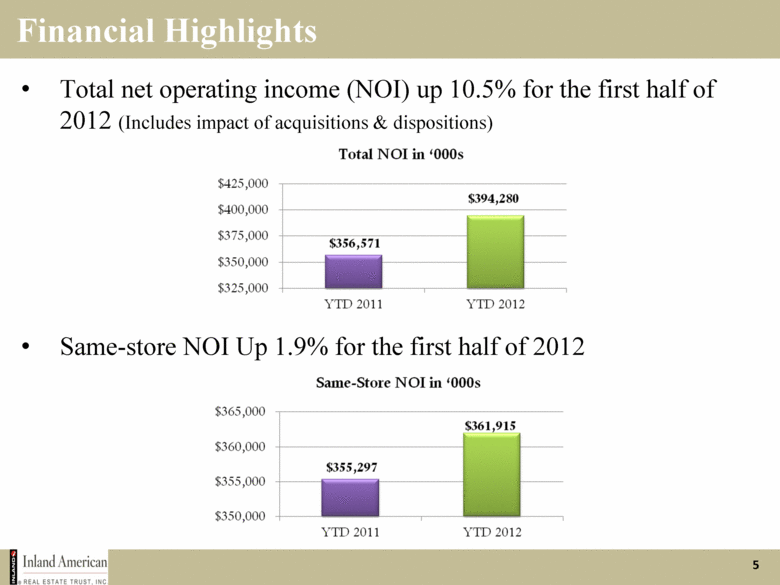
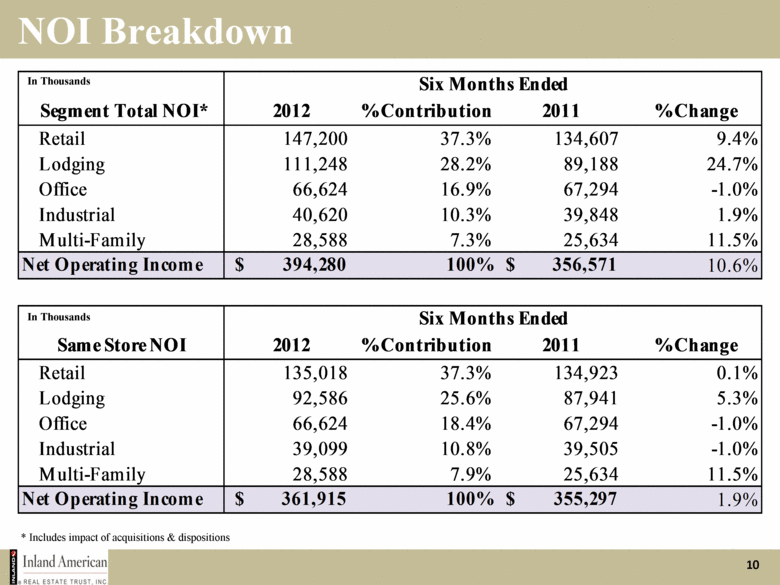
5 Financial Highlights Total net operating income (NOI) up 10.5% for the first half of 2012 (Includes impact of acquisitions & dispositions) Same-store NOI Up 1.9% for the first half of 2012 |
|
|
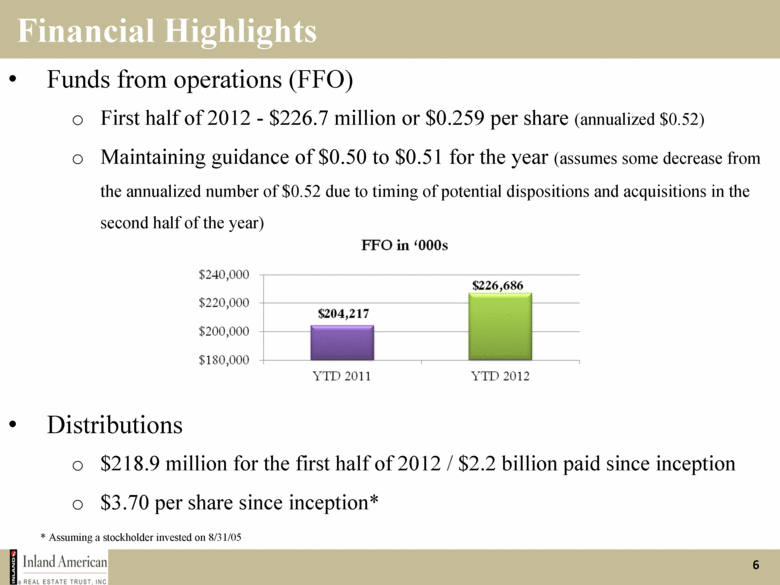
6 Financial Highlights Funds from operations (FFO) First half of 2012 - $226.7 million or $0.259 per share (annualized $0.52) Maintaining guidance of $0.50 to $0.51 for the year (assumes some decrease from the annualized number of $0.52 due to timing of potential dispositions and acquisitions in the second half of the year) Distributions $218.9 million for the first half of 2012 / $2.2 billion paid since inception $3.70 per share since inception* * Assuming a stockholder invested on 8/31/05 |
|
|
7 2012 Portfolio Refinement Acquired $407 million of real estate in the first half of 2012 Segment Number of Properties Price Sq. Ft./Units/Rooms Lodging 5 $393.1 2,302 rooms *Marriott-San Francisco Airport $108.0 685 rooms *Hilton St. Louis Downtown $22.6 195 rooms *Renaissance Arboretum – Austin, TX $103.0 492 rooms *Renaissance Waverly – Atlanta, GA $97.0 521 rooms *Marriott Griffin Gate – Lexington, KY $62.5 409 rooms Retail 2 $13.6 80,947 square feet Dispositions for the first six months totaled $109 million, equaling 1.3 million sq. ft. |
|
|
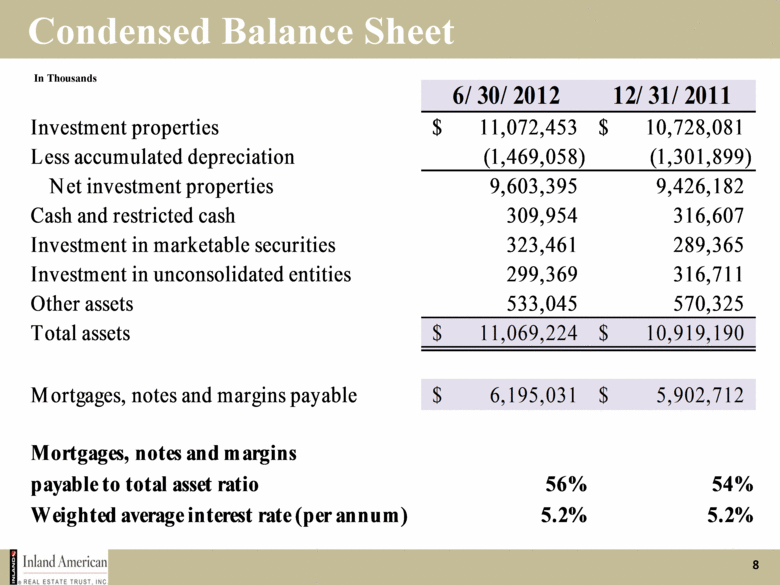
8 Condensed Balance Sheet In Thousands |
|
|
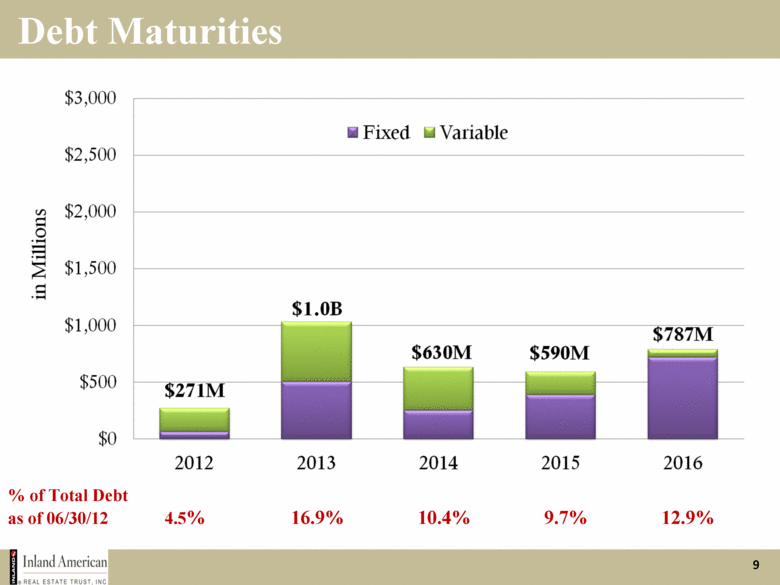
9 Debt Maturities % of Total Debt as of 06/30/12 4.5% 16.9% 10.4% 9.7% 12.9% |
|
|
10 NOI Breakdown In Thousands In Thousands * Includes impact of acquisitions & dispositions |
|
|
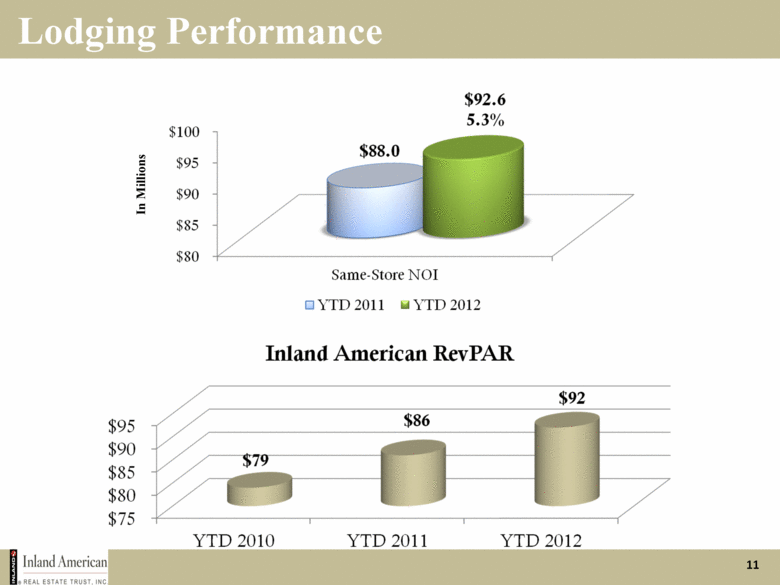
11 Lodging Performance In Millions |
|
|
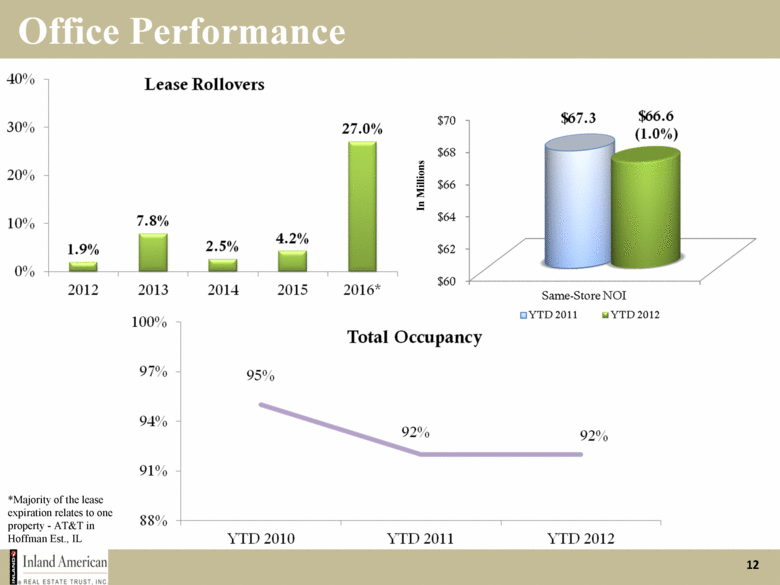
12 Office Performance In Millions *Majority of the lease expiration relates to one property - AT&T in Hoffman Est., IL |
|
|
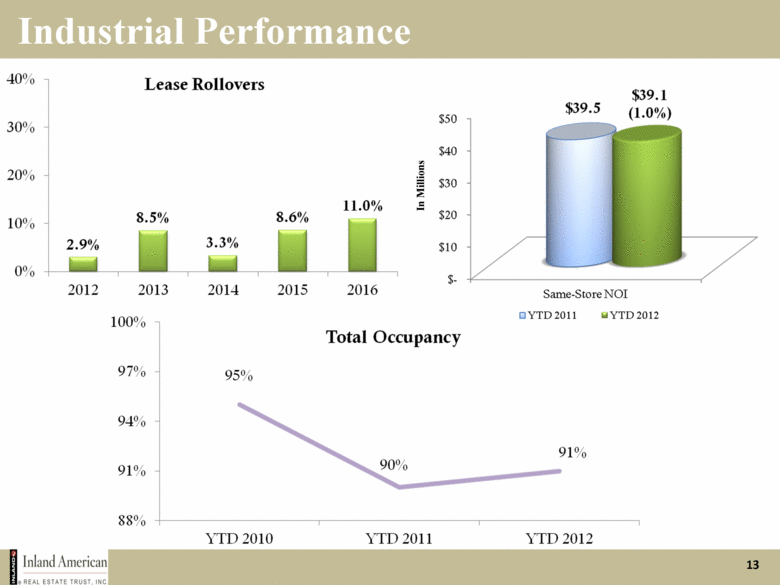
13 Industrial Performance In Millions |
|
|
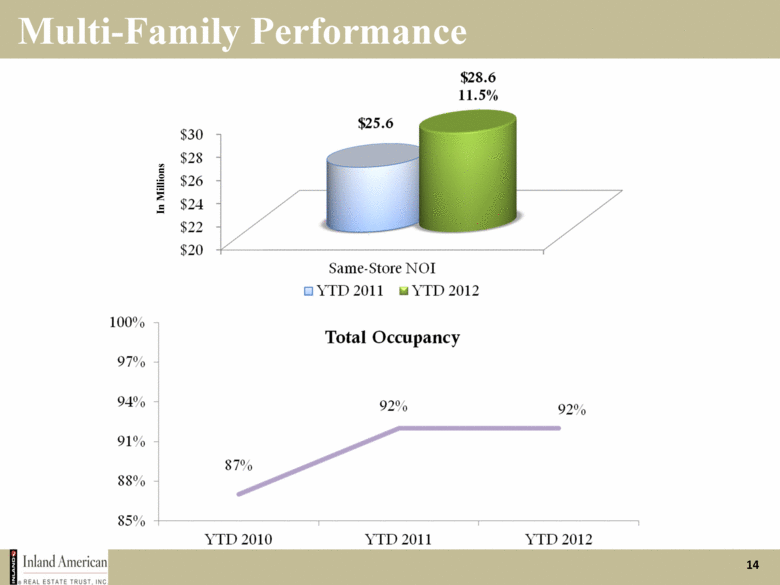
14 Multi-Family Performance In Millions |
|
|
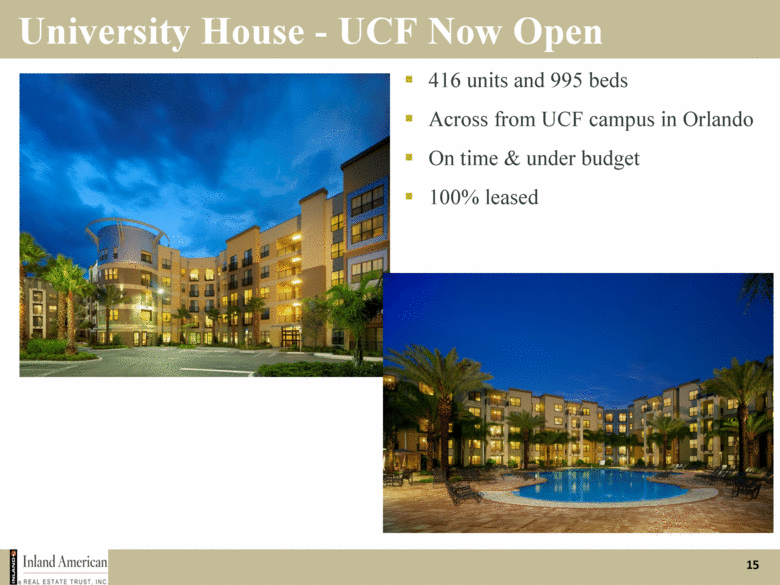
15 University House - UCF Now Open 416 units and 995 beds Across from UCF campus in Orlando On time & under budget 100% leased |
|
|
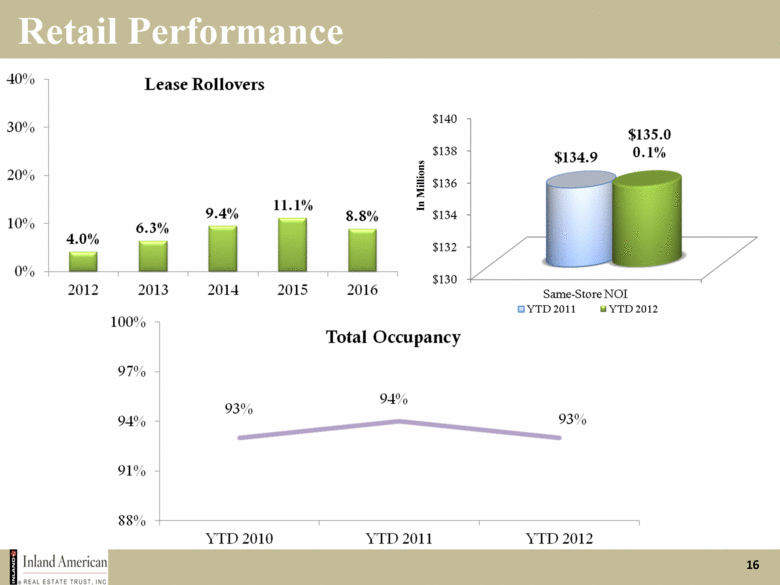
16 Retail Performance In Millions |
|
|
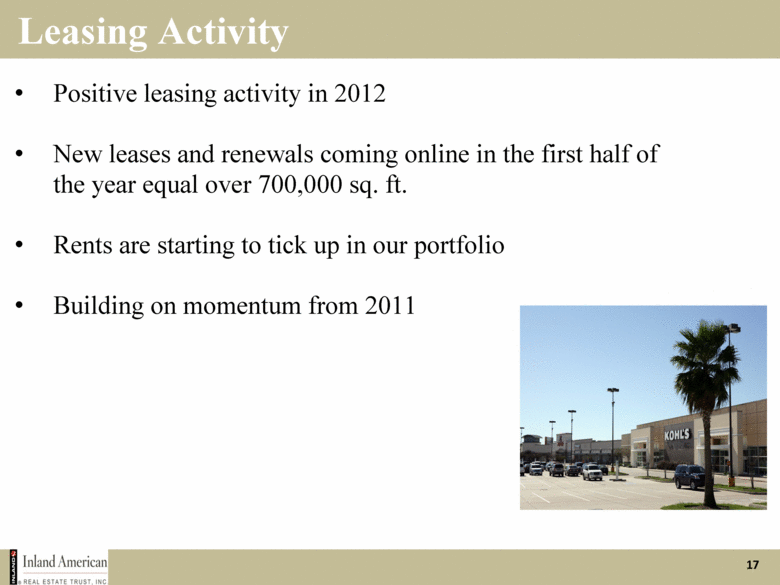
17 Leasing Activity Positive leasing activity in 2012 New leases and renewals coming online in the first half of the year equal over 700,000 sq. ft. Rents are starting to tick up in our portfolio Building on momentum from 2011 |
|
|
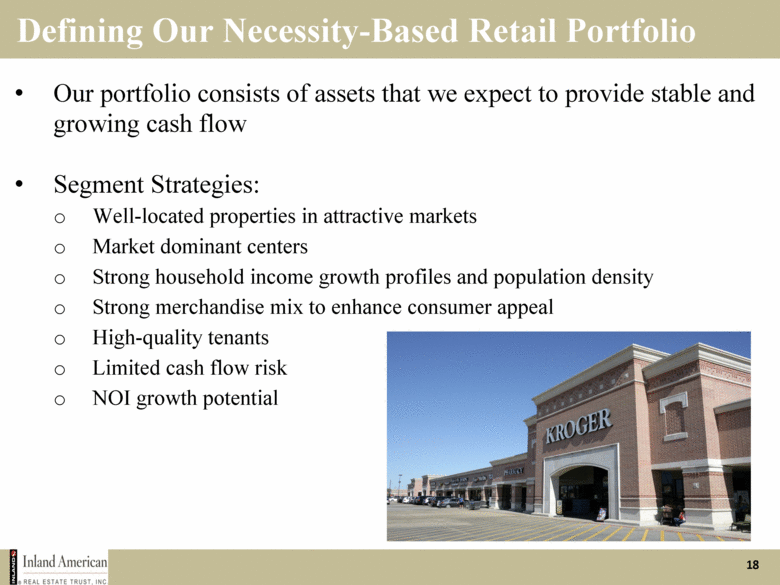
18 Defining Our Necessity-Based Retail Portfolio Our portfolio consists of assets that we expect to provide stable and growing cash flow Segment Strategies: Well-located properties in attractive markets Market dominant centers Strong household income growth profiles and population density Strong merchandise mix to enhance consumer appeal High-quality tenants Limited cash flow risk NOI growth potential |
|
|
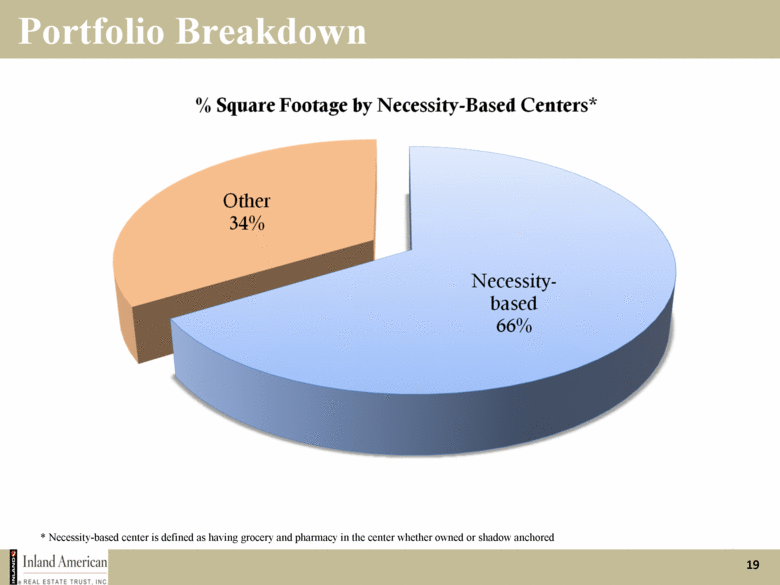
19 Portfolio Breakdown * Necessity-based center is defined as having grocery and pharmacy in the center whether owned or shadow anchored |
|
|
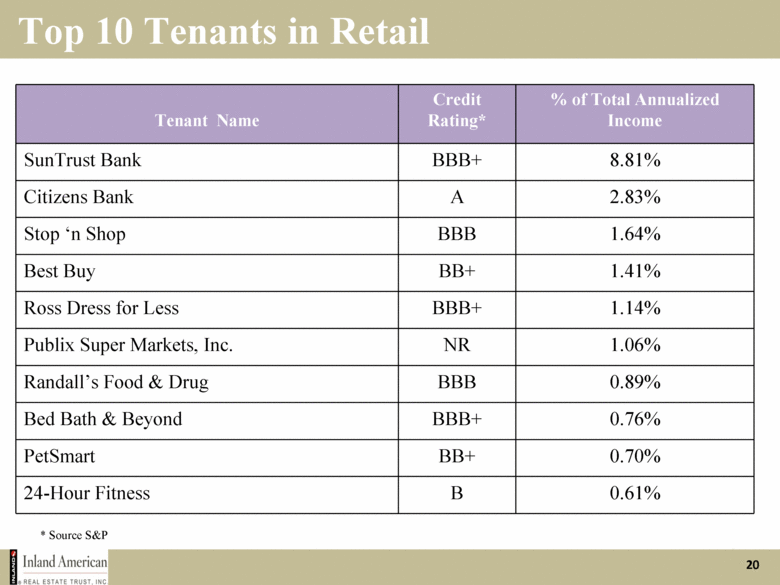
20 Top 10 Tenants in Retail Tenant Name Credit Rating* % of Total Annualized Income SunTrust Bank BBB+ 8.81% Citizens Bank A 2.83% Stop ‘n Shop BBB 1.64% Best Buy BB+ 1.41% Ross Dress for Less BBB+ 1.14% Publix Super Markets, Inc. NR 1.06% Randall’s Food & Drug BBB 0.89% Bed Bath & Beyond BBB+ 0.76% PetSmart BB+ 0.70% 24-Hour Fitness B 0.61% * Source S&P |
|
|
21 Retail Industry Outlook Retail Fundamentals Starting to Improve Across the Country Well-located, necessity-based centers in high demand by tenants Financially healthy national retailers are focused on increasing store count Discount retailers are well positioned to serve cost-conscious consumers Limited development projected in the near term should help drive rents |
|
|
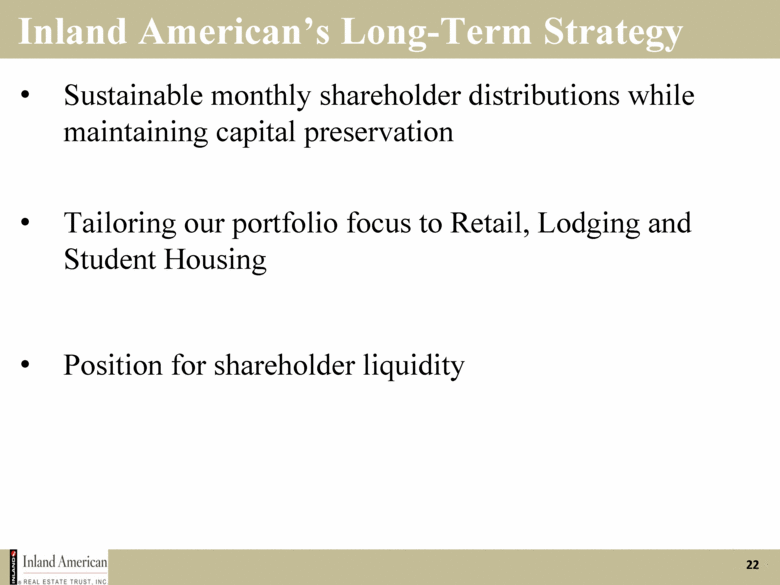
22 Inland American’s Long-Term Strategy Sustainable monthly shareholder distributions while maintaining capital preservation Tailoring our portfolio focus to Retail, Lodging and Student Housing Position for shareholder liquidity |
|
|
23 Lodging Portfolio Strategies Expand ownership of premium branded upper upscale hotels to further enhance our portfolio Historically low supply growth is forecasted Upper upscale segment should see continued strong revenue growth Look for high barriers-to-entry in top-25 urban markets Harvest positive fundamentals / Capital rotation |
|
|
24 Student Housing Portfolio Strategies Continue to grow the student housing portfolio Purpose built – acquisition or development Large universities Continue to invest in innovative design and technology ideas and operational excellence programs to attract students Create and reinforce relationships with universities, municipalities and local owners Continue to expand our platform with management expertise and development capabilities |
|
|
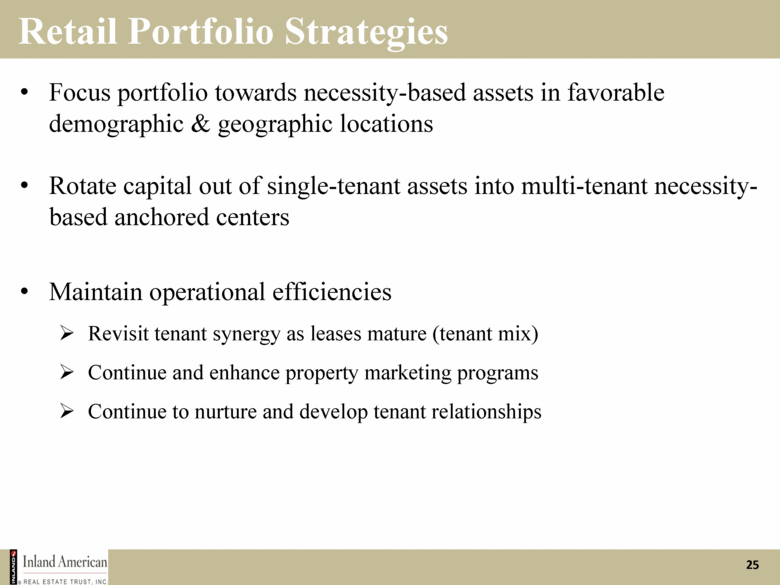
25 Retail Portfolio Strategies Focus portfolio towards necessity-based assets in favorable demographic & geographic locations Rotate capital out of single-tenant assets into multi-tenant necessity-based anchored centers Maintain operational efficiencies Revisit tenant synergy as leases mature (tenant mix) Continue and enhance property marketing programs Continue to nurture and develop tenant relationships |
|
|
26 Shareholder Liquidity Events The timing will be determined by market conditions that are favorable for execution We believe optimal long-term liquidity for our stockholders will be achieved by executing business strategies for each segment We are positioning each segment for potential listing, merger or portfolio sales in the future Our short- to medium-term strategy is to improve the overall quality and position of these segments for long-term growth through selective asset acquisitions and sales |
|
|
27 Key Points & Themes Our overall cash flow and operating performance continues to improve driven by lodging & multi-family assets We believe we have a solid and achievable business strategy for the year, which we have already started to execute Our debt maturities and capital structure are stable and should allow us to execute our business strategies We have dedicated and capable management teams with expertise in each segment with a unique, scalable operating platform that provides strong and consistent results We remain confident in the sustainability of our distributions for 2012 |
|
|
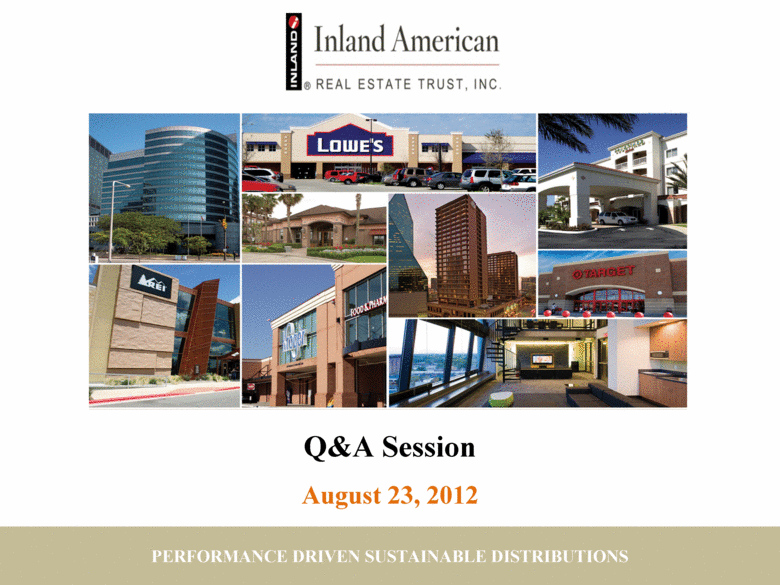
PERFORMANCE DRIVEN SUSTAINABLE DISTRIBUTIONS August 23, 2012 Q&A Session |
|
|
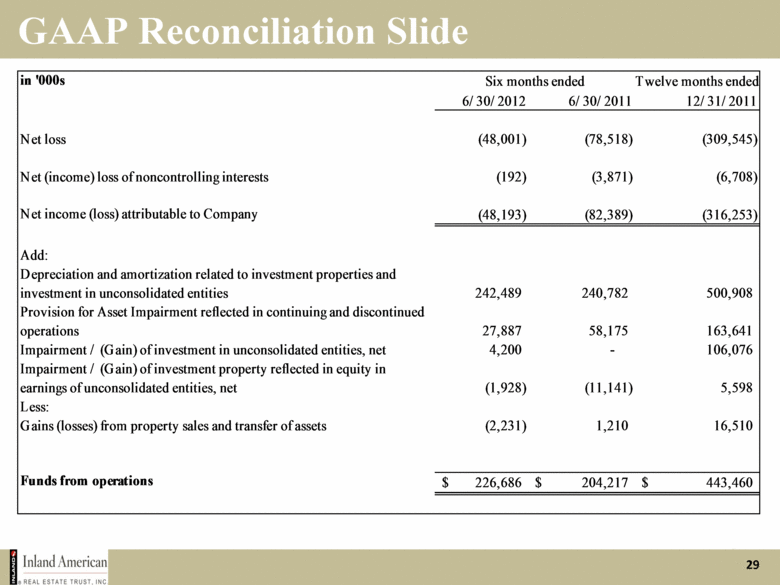
29 GAAP Reconciliation Slide |

