Attached files
| file | filename |
|---|---|
| 8-K - FORM 8-K - BUCKEYE PARTNERS, L.P. | d401036d8k.htm |
 Citi
One-on-One MLP/Midstream Infrastructure Conference August 22-23, 2012
©
Copyright 2012 Buckeye Partners, L.P.
EXHIBIT 99.1 |
 LEGAL
NOTICE/FORWARD-LOOKING STATEMENTS ©
Copyright 2012 Buckeye Partners, L.P.
This presentation contains “forward-looking statements” that we believe to be
reasonable as of the date of this presentation. These statements, which include
any statement that does not relate strictly to historical facts, use terms such as “anticipate,” “assume,” “believe,”
“estimate,” “expect,” “forecast,” “intend,”
“plan,” “position,” “predict,” “project,” or “strategy” or the negative connotation or other
variations of such terms or other similar terminology. In particular, statements,
express or implied, regarding future results of operations or ability to generate
sales, income or cash flow, to make acquisitions, or to make distributions to unitholders are forward-looking statements.
These forward-looking statements are based on management’s current plans,
expectations, estimates, assumptions and beliefs concerning future events impacting
Buckeye Partners, L.P. (the “Partnership” or “BPL”) and therefore involve a number of risks and uncertainties, many
of which are beyond management’s control. Although the Partnership believes that
its expectations stated in this presentation are based on reasonable assumptions,
actual results may differ materially from those expressed or implied in the forward-looking statements. The factors
listed in the “Risk Factors” sections of, as well as any other cautionary language
in, the Partnership’s public filings with the Securities and Exchange Commission,
provide examples of risks, uncertainties and events that may cause the Partnership’s actual results to differ materially
from the expectations it describes in its forward-looking statements. Each
forward-looking statement speaks only as of the date of this presentation, and the
Partnership undertakes no obligation to update or revise any forward-looking statement. |
 INVESTMENT
HIGHLIGHTS ©
Copyright 2012 Buckeye Partners, L.P.
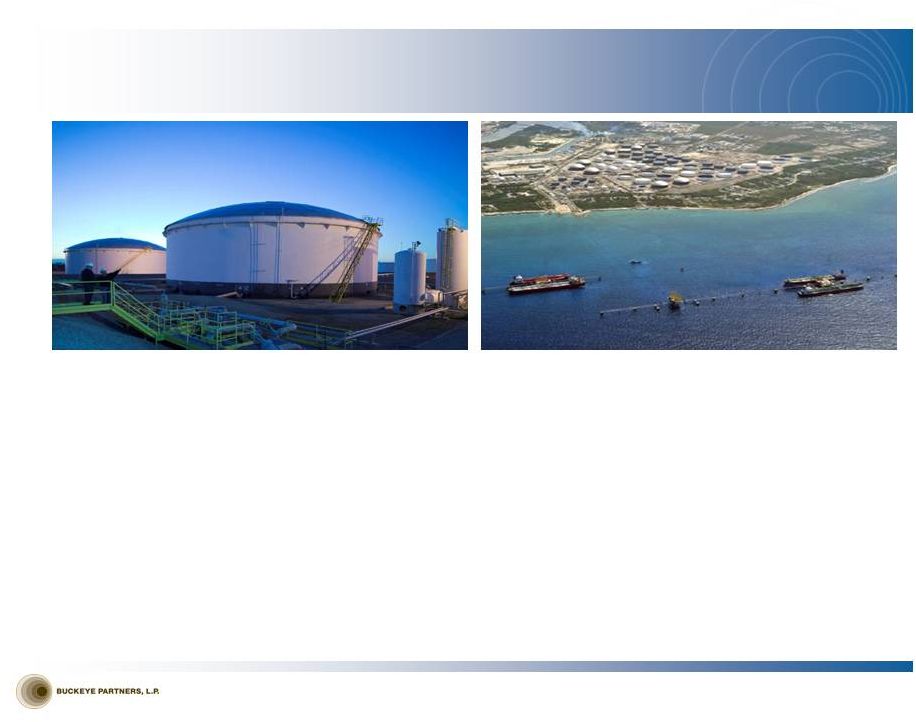
Petroleum storage tanks at our Macungie terminal in Pennsylvania
Aerial view of BORCO’s six offshore jetties with tank farm in the
distance •
Over 125 years of continuous operations, with a 26-year track record as a publicly traded
MLP on the NYSE
•
Market capitalization near $5.0 billion
•
Lower cost of capital realized from elimination of GP IDRs
•
Investment grade credit rating with a conservative approach toward financing growth •
Increased geographic and product diversity resulting from recent acquisitions •
Growth opportunities to unlock significant value from acquisition of assets from major
petroleum companies - “Terminal Franchise”
•
Opportunities for significant internal growth projects on legacy and recently acquired assets •
Paid cash distributions each quarter since formation in 1986
|
 •
Implementing best practices across our business, including acquired assets
•
Improving our cost structure through an organizational restructuring in 2009
•
Expanding our asset portfolio through conservatively financed, accretive acquisitions, and
organic growth projects
•
Diversifying
our
legacy
business
into
new
geographies,
products,
and
asset
classes
•
Reducing cost of capital through the buy-in of our general partner
MANAGEMENT OBJECTIVES
©
Copyright 2012 Buckeye Partners, L.P.
•
The current management team has consistently executed on each element of our strategy to
transform Buckeye into a best-in-class asset manager by:
•
We continue to be committed to our mission of delivering superior returns through our
talented, valued employees and our core strengths of:
Achieving Financial and Operational Excellence
•
Best-in-class customer service
•
Operational excellence that provides consistent, reliable performance to optimize the
assets we own and operate
•
An unwavering commitment to safety, environmental responsibility, regulatory compliance,
and personal integrity
•
An entrepreneurial approach toward asset acquisition and development
|
 CEO SUCCESSION
AND STRATEGIC ORGANIZATIONAL REALIGNMENT CEO succession effective 1Q 2012:
•
Clark C. Smith, Buckeye’s President and Chief Operating Officer,
succeeded Forrest E. Wylie as Chief Executive Officer, and joined the
Board of Directors of Buckeye’s general partner.
•
Forrest E. Wylie continues to serve as Non-Executive Chairman of the
Board, where he remains active in developing our strategic vision.
Strategic Organizational Realignment rationale:
•
•
Growth has resulted in increased complexities in each of Buckeye’s business areas,
requiring focus and ownership of skilled executives on a daily basis.
•
Allows business unit Presidents to focus on all aspects of performance–including
commercial, operational, and financial performance–of their respective business
unit. •
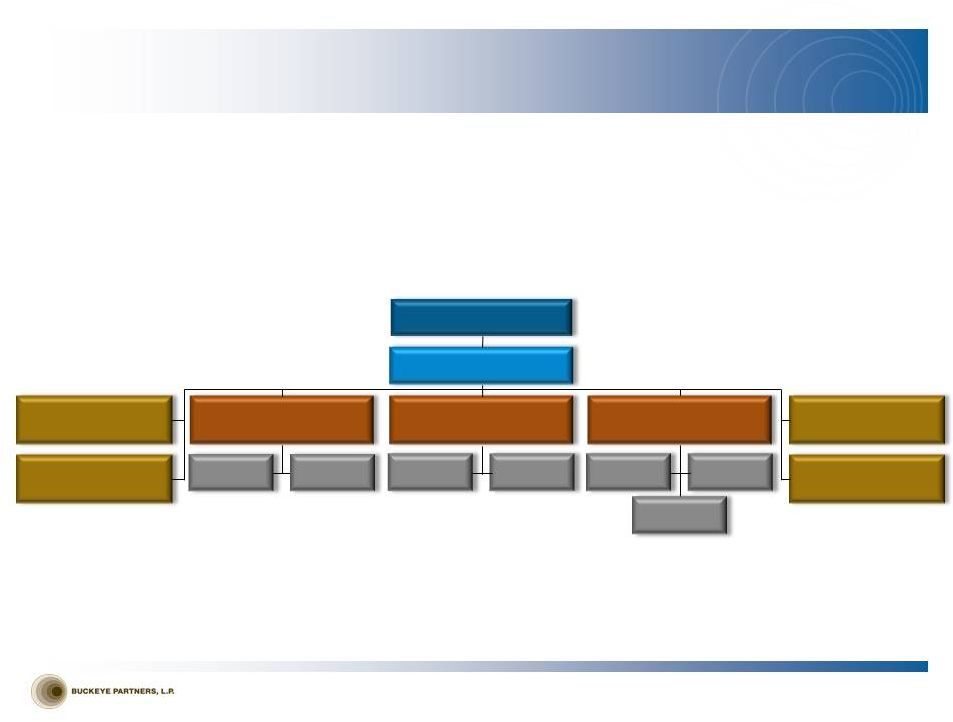
Board of Directors
Strategic Organizational Realignment, effective 1Q 2012; Buckeye
operations organized into three business units, each headed by a
President.
•
Domestic Pipelines & Terminals
•
International Pipelines & Terminals
•
Buckeye Services
Management Structure after Reorganization
©
Copyright 2012 Buckeye Partners, L.P.
Forrest E. Wylie
Chairman
Clark C. Smith
Chief Executive Officer
Keith E. St.Clair
Chief Financial
Officer
Robert A. Malecky
President, Domestic
Pipelines and Terminals
Mary F. Morgan
President, International
Pipelines and Terminals
Jeremiah J. Ashcroft, III
President,
Buckeye Services
William H. Schmidt, Jr.
General Counsel
Khalid A. Muslih
Corp. Development &
Strategic Planning
Domestic
Pipelines
Domestic
Terminals
BORCO
Terminal
Yabucoa
Terminal
Energy
Services
Natural Gas
Storage
Mark S. Esselman
Global
Human Resources
Development
& Logistics
Presidents of business units accountable for overall performance of those units. Previous structure organized around functions (e.g., commercial,
operations, etc.). |
 ORGANIZATIONAL
OVERVIEW Three Business Operating Units
Domestic Pipelines & Terminals
(1) See Appendix for Non-GAAP Reconciliations
©
Copyright 2012 Buckeye Partners, L.P.
•
Over 6,000 miles of pipeline with ~100 delivery locations
•
Approximately 100 liquid petroleum product terminals
•
Over 41 million barrels of liquid petroleum product storage capacity
•
Over 27 million barrels of storage capacity at 2 terminal facilities
in The Bahamas (~22 million) and Puerto Rico (~5 million)
•
Deep water berthing capability to handle ULCCs and VLCCs
in The Bahamas
•
Announced expansion underway to add approximately 4.7 million
barrels at Bahamian facility; first 1.1 million barrels placed in service in July
2012.
Buckeye Services
Natural Gas Storage
•
~30 Bcf of working natural gas storage capacity in Northern California
Energy Services
•
Markets refined petroleum products in areas served by Domestic Pipelines
& Terminals
•
5 terminals with ~1 million barrels of storage capacity
Development & Logistics
•
Operates ~2,800 miles of pipeline and 1.4 million barrels of storage capacity
under operation and maintenance contracts
International Pipelines & Terminals |
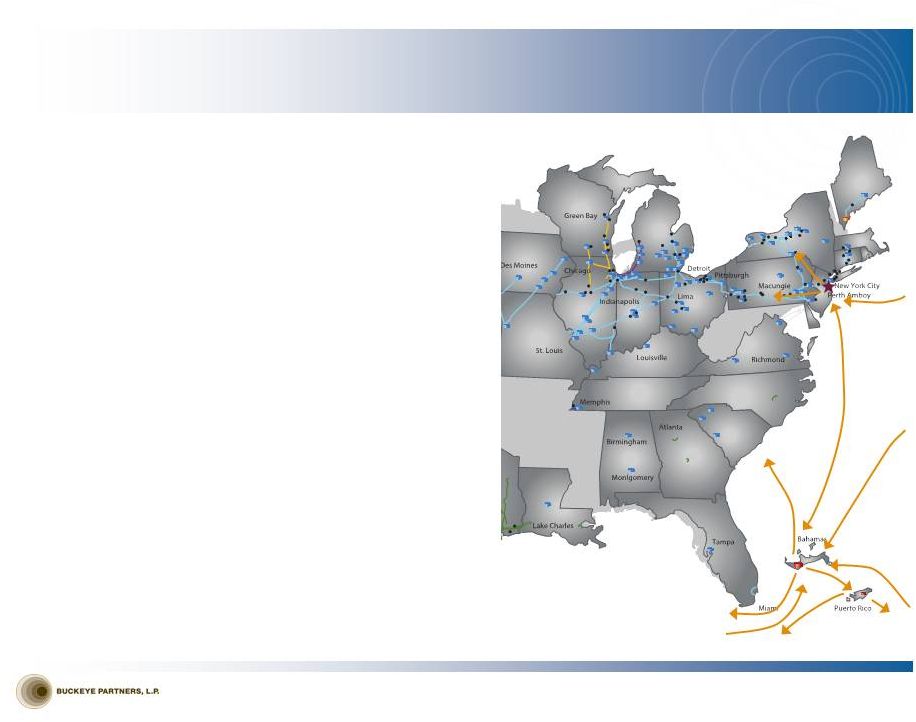
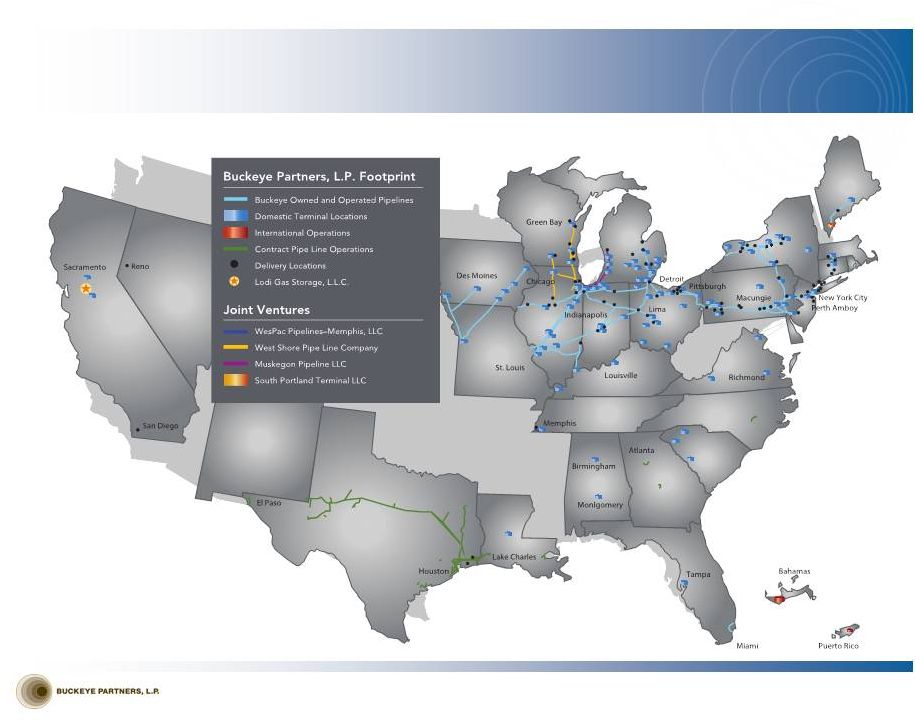 BUCKEYE SYSTEM
MAP ©
Copyright 2012 Buckeye Partners, L.P. |
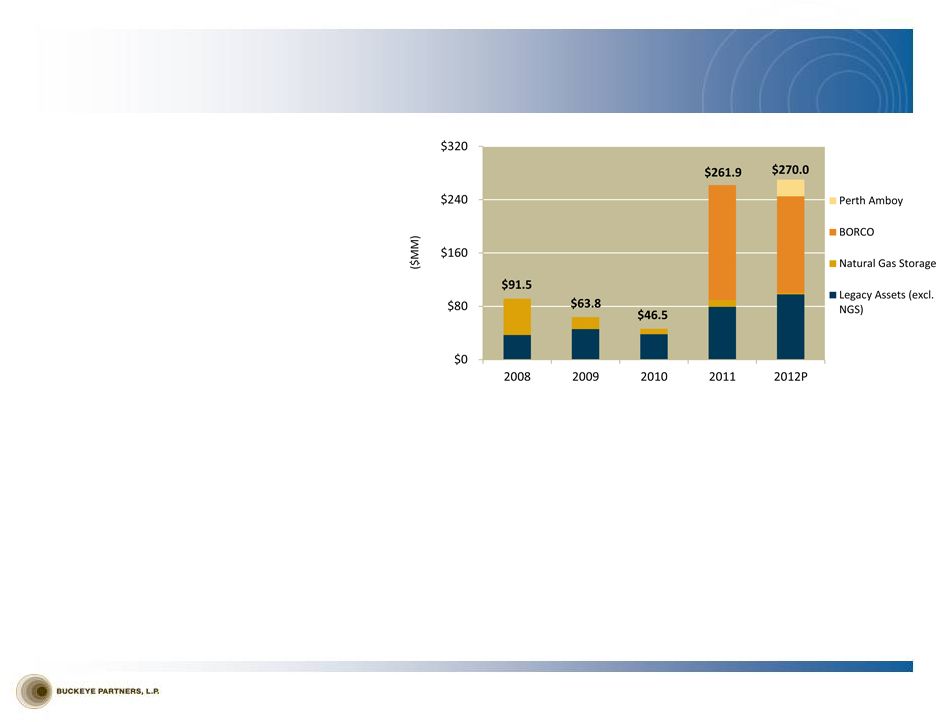 VALUE
CREATION/GROWTH DRIVERS $4 Billion Invested Since 2008
Perth Amboy, New Jersey Marine Terminal,
$260.0 million
BORCO Marine Terminal, $1.7 billion
BP Pipeline & Terminal Assets, $165.0 million
Maine Terminals and Pipeline, $23.5 million
Buy-in of BPL’s general partner, 20 million units issued
Yabucoa, Puerto Rico Terminal, $32.6 million
Opelousas, Louisiana Terminal, $13.0 million
Additional Equity Interest in West Shore Pipe Line Company,
$13.5 million
Blue/Gold Pipeline and Terminal Assets, $54.4 million
Lodi Natural Gas Storage, $442.4 million
Farm & Home Oil Company
(2)
, $146.2 million
(3)
Niles and Ferrysburg, Michigan Terminals, $13.9 million
Albany, New York Terminal, $46.9 million
(1)
Excludes acquisitions with a value of $10 million or lower
(2)
Now Buckeye Energy Services
(3)
Buckeye sold the retail division of Farm & Home Oil Company in 2008 for $52.6
million (4)Estimate provided is mid-point of expected organic growth capital spend
range Transformation of Perth Amboy terminal into highly efficient, multi-
product storage, blending, and throughput facility
Significant expansion and product diversity plans at BORCO facility
Propylene
rail
loading
and
storage
project
and
storage
expansion
and
unit train rack construction at two terminals within our Chicago
complex
Pipeline expansion between our Linden, NJ and Macungie, PA terminals
to increase capacity to Western PA
Butane blending and vapor recovery installations planned for numerous
terminal facilities across our system
Organic Growth Capital Spending
©
Copyright 2012 Buckeye Partners, L.P.
•
•
•
•
•
•
•
•
•
•
•
•
•
•
•
•
•
2012
2011
2010
2009
2008
Recent Transactions
(1)
Major Capital Projects in Current Year
• |
 Domestic
Pipelines & Terminals ©
Copyright 2012 Buckeye Partners, L.P. |
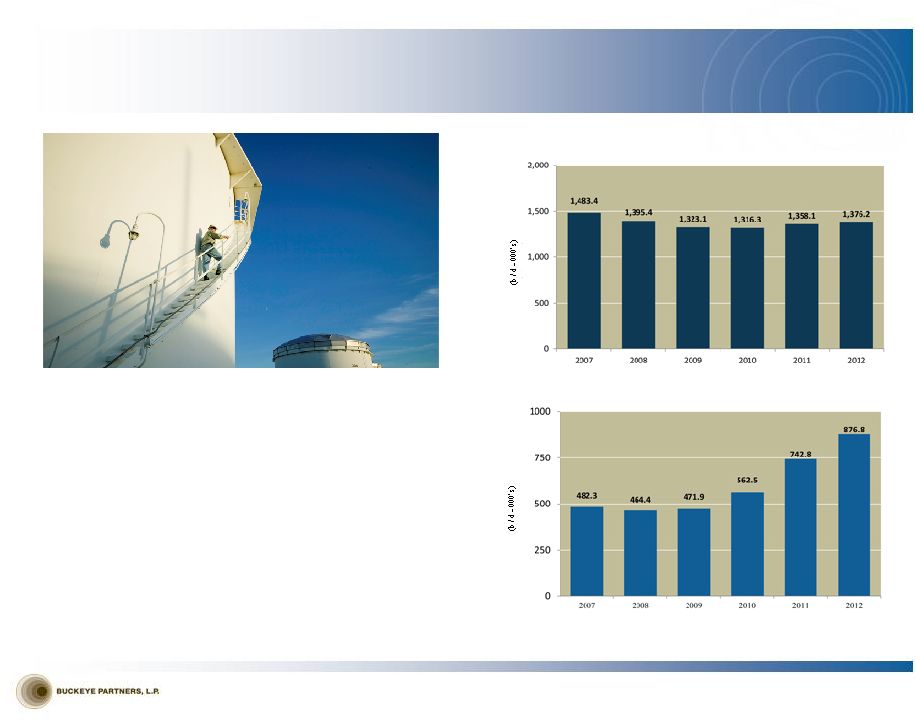 DOMESTIC
PIPELINES & TERMINALS OVERVIEW Petroleum storage tanks at our Macungie terminal in
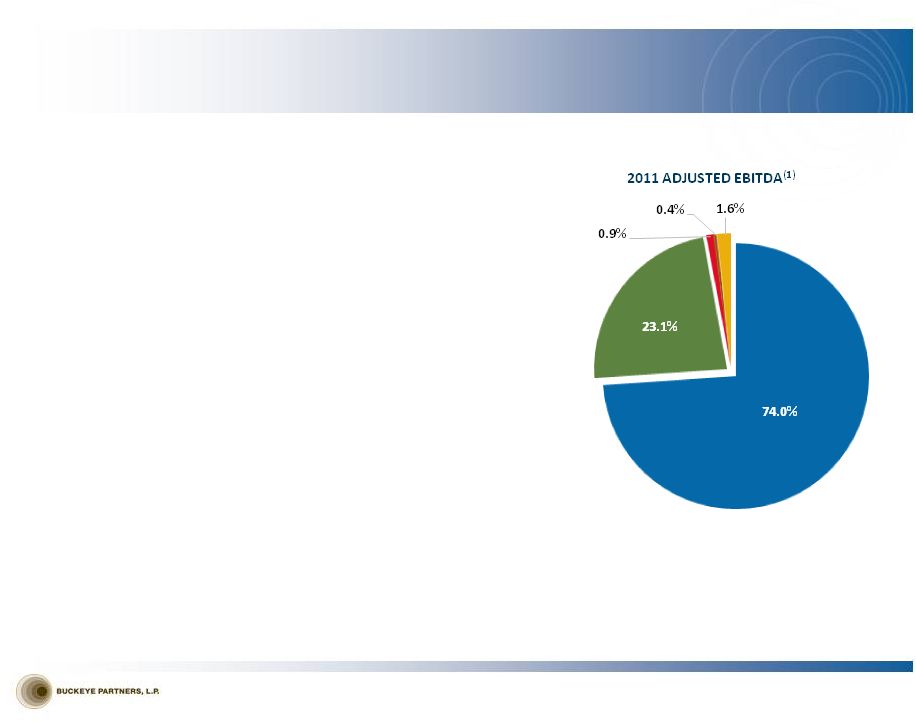
Pennsylvania Pipelines & Terminals segment represents Buckeye’s
largest segment contribution to Adjusted EBITDA
Over 6,000 miles of pipeline located primarily in the
Northeast and Midwest United States moving over 1.3
million barrels of liquid petroleum products per day
with more than 100 delivery points
Approximately 100 liquid petroleum product storage
terminals located throughout the United States
Over 40 million barrels of storage capacity
Terminal
Throughput
Volumes
(1)
Pipeline
Throughput
Volumes
(1)(2)
(1)
(2)
©
Copyright 2012 Buckeye Partners, L.P.
sold in January of 2010
YTD as of June 30, 2012
Pipeline volumes exclude contribution from the Buckeye NGL Pipeline
•
•
•
• |
 BP PIPELINES
& TERMINALS ACQUISITION •
Transaction closed in June 2011
•
Total transaction purchase price of $165 million
•
33 liquid products terminals expanding Buckeye’s footprint
in the Midwest as well as providing geographic diversity
with terminals in the Southeast and on the West Coast
•
643 miles of refined product pipeline in Iowa and Northern
Ohio
•
590-mile “Lower V”
pipeline system that originates in
Dubuque, Iowa and runs southwest into Missouri and
then northwest back into Iowa
•
53 miles of pipelines in Northern Ohio
Transaction Overview
Benefits
to Buckeye
•
Represents a key step in Buckeye’s continued expansion and
geographic diversification efforts
•
Facilitates participation in several growth markets outside
Buckeye’s previous system footprint
•
Provides stable tariff and fee-based revenue streams,
supported by multi-year throughput commitments by BP
•
Acquisition was accretive to distributable cash flow
•
Commercial development of these assets has exceeded plan
•
Execution of our Best Practices Initiative strategies:
•
Rapid realization of operating synergies with Buckeye’s
existing assets
•
Headcount reduction pursuant to synergy realization
•
Process improvement resulting in efficient, cost-effective
operations
•
Operation
of
integrated
assets
under
Buckeye
business
strategy,
which
includes
utilization
of
assets
at
the
lowest
costs
per
unit
©
Copyright 2012 Buckeye Partners, L.P. |
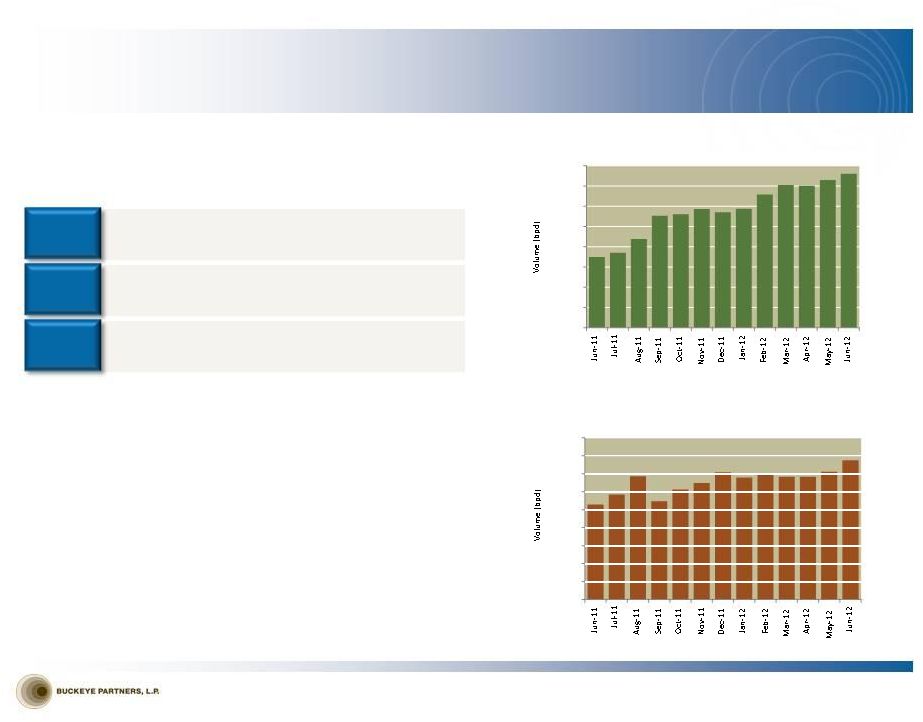 BP
ACQUISITION—STRONG RESULTS Successful Execution of Terminal Growth Franchise
•
Pipeline and terminal volumes have exceeded plan since
inception
•
Continued growth expected with several additional new
contracts still to be signed in the short term
•
Belton, SC and Fairfax, VA are select examples that
highlight significant growth through incremental third-
party business, and new products and service offerings
Terminal
Growth
Franchise
–
Ability
to
quickly
integrate
these
spun-off assets while unlocking significant value through
commercialization and application of our best practices formula
33
34
Belton, SC
Fairfax, VA
©
Copyright 2012 Buckeye Partners, L.P.
Number of new third-party terminal customers
Percentage increase in Adj. EBITDA contribution
from these assets for June 2012 vs. June 2011
14.5
Percentage of volume growth across all 33 acquired
terminals since inception
-
2,000
4,000
6,000
8,000
10,000
12,000
14,000
16,000
-
2,000
4,000
6,000
8,000
10,000
12,000
14,000
16,000
18,000 |
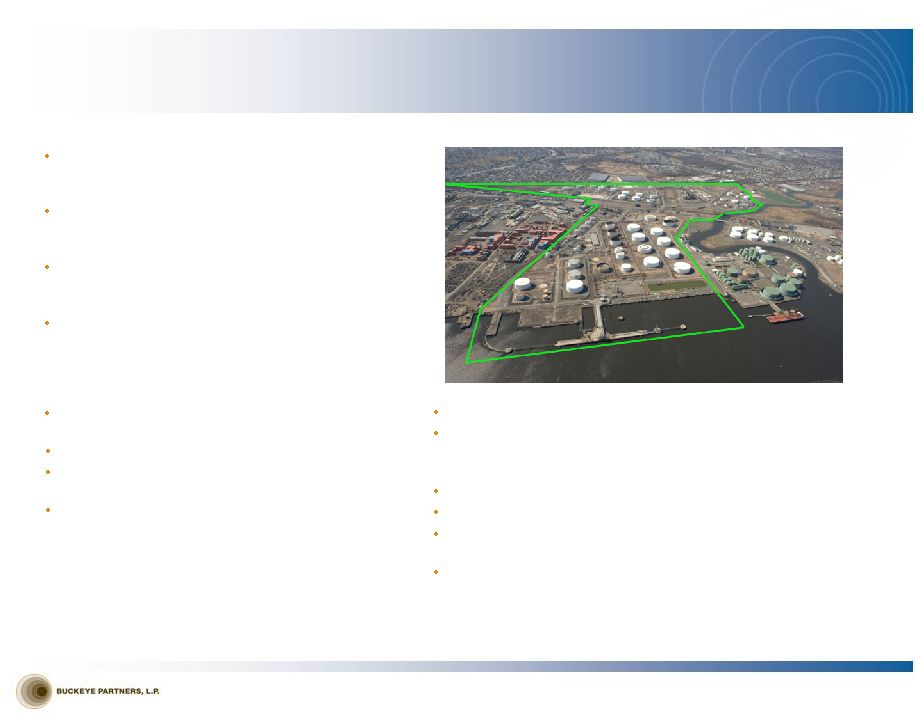 PERTH AMBOY
ACQUISITION OVERVIEW Acquisition of a New York Harbor marine terminal for
liquid petroleum products from Chevron for $260
million in cash
Unique opportunity to acquire key link in the product
logistics chain to unlock significant long-term value
across the Buckeye enterprise
Near-term plans to transform existing terminal into a
highly efficient, multi-product storage, blending, and
throughput facility
Anticipated growth capital investment in the facility of
~$200-225 million over the next three years at
attractive annual Adjusted EBITDA investment multiple
of 4 –
5x, resulting in all-in Adjusted EBITDA
investment multiple of 7 –
8x
(1)
Transaction supported by multi-year storage, blending,
and throughput commitments from Chevron
Closed on July 26, 2012
Expected to be accretive to distributable cash flow per
unit in 2013
Portion of purchase price funded indirectly by
February 2012 registered direct offering of LP units
Note: Facility
located in Perth
Amboy, NJ.
Green line
indicates
approximate
property
boundaries
Located in New York Harbor as a NYMEX delivery point
Approximately 4.0 MMBbls total storage capacity
•
~2.7 MMBbls of active refined product storage
•
~1.3 MMBbls of refurbishable storage
4 docks (1 ship, 3 barge
(2)
) with water draft up to 37'
Pipeline, water, rail, and truck access
~250 acre site with significant undeveloped acreage for expansion
potential
Close proximity for integration with Buckeye’s Linden complex
(1)
Includes acquisition purchase price and capital spent on tanks, terminal piping, dock and truck
rack improvements, and ~6 miles of new pipeline to be constructed from Perth Amboy to Buckeye’s Linden, NJ complex.
(2)
One of the barge docks is currently out of service.
Facility Overview
©
Copyright 2012 Buckeye Partners, L.P.
Transaction Overview |
 PERTH AMBOY
COMMERCIAL STRATEGY PADD
(1)
1 Market Opportunity
•
The PADD 1 region has ~36% of the U.S.
population and relies on PADD 3 and international
imports and transfers of refined products to meet
market demand
•
All U.S. Northeast product not produced by local
refineries must be supplied either through import
or inter-PADD transfers, increasing storage
capacity demand in the New York Harbor
•
New York Harbor NYMEX delivery point: nexus of
U.S. Northeast petroleum flows
•
Significantly more trading liquidity than
Philadelphia market
(1)
Petroleum Administration for Defense Districts
Buckeye Business Strategy
•
Pipeline constraints and poor facility
configurations (tank-to-tank communication) at
some existing terminals in New York Harbor result
in inefficiencies
•
Ability to complement storage with local product
distribution via truck rack
•
Strong interest expressed for a Bakken/Utica
crude solution, bunker fuel growth, and asphalt
terminalling/supply
•
Opportunity to tie-in imports and exports to/from
the U.S.
©
Copyright 2012 Buckeye Partners, L.P.
•
Perth Amboy is in a highly attractive location in the
New York Harbor with access to the large local PADD
1 market
•
Multi-mode takeaway capacity (pipe, water, rail, truck)
connected to the Buckeye system and inland distribution
network
•
Balanced focus on imports/exports for clean
products (gasoline, distillates, jet) and dirtier fuels
(crude, fuel oil, asphalt)
•
Facilitates U.S. Northeast product flow and logistics
•
Secures and diversifies access to product supply
•
Extension of the product value chain with BORCO
Optimal facility configuration with simultaneous operations and high-speed takeaway capacity
will give Perth Amboy competitive advantages in the marketplace |
 LONG-TERM
VISION – “Connecting the Dots…”
•
Global supply and demand imbalances expected to persist,
but they will likely continue to shift as the rate of change
accelerates
•
We believe New York Harbor and Buckeye’s pipeline system
are critical components to facilitate Northeast product flow
logistics
•
BORCO, Perth Amboy, and Yabucoa are key components of a
long-term marine terminal strategy
•
Execution on this strategy will continue to differentiate
Buckeye’s service offerings and provide sustainability and
optionality for further growth in our core businesses
BORCO
Yabucoa
©
Copyright 2012 Buckeye Partners, L.P.
•
Anticipate new sources of product supply in the future
•
New global refining capacity coming online will seek deficit markets
•
Northeast U.S. refineries face long-term challenges from high cost
and low investment
•
Perth Amboy will function as a premier access point for refined
petroleum products moving into PADD 1
•
A component of our strategy in acquiring BORCO was to help
facilitate product flow into the Buckeye system in PADD 1
•
Create a more fully integrated and flexible system with superior
trade flow connectivity, service capabilities, and tankage versatility
|
 DOMESTIC
PIPELINES & TERMINALS GROWTH POTENTIAL NY Harbor to PA Expansion
(completed 4/1/12):
•
Increased Buckeye’s ability to handle NY
Harbor barrels destined for the Pennsylvania
market
•
Incremental 30,000 bpd of pipeline capacity
Bakken Crude:
•
Contracted to offload approximately 8,600 bpd
of Bakken crude for refinery customer at
Woodhaven, MI facility
•
In preliminary discussions with multiple
customers regarding supplying Bakken crude to
the East Coast refineries
•
Perth Amboy well-suited for handling via rail
Butane Blending:
•
Significant growth driven by strong blending
margins
•
Improved blending efficiencies and oversight
•
Opportunities for further locational
deployment of blending capabilities
Propylene Rail Facility
(in progress):
•
Construction of new propylene storage at East
Chicago facility
•
Add rail loading capability at that facility
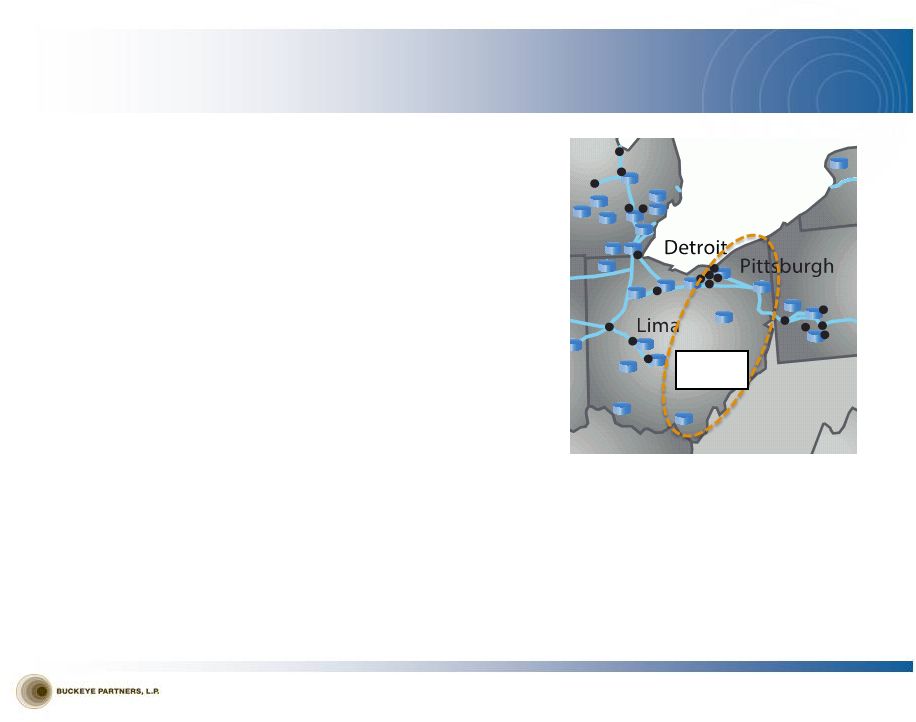
Utica Shale
Opportunity:
•
Development is
in early stages,
but industry
consensus is that
crude logistics
solutions will be
needed
•
Buckeye has
presence in area
and has
opportunity to
utilize existing
infrastructure,
including ROW
and underutilized
lines, to be key
logistics provider
Miami and JFK Airports Pipeline Expansions (potential):
•
Reviewing expansion options as a result of jet fuel volume growth
Chicago Complex Crude Oil Storage Opportunity (potential):
•
Opportunity to leverage asset footprint in Chicago to take
advantage of changing crude oil slates in the market
PROJECTS
©
Copyright 2012 Buckeye Partners, L.P.
Primary
Utica Shale
Utica Shale
Opportunity: |
 FERC ORDER
Buckeye Pipe Line’s Market-Rate Program
©
Copyright 2012 Buckeye Partners, L.P.
History of Program
•
In 1991, FERC approved Buckeye Pipe Line Company, L.P.’s (“BPL Co.”) use of an
innovative rate-setting system.
•
In competitive markets, BPL Co. sets rates competitively under the program, subject to a cap •
Rates in the other markets are tied to changes in competitive market rates •
On March 1, 2012, BPL Co. filed for system-wide rate increases under the program, to which
a single shipper in the New York City area protested. •
On March 30, 2012, FERC issued an order rejecting the rate increases and indicated FERC would
review whether to continue the program. BPL Co.’s response, which was filed
May 15, affirmed that the program has functioned reasonably, has adjusted rates in line with the pipeline
industry, and has not caused undue discrimination among its shippers. •
On June 29, 2012, the initial protesting party filed comments contending that BPL Co.’s
program has not been reasonable and should be discontinued; three companies intervened
in the proceedings without taking a position, while three companies and a committee representing
jet fuel consumers at an airport supported the position of the protesting party. •
On July 16, 2012, BPL Co. filed an answer, rebutting the assertions in the protesting
party’s June 29 filing. The protesting party then filed an answer on July
30, 2012, to which we subsequently responded on August 14, 2012.
Program Footprint
•
Approximately 70% of Buckeye’s total pipeline revenue in 2011 and under 50% of our
Pipeline & Terminals segment’s 2011 revenues.
•
In 1991, when FERC last reviewed BPL Co.’s markets: •
15 of the 20 markets (50% of BPL Co.’s 2011 revenues) were designated competitive •
Four out of 20 markets (25% of BPL Co.’s 2011 revenues) were considered
non-competitive
•
No determination was made regarding the NYC market (remaining 25% of BPL Co.’s 2011
revenues)
•
FERC order does not affect any pipelines or terminals owned by our other operating
subsidiaries.
Possible Outcomes
•
Buckeye believes the program should be preserved because the markets remain competitive and
the program is in line with industry experience and overall cost trends. •
FERC may discontinue or modify the program to its generic rate-setting methodology of
indexing or one of the alternative methodologies (market-based, cost-based, or
settlement-based rates).
•
Depending on the outcome of FERC’s review, the level of some or all of BPL Co.’s
rates could be subject to change, which could have a material impact on our revenues. |
 International Pipelines & Terminals
©
Copyright 2012 Buckeye Partners, L.P. |
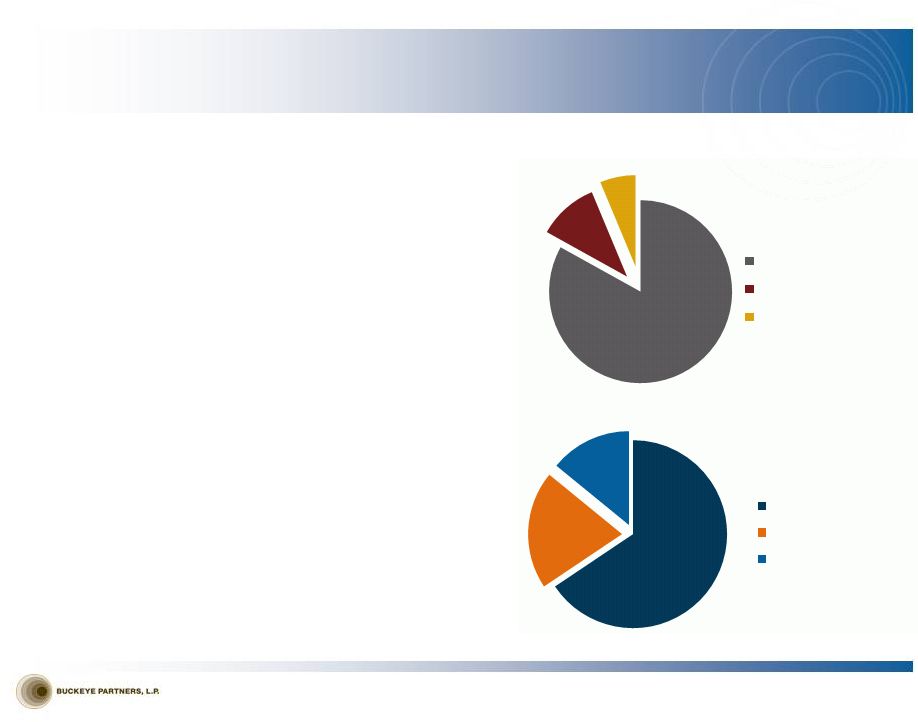 INTERNATIONAL
PIPELINES AND TERMINALS (1)
Excludes non-cash amortization of unfavorable storage contracts.
©
Copyright 2012 Buckeye Partners, L.P.
83%
11%
6%
BORCO 2011 REVENUE
(1)
Storage (take or pay)
Berthing (variable)
Other Ancillary (variable)
66%
20%
14%
BORCO 2011 LEASED CAPACITY
Fuel Oil
Crude Oil
Refined Products
BORCO
•
World-class marine storage terminal for crude oil, fuel oil, and refined
petroleum
products
•
22.5 MMBbls capacity •
Located in Freeport, Bahamas, 80 miles from Southern Florida and 920
miles from New York Harbor •
Deep-water access (up to 91 feet) and the ability to berth VLCCs and
ULCCs
•
Significant amount of capacity under long-term (3-5 year) take or pay
contracts
•
World-class customer base •
Variable revenue generation from ancillary services such as berthing,
blending, bunkering, and transshipping •
Hub for international logistics •
Expansion project approved for 4.7 million barrels with 1.1 million
barrels delivered to date; room to double storage capacity if market
conditions permit
International Pipelines & Terminals Yabucoa, Puerto Rico
•
Well maintained facility with superior blending/manufacturing facilities •
4.6 million barrels of refined petroleum product, fuel oil, and crude oil
storage capacity
•
Strategic location supports a strong local market and also provides
regional growth opportunities •
Long-term fee-based revenues supported by multi-year volume
commitments from Shell |
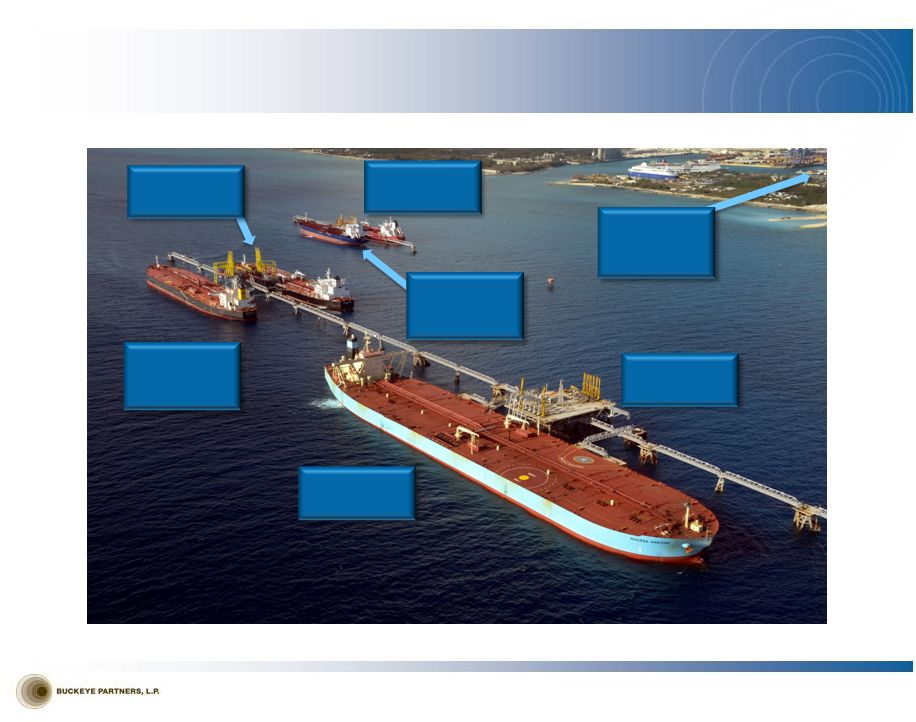 BORCO BERTHING
CAPABILITIES SIX OFFSHORE JETTIES AND INLAND DOCK
©
Copyright 2012 Buckeye Partners, L.P.
BERTH 5
Fuel Oil
Clean Products
BERTH 7
Fuel Oil
Clean Products
Berth 12
(Inland Dock)
Fuel Oil
Clean Products
BERTH 8
Crude Oil
Fuel Oil
Clean Products
BERTH 6
Crude Oil
Fuel Oil
Clean Products
BERTH 9
Crude Oil
Fuel Oil
BERTH 10
Crude Oil
Fuel Oil |
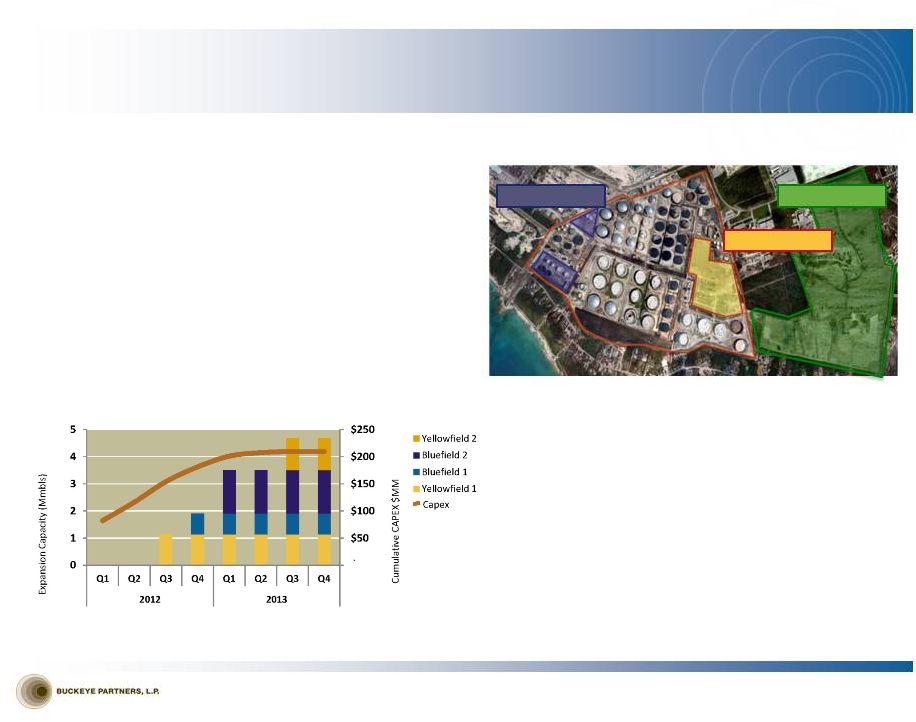 BORCO INTERNAL
GROWTH PROJECTS EXPANSION AND OTHER GROWTH OPPORTUNITIES
Significant Land Available for Expansion
•
Expansion project at BORCO well underway
Phase 1 to add approximately 3.5 million barrels of storage
capacity
1.1 million barrels of fuel oil storage in operation as of July
2012
Other Internal Growth Opportunities
•
Strong interest in setting up crude topping unit at BORCO
•
Driver: need for low sulfur fuel oil
•
Strategic alliance could also support GC exports as
shale/Canadian crude floods into GC (export after “minor
processing”)
BORCO is the logical, geographical, optimum spot for a new
“Bunker filling station”
2014 Panama Canal expansion to allow passage of Suezmax
vessels expected to lead to 20-30% increase in traffic, BORCO
location ideal to service the incremental vessels
BORCO
Expansion
Capacity
(1)
–millions
of
barrels
(1)
Graph reflects expected midpoint of capital spend range. Dates represent expected date that
capacity is placed in service. Yellowfield Area
Greenfield Area
Bluefield Area
©
Copyright 2012 Buckeye Partners, L.P.
•
•
•
•
•
•
•
•
•
•
~0.8 million barrels of refined products storage expected to
be in-service early in the fourth quarter of 2012
~1.6 million barrels of refined products storage to be in-
service in first half of 2013
Initiation of Phase 2 expansion of 1.2 million barrels of crude oil
storage expected to be in service Q3 2013
Over 65% of total expansion capacity is already leased
Longer-term opportunity to double storage capacity in Greenfield
Offshore
jetty
(2
berths)
and
inland
dock
construction
completed
and
operations initiated in Q4 2011
Crude Unit
Bunkering
Opportunities
–
Blended
Fuel
Oil
•
• |
 ©
Copyright 2012 Buckeye Partners, L.P.
Buckeye Services |
 BUCKEYE SERVICES
OVERVIEW Buckeye Energy Services (“BES”) markets a wide range of
refined petroleum products and other ancillary products
in areas served by Buckeye’s pipelines and terminals
Strategy for mitigating basis risk included a reduction of
refined product inventories in the Midwest and focusing
on fewer, more strategic locations for transacting
business
Recently reduced costs by right-sizing the infrastructure
for reduced geographic focus
Contributed almost $37 million in revenues to Domestic
Pipelines & Terminals over last 12 months while also
providing valuable insight on demand and pricing
support for our terminalling and storage business
Buckeye Development & Logistics (“BDL”) currently
operates approximately 2,800 miles of pipelines and 1.4
million barrels of storage capacity
BDL is also responsible for identifying and completing
potential acquisitions and organic growth projects for
Buckeye
BDL services offered to customers
Contract operations
Project origination
Asset development
Engineering design
Project management
Buckeye’s Lodi Gas Storage facility is a high performance natural gas storage facility
with approximately 30 Bcf of working gas capacity in Northern California serving the
greater San Francisco Bay Area Revenue is generated through firm storage services and
hub services The
facilities
collectively
have
a
maximum
injection
and
withdrawal
capability
of
approximately
550 million cubic feet
per day (MMcf/day) and
750 MMcf/day, respectively
Lodi’s
facilities
are
designed
to
provide
high
deliverability
natural
gas
storage
service
and
have
a
proven
track
record
of safe and reliable operations
©
Copyright 2012 Buckeye Partners, L.P.
Natural Gas Storage
Energy Services
Development & Logistics
•
•
•
•
•
•
•
•
•
•
•
•
•
•
•
• |
 Financial
Overview ©
Copyright 2012 Buckeye Partners, L.P. |
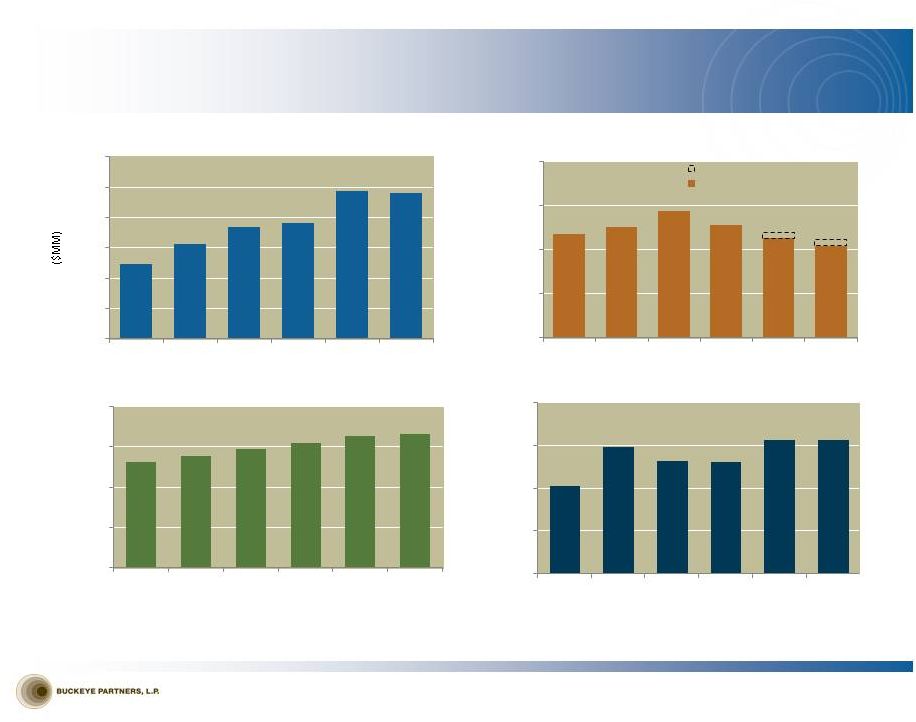 FINANCIAL
PERFORMANCE Adjusted EBITDA ($MM)
(1)(2)
Cash Distributions per Unit
Cash Distribution Coverage
(2)(3)
(1)
LTM as of June 30, 2012
(2)
See Appendix for Non-GAAP Reconciliations
(3)
Distributable cash flow divided by cash distributions declared for the respective periods
(4)
Long-term debt less cash and cash equivalents divided by Adjusted EBITDA
Net LT Debt/Adjusted EBITDA
(1)(4)(6)
(5) Pro forma distribution coverage excludes $17.1 million of acquisition and
integration expenses incurred in 2011 and $16.2 million during the LTM period ended
June 30, 2012 (6) For purposes of calculating the leverage, Adjusted EBITDA is
adjusted for pro forma impacts of acquisitions ©
Copyright 2012 Buckeye Partners, L.P.
$248.5
$313.6
$370.2
$382.6
$487.9
$483.0
$0
$100
$200
$300
$400
$500
$600
2007
2008
2009
2010
2011
LTM
0.95x
1.01x
1.16x
1.03x
0.91x
0.84x
0.00x
0.40x
0.80x
1.20x
1.60x
2007
2008
2009
2010
2011
LTM
Pro forma Distribution Coverage
Declared Distribution Coverage
0.96x
0.89x
$3.275
$3.475
$3.675
$3.875
$4.075
$4.138
$0.00
$1.25
$2.50
$3.75
$5.00
2007
2008
2009
2010
2011
LTM
3.09x
4.44x
3.95x
3.94x
4.69x
4.71x
0.00x
1.50x
3.00x
4.50x
6.00x
2007
2008
2009
2010
2011
LTM
(5)
(5) |
 INVESTMENT
SUMMARY Stability and Growth
©
Copyright 2012 Buckeye Partners, L.P.
•
Proven 26-year track record as a publicly traded partnership through varying economic and
commodity price cycles •
Management
continues
to
drive
operational
excellence
through
its
best
practices
initiative
•
Recent acquisitions provide Buckeye with increased geographic and product diversity, including
access to international logistics opportunities, and provide significant near-term
growth projects •
July 2012 acquisition of marine terminal facility in Perth Amboy, NJ from Chevron furthers
Buckeye’s strategy to create a fully integrated and flexible system that offers
unparalleled connectivity and service capabilities; provides significant near-term
growth opportunities at attractive multiple •
World-class
BORCO
marine
storage
terminal
with
22.5
million
barrels
of
storage
capacity
for
crude
oil
and
liquid
petroleum products in Freeport, Bahamas with approved expansion project of 4.7 million
barrels, including 1.1 million barrels operational in July 2012; serves as important
logistics hub for international petroleum product flows
•
Diversified portfolio of assets provides balanced mix of stability and growth and is well
positioned to take advantage of changing supply and demand fundamentals for crude and
refined petroleum products to drive improved returns to unitholders
|
 Non-GAAP
Reconciliations ©
Copyright 2012 Buckeye Partners, L.P. |
 BASIS OF
REPRESENTATION; EXPLANATION OF NON-GAAP MEASURES ©
Copyright 2012 Buckeye Partners, L.P.
Buckeye’s equity-funded merger with Buckeye GP Holdings, L.P. (“BGH”) in
the fourth quarter of 2010 has been treated as a reverse merger for accounting
purposes. As a result, the historical results presented herein for periods prior to the
completion of the merger are those of BGH, and the diluted weighted average number of
LP units outstanding increase from 20.0 million in the fourth quarter of 2009 to 44.3 million in the fourth quarter of 2010. Additionally,
Buckeye incurred a non-cash charge to compensation expense of $21.1 million in the fourth
quarter of 2010 as a result of a distribution of LP units owned by BGH GP Holdings, LLC
to certain officers of Buckeye, which triggered a revaluation of an equity incentive plan that had been instituted in 2007.
Adjusted EBITDA and distributable cash flow are measures not defined by GAAP. Adjusted EBITDA
is the primary measure used by our senior management, including our Chief Executive
Officer, to (i) evaluate our consolidated operating performance and the operating performance of our business segments, (ii)
allocate resources and capital to business segments, (iii) evaluate the viability of proposed
projects, and (iv) determine overall rates of return on alternative investment
opportunities. Distributable cash flow is another measure used by our senior management to provide a clearer picture of Buckeye’s cash available
for distribution to its unitholders. Adjusted EBITDA and distributable cash flow eliminate (i)
non-cash expenses, including, but not limited, to depreciation and amortization
expense resulting from the significant capital investments we make in our businesses and from intangible assets recognized in business
combinations, (ii) charges for obligations expected to be settled with the issuance of equity
instruments, and (iii) items that are not indicative of our core operating performance
results and business outlook. Buckeye believes that investors benefit from having access to the same financial measures used
by senior management and that these measures are useful to investors because they aid
in comparing Buckeye’s operating performance with that of other companies with similar operations. The Adjusted EBITDA and
distributable cash flow data presented by Buckeye may not be comparable to similarly titled
measures at other companies because these items may be defined differently by other
companies. Please see the attached reconciliations of each of Adjusted EBITDA and distributable cash flow to net income.
This presentation references forward-looking estimates of Adjusted EBITDA and investment
multiples projected to be generated by the Perth Amboy terminal. A reconciliation of
estimated Adjusted EBITDA to GAAP net income is not provided because GAAP net income generated by the Perth Amboy terminal for the
applicable periods is not accessible. Buckeye has not yet completed the necessary
valuation of the various assets to be acquired, a determination of the useful lives of
these assets for accounting purposes, or an allocation of the purchase price among the various types of assets. In addition, interest and debt expense is
a corporate-level expense that is not allocated among Buckeye’s segments and could
not be allocated to the Perth Amboy terminal operations without unreasonable effort.
Accordingly, the amount of depreciation and amortization and interest and debt expense that will be included in the additional net
income generated as a result of the acquisition of the Perth Amboy terminal is not accessible
or estimable at this time. The amount of such additional resulting depreciation and
amortization and applicable interest and debt expense could be significant, such that the amount of additional net income would vary
substantially from the amount of projected Adjusted EBITDA.
|
 NON-GAAP
RECONCILIATIONS Net Income to Adjusted EBITDA ($M)
(1)
LTM as of June 30, 2012.
(2)
On November 19, 2010, Buckeye merged with Buckeye GP Holdings L.P.
(3)
In
2010,
Buckeye
revised
its
definition
of
Adjusted
EBITDA
to
exclude
non-cash
unit-based
compensation
expense,
the
2010
non-cash
equity
plan
modification
expense
and
income
attributable
to
noncontrolling
interests
affected
by
the
merger
for
periods
prior
to
our
buy-in
of
our
general
partner.
These
amounts
were
excluded
from
Adjusted
EBITDA
presented
for
2008,
2009
and
2010
in
our
Annual
Report
on
Form
10-K
for
the
year
ended
December 31, 2010, as amended.
Adjusted EBITDA for 2007 has been restated in this presentation to exclude these amounts for
comparison purposes. 2007
2008
2009
2010
2011
LTM
(1)
Net income attributable to BPL
22,921
26,477
49,594
43,080
108,501
56,325
Interest and debt expense
51,721
75,410
75,147
89,169
119,561
118,890
Income tax expense (benefit)
760
801
(343)
(919)
(192)
666
Depreciation and amortization
40,236
50,834
54,699
59,590
119,534
130,889
EBITDA
115,638
153,522
179,097
190,920
347,404
306,770
Net
income
attributable
to
noncontrolling
interests
affected
by
merger
(2)
131,941
153,546
90,381
157,467
-
-
Amortization of unfavorable storage contracts
-
-
-
-
(7,562)
(8,731)
Gain on sale of equity investment
-
-
-
-
(34,727)
(615)
Non-cash deferred lease expense
-
4,598
4,500
4,235
4,122
4,011
Non-cash unit-based compensation expense
968
1,909
4,408
8,960
9,150
12,000
Equity plan modification expense
-
-
-
21,058
-
-
Asset impairment expense
-
-
59,724
-
-
-
Goodwill impairment expense
-
-
-
-
169,560
169,560
Reorganization expense
-
-
32,057
-
-
-
Adjusted EBITDA
(3)
248,547
313,575
370,167
382,640
487,947
482,995
Adjusted Segment EBITDA
Pipelines & Terminals
238,830
253,790
302,164
346,447
361,018
364,614
International Operations
-
-
-
(4,655)
112,996
119,100
Natural Gas Storage
-
41,814
41,950
29,794
4,204
2,708
Energy Services
-
9,443
19,335
5,861
1,797
(14,181)
Development & Logistics
9,717
8,528
6,718
5,193
7,932
10,754
Total Adjusted EBITDA
(3)
248,547
313,575
370,167
382,640
487,947
482,995
©
Copyright 2012 Buckeye Partners, L.P. |
 NON-GAAP
RECONCILIATIONS Net Income to Distributable Cash Flow ($M)
(1)
LTM as of June 30, 2012.
(2)
On November, 19, 2010, Buckeye merged with Buckeye GP Holdings L.P.
(3)
In 2011, Buckeye revised its definition of Distributable Cash Flow to exclude amortization of
deferred financing costs and debt discounts. Distributable Cash Flow for 2007-2010 have been restated to exclude those amounts for
comparison purposes.
(4) Represents
cash
distributions
declared
for
limited
partner
units
(LP
units)
outstanding
as
of
each
respective
period.
2012
amounts
reflect
actual
cash
distributions
paid
on
LP
units
for
the
quarter
ended
March
31,
2012
and
estimated
cash
distributions
to
be
paid
on
LP
units
for
the
quarter
ended
June
30,
2012.
Distributions
with
respect
to
the
Class
B
units
outstanding
on
the
record
date
for
each
quarter
ended
during
2011
and
the
first
quarter
of
2012, and the Class B units outstanding on the record date for the quarter ended June 30, 2012,
are paid in additional Class B units rather than in cash. 2007
2008
2009
2010
2011
LTM
(1)
Net income attributable to BPL
22,921
26,477
49,594
43,080
108,501
56,325
Depreciation and amortization
40,236
50,834
54,699
59,590
119,534
130,889
Net
income
attributable
to
noncontrolling
interests
affected
by
merger
(2)
131,941
153,546
90,381
157,467
-
-
Gain on sale of equity investment
-
-
-
-
(34,727)
(615)
Non-cash deferred lease expense
-
4,598
4,500
4,235
4,122
4,011
Non-cash unit-based compensation expense
968
1,909
4,408
8,960
9,150
12,000
Equity plan modification expense
-
-
-
21,058
-
-
Asset impairment expense
-
-
59,724
-
-
-
Reorganization expense
-
-
32,057
-
-
-
Non-cash senior administrative charge
950
1,900
475
-
-
-
Amortization of unfavorable storage contracts
-
-
-
-
(7,562)
(8,731)
Write-off of deferred financing costs
-
-
-
-
3,331
3,331
Amortization
of
deferred
financing
costs
and
debt
discounts
(3)
1,448
1,737
3,134
4,411
4,289
3,766
Goodwill impairment expense
-
-
-
-
169,560
169,560
Maintenance capital expenditures
(33,803)
(28,936)
(23,496)
(31,244)
(57,467)
(61,576)
Distributable Cash Flow
164,661
212,065
275,476
267,557
318,731
308,960
Distributions
for
Coverage
ratio
(4)
173,689
209,412
237,687
259,315
351,245
366,086
Coverage Ratio
0.95
1.01
1.16
1.03
0.91
0.84
©
Copyright 2012 Buckeye Partners, L.P. |