Attached files
| file | filename |
|---|---|
| 8-K/A - 8-K/A - AMPAL-AMERICAN ISRAEL CORP | zk1211912.htm |
Exhibit 99.2

www.HL.com U.S. 800.788.5300 Europe +44.20.7839.3355 Hong Kong +852.3551.2300 Japan +81.3.4577.6000
Los Angeles • New York • Chicago • San Francisco • Minneapolis • Washington, D.C. • Dallas • Atlanta • London • Paris • Frankfurt • Hong Kong • Tokyo • Beijing
Ampal-American Israel Corporation
Valuation of the MIRO Project
December 2011
LIMITING FACTORS AND OTHER ASSUMPTIONS
The accompanying report (the “Report”) was provided solely for the use of Ampal-American Israel Corporation (the “Recipient”) by Houlihan Lokey Financial Advisors, Inc. (“Houlihan Lokey”) for general corporate planning purposes and is not intended to be relied upon by any other person or entity or used for any other purpose. Use of the Report by any third party is at the sole risk of that party, and access to the Report by any third party does not create privity between Houlihan Lokey and any such party. This statement of Limiting Factors and Other Assumptions is in addition to any other assumptions, qualifications, limitations, conditions or restrictions set forth in the Report. Any undefined terms used in this statement of Limiting Factors and Other Assumptions shall have the meanings set forth in the Report.
The Report was based on financial, economic, market and other conditions, the condition of the “Project,” and the purchasing power of the currency stated in the Report, as they could be reasonably evaluated, as of December 31, 2011 (the “Valuation Date”). Any conclusions contained in the Report were effective only as of the Valuation Date. Unanticipated events and circumstances may occur and actual results may vary from those assumed. The variations may be material and Houlihan Lokey assumed no responsibility for any such variations. Subsequent events that could affect the conclusions set forth in the Report include, without limitation, changes in industry performance or market conditions and changes to the business, financial condition and results of operations of the Project. In addition, Houlihan Lokey relied upon and assumed, without independent verification, that there had been no change in the business, assets, liabilities, financial condition, results of operations, cash flows or prospects of the Project since the respective dates of the most recent information, financial or otherwise, provided to it that would be material to its analyses.
Houlihan Lokey has not undertaken, and is under no obligation, to update, revise, reaffirm or withdraw the Report. Any events occurring after the Valuation Date have not been considered, and Houlihan Lokey has no obligation to update the Report for such events or otherwise comment on or consider such events. In particular, the Report has not been updated to reflect any changes in:
- The likelihood, timing and terms of requisite financing for the Project;
- The potential impact of the Recipient’s current financial situation on the Project, including any liquidation, receivership, bankruptcy and/or similar proceedings in which the Recipient is or may be involved, as well as any arrangements currently contemplated between the Recipient and any of its creditors and/or debenture holders;
- The timing of commencement of construction of the Project;
- Estimated exchange rates;
- Estimated energy prices; or
- Estimated changes, if any, in the cash flow projections for the Project, or any other assumptions underlying such cash flow projections.
The projections contained in the Report may or may not be achieved and differences between projected results and those actually achieved may be material. Houlihan Lokey was advised, and assumed, that such projections were reasonably prepared in good faith on bases reflecting the best currently available estimates and judgments of the future financial results and condition of the Project, as of the Valuation Date, and Houlihan Lokey expressed no views with respect to such projections or the assumptions on which they were based.
The analyses performed by Houlihan Lokey set forth in the Report are not necessarily indicative of actual values or actual future results, which may vary significantly. Houlihan Lokey assumed no responsibility for any such variations. Any valuation is only an approximation, subject to uncertainties and contingencies, all of which are difficult to predict and beyond the control of the firm preparing such valuation and, thus, a valuation is not intended to be, and should not be construed in any respect as, a guarantee of value. The analyses relating to the Project do not purport to reflect the prices at which any equity of the Project may actually be sold. They relate to a theoretical intrinsic value of the Project; they do not relate to, or purport to be, estimates of fair market value or fair value. For various reasons, the price at which any equity of the Project might be sold in a specific transaction between specific parties on a specific date might be significantly different than those set forth in the Report. The issuance of the Report by Houlihan Lokey did not represent an assurance, guarantee or warranty that the Recipient or any of its affiliates would not default on any obligations or enter into any liquidation, receivership, bankruptcy or similar proceedings, nor did Houlihan Lokey make any assurance, guarantee or warranty that any covenants, financial or otherwise, associated with any financing will not be breached or violated in the future.
The scope of the financial analysis contained in the Report was based on discussions with the Recipient (including, without limitation, regarding the methodologies to be utilized), and Houlihan Lokey did not make any representation, express or implied, as to the sufficiency or adequacy of such financial analysis or the scope thereof for any particular purpose. In light of the unique nature of the Project, only a discount cash flow analysis was used in connection with estimating the equity net present value of the Project. Houlihan Lokey was not requested to make, and did not make, any physical inspection or independent appraisal or evaluation of any of the specific assets, properties or liabilities (fixed, contingent, derivative, off-balance-sheet or otherwise) of the Project. Houlihan Lokey relied on the representations made concerning the anticipated cash flows to be generated by the Project, together with the estimated value of certain real property not expected to be used for production purposes, net of payments to be made to creditors, whether in respect of contingent liabilities or otherwise.
Houlihan Lokey (a) relied upon and assumed, without independent verification, the accuracy and completeness of all data, material and other information furnished, or otherwise made available, to Houlihan Lokey, discussed with or reviewed by Houlihan Lokey, or publicly available, and did not assume any responsibility with respect to such data, material and other information (including, without limitation, conformity or non-conformity with generally accepted accounting principles and/or other guidelines established by regulatory or other governing bodies), (b) made no representation or warranty (express or implied) in respect of the accuracy or completeness of such information and (c) relied upon the assurances received by it that there were no facts or circumstances that would make such information inaccurate or misleading.
The information presented in the Report was included solely to assist the Recipient for general corporate planning purposes. The information may contain departures from generally accepted accounting principles and/or other guidelines established by regulatory or other governing bodies. Houlihan Lokey made no representation as to whether the Report complies with any standards, guidelines, rules or procedures prescribed by any valuation association or any other group or organization.
Houlihan Lokey’s work with respect to any information did not constitute an audit, review, compilation, attestation, examination or agreed upon procedures engagement with respect to such information in accordance with standards established by the American Institute of Certified Public Accountants or any other organization, and, accordingly, Houlihan Lokey did not express any audit opinion or any other form of assurance on such information.
Houlihan Lokey is not an expert on, and nothing contained in the Report should be construed as advice with regard to, legal, accounting, regulatory, insurance, environmental, engineering, tax or other specialist matters. Houlihan Lokey assumed that the Project, the Recipient and applicable affiliates of the Recipient have complied with all applicable regulations, codes, ordinances, statutes and laws (including, without limitation, usage, environmental, zoning and similar laws and/or regulations), and that all required licenses, certificates of occupancy, consents or other legislative or administrative authority from any government or private entity or organization have been or can be obtained or renewed for any use on which any conclusions contained in the Report are based and no effort has been made to determine the possible effect, if any, on the Project due to future regulations, codes, ordinances, statutes, laws or other requirements.
Any conclusions set forth in the Report were not intended by Houlihan Lokey, and should not be construed, to be investment advice in any manner whatsoever, or a recommendation to buy or sell any assets or securities of relating to the Project.
The Report did not constitute a commitment by Houlihan Lokey or any of its affiliates to underwrite, subscribe for or place any securities, to extend or arrange credit, or to provide any other services. Houlihan Lokey and its affiliates (collectively, the “Houlihan Lokey Group”), engage in providing investment banking, securities trading, financing, and financial advisory services and other commercial and investment banking products and services to a wide range of institutions and individuals. In the ordinary course of business, the Houlihan Lokey Group and certain of its employees, as well as investment funds in which they may have financial interests or with which they may co-invest, may acquire, hold or sell, long or short positions, or trade or otherwise effect transactions, in debt, equity, and other securities and financial instruments (including bank loans and other obligations) of, or investments in, one or more parties or entities relevant to the matters set forth in the Report and their respective affiliates or have other relationships with such parties or entities. With respect to any such securities, financial instruments and/or investments, all rights in respect of such securities, financial instruments and investments, including any voting rights, will be exercised by the holder of the rights, in its sole discretion. In addition, the Houlihan Lokey Group may in the past have had, and may currently or in the future have, financial advisory or other investment banking relationships with various parties or entities, including parties or entities that may have interests with respect to one or more parties or entities relevant to the matters set forth in the Report, from which conflicting interests or duties may arise. Although the Houlihan Lokey Group in the course of such other activities and relationships may acquire information about such parties or entities, or that otherwise may be of interest to a reader of the Report, the Houlihan Lokey Group has no obligation to, and may not be contractually permitted to, disclose such information, or the fact that the Houlihan Lokey Group is in possession of such information, to a reader of the Report.

Table of Contents
Tab
Executive Summary 1
Valuation Analysis 2
2011 vs. 2010 Valuation Comparison A
Cash Flow Analysis B
Appendices
Selected Publicly Traded Brazilian Ethanol Producers A
Support for Discount Rate B
International CAPM C
Limiting Factors and Conditions D
1
Ampal-American Israel
Corporation
Corporation

Executive Summary

Situation Overview
Executive Summary
3

Summary and Scope of Valuation Analysis
Executive Summary
4

Valuation Indications
Executive Summary
5
Comparison of Valuation Indications
Notes:
(1) HL December 2010 analysis based on adjusted management projections, nominal terminal growth rate of 2.0% and discount rate range assumption of 12.0% to 16.0%. HL
December 2011 analysis based on adjusted management projections, real terminal growth rate range of -1.0% to 1.0% and discount rate range assumption of 10.5% to 14.5%.
December 2011 analysis based on adjusted management projections, real terminal growth rate range of -1.0% to 1.0% and discount rate range assumption of 10.5% to 14.5%.
(2) 2015E EBITDA based on management projections.

Valuation Analysis

Valuation Analysis
2011 vs. 2010 Valuation Comparison

Project Financing Assumptions
2011 vs. 2010 Valuation
Comparison
Comparison
8
Estimated Sources and Uses of Project Capital
Notes:
(1) 2010 assumes $223.4 million 10-year Banco Do Brasil term loan (based on amount financed through 2013) with interest rate of 2.69% (represents management‘s approximation of the 5-year LIBOR rate
at the time of the initial disbursement of the proceeds from the facility) and $30.0 million Corporación Andina de Fomento (up to 10-year debt facility) with interest rate of L + 525 bps. LIBOR related to
the CAF debt is based on the forward curve for 6-month LIBOR. 2011 assumes $269.5 million 12-year BNDES term loan with interest rate of 5-year LIBOR + 460bps.
(2) Ampal Investment amount represents the outstanding balance of the Promissory Note plus accrued interest through 12/31/2009, as indicated in the Ampal 10-Q filing for the fiscal period ended
September 30, 2010 (which as per the option exercise agreement entered into between Ampal and Merhav is expected to be converted into a 25% equity interest in the ethanol project).
September 30, 2010 (which as per the option exercise agreement entered into between Ampal and Merhav is expected to be converted into a 25% equity interest in the ethanol project).
(3) Assumes Other Equity Investments to be total equity (per the project cash flow model) minus the Ampal Investment.
(4) Includes capital expenditures, plus financial and operating expenses incurred prior to generation of operating cash flows.

Ethanol Price Assumptions
n Based on discussions with management, we noted that the forecasted prices of ethanol in the 2011 model were not
adjusted for inflation.
adjusted for inflation.
n We understand that the 2011 management projections were based on assumptions about the price of ethanol
pursuant to a formula that selects the highest price among three references: (i) a fixed price established by the
Colombian government; (ii) the export parity price of sugar; and (iii) the export parity price of gasoline.
pursuant to a formula that selects the highest price among three references: (i) a fixed price established by the
Colombian government; (ii) the export parity price of sugar; and (iii) the export parity price of gasoline.
n Based on reviews of Resolution 18 1232 dated July 30, 2008 and Resolution 18 0825 dated May 27, 2009, issued by
the Colombian Ministry of Mines and Energy, we were able to verify that the effective pricing formula for ethanol is
based on the maximum of the three underlying reference ranges mentioned by management (subject to certain
adjustments).
the Colombian Ministry of Mines and Energy, we were able to verify that the effective pricing formula for ethanol is
based on the maximum of the three underlying reference ranges mentioned by management (subject to certain
adjustments).
n The Federación Nacional de Biocombustibles de Colombia website and Resolution 18 2069 dated October 29, 2010
suggest that the spot price to ethanol producers in Colombia as of December 2011 is approximately $1.28 / Liter,
based on exchange rates of approximately 1,900 Colombian pesos / U.S. dollar.
suggest that the spot price to ethanol producers in Colombia as of December 2011 is approximately $1.28 / Liter,
based on exchange rates of approximately 1,900 Colombian pesos / U.S. dollar.
n U.S. gasoline price forecasts obtained from the 2011 Annual Energy Outlook Report published by the EIA show the
price of gasoline rising from $0.83 / Liter in 2011 to $0.94 / Liter in 2025, reflecting a CAGR of 0.8%.
price of gasoline rising from $0.83 / Liter in 2011 to $0.94 / Liter in 2025, reflecting a CAGR of 0.8%.
n We note that management price projections remain below the current spot price throughout the projection period and
flatten out at approximately $0.84 / Liter in the outer years.
flatten out at approximately $0.84 / Liter in the outer years.
n While we have been unable to independently verify the source of management’s assumptions, on the basis of the
analysis described above, we believe that management’s ethanol price forecasts are generally supportable.
analysis described above, we believe that management’s ethanol price forecasts are generally supportable.
2011 vs. 2010 Valuation
Comparison
Comparison
9

Projections Comparison
2011 vs. 2010 Valuation
Comparison
Comparison
10
Input Assumptions
Revenue & Expense Metric

s
|
Total
|
Total
|
|||||||||||||||||||||||||
|
2007 - 2009
|
2010
|
2011
|
2012
|
2013
|
2014
|
2015
|
2016
|
2017
|
2018
|
2019
|
2020
|
2021
|
2022
|
2023
|
2024
|
2025
|
2026
|
2027
|
2020 - 2027
|
2007 - 2027
|
2014 - 2027
|
|||||
|
Ethanol Prices (US$/Ltr) (1)
|
||||||||||||||||||||||||||
|
2010 Model
|
0.73
|
(2)
|
0.95
|
0.78
|
0.78
|
0.70
|
0.72
|
0.73
|
0.76
|
0.78
|
0.81
|
0.84
|
0.87
|
0.90
|
0.93
|
0.96
|
0.99
|
1.02
|
1.05
|
1.09
|
0.98
|
(2) | ||||
|
2011 Model
|
0.73
|
(2)
|
0.95
|
1.15
|
1.00
|
1.00
|
0.82
|
0.81
|
0.80
|
0.80
|
0.80
|
0.80
|
0.82
|
0.82
|
0.84
|
0.84
|
0.84
|
0.84
|
0.84
|
0.84
|
0.84
|
(2) | ||||
|
Difference
|
0.00
|
0.00
|
0.37
|
0.22
|
0.30
|
0.10
|
0.08
|
0.04
|
0.02
|
-0.01
|
-0.04
|
-0.05
|
-0.07
|
-0.08
|
-0.11
|
-0.14
|
-0.18
|
-0.21
|
-0.25
|
-0.14
|
||||||
|
Ethanol Production (000s Ltrs)
|
||||||||||||||||||||||||||
|
2010 Model
|
0
|
0
|
0
|
0
|
0
|
112,800
|
112,800
|
112,800
|
112,800
|
112,800
|
112,800
|
112,800
|
112,800
|
112,800
|
112,800
|
112,800
|
112,800
|
112,800
|
112,800
|
902,400
|
1,579,200
|
1,579,200
|
||||
|
2011 Model
|
0
|
0
|
0
|
0
|
0
|
0
|
108,844
|
112,802
|
112,802
|
112,802
|
112,802
|
112,802
|
112,802
|
112,802
|
112,802
|
112,802
|
112,802
|
112,802
|
112,802
|
902,420
|
1,462,474
|
1,462,474
|
||||
|
Difference
|
0
|
0
|
0
|
0
|
0
|
-112,800
|
-3,956
|
2
|
2
|
2
|
2
|
2
|
2
|
2
|
2
|
2
|
2
|
2
|
2
|
20
|
-116,726
|
-116,726
|
||||
|
Ethanol Revenues (US$ 000s)
|
||||||||||||||||||||||||||
|
2010 Model
|
0
|
0
|
0
|
0
|
0
|
81,109
|
82,732
|
85,589
|
88,528
|
91,551
|
94,658
|
97,854
|
101,139
|
104,517
|
107,989
|
111,559
|
115,228
|
118,999
|
122,875
|
880,160
|
1,404,327
|
1,404,327
|
||||
|
2011 Model
|
0
|
0
|
0
|
0
|
0
|
0
|
99,959
|
103,594
|
103,594
|
103,594
|
103,594
|
103,594
|
103,594
|
103,594
|
103,594
|
103,594
|
103,594
|
103,594
|
103,594
|
828,753
|
1,343,089
|
1,343,089
|
||||
|
Difference
|
0
|
0
|
0
|
0
|
0
|
-81,109
|
17,228
|
18,005
|
15,066
|
12,044
|
8,936
|
5,740
|
2,455
|
-923
|
-4,395
|
-7,965
|
-11,634
|
-15,405
|
-19,281
|
-51,407
|
-61,239
|
-61,239
|
||||
|
Other Revenues (US$ 000s)
|
||||||||||||||||||||||||||
|
2010 Model
|
0
|
0
|
0
|
0
|
0
|
7,395
|
8,759
|
8,759
|
8,759
|
8,759
|
8,759
|
8,759
|
8,759
|
8,759
|
8,759
|
8,759
|
8,759
|
8,759
|
8,759
|
70,069
|
121,257
|
121,257
|
||||
|
2011 Model
|
0
|
0
|
0
|
0
|
0
|
0
|
6,909
|
7,542
|
7,542
|
7,542
|
7,542
|
7,542
|
7,542
|
7,542
|
7,542
|
7,542
|
7,542
|
7,542
|
7,542
|
60,337
|
97,415
|
97,415
|
||||
|
Difference
|
0
|
0
|
0
|
0
|
0
|
-7,395
|
-1,850
|
-1,216
|
-1,216
|
-1,216
|
-1,216
|
-1,216
|
-1,216
|
-1,216
|
-1,216
|
-1,216
|
-1,216
|
-1,216
|
-1,216
|
-9,732
|
-23,842
|
-23,842
|
||||
|
Total Revenues (US$ 000s)
|
||||||||||||||||||||||||||
|
2010 Model
|
0
|
0
|
0
|
0
|
0
|
88,505
|
91,490
|
94,348
|
97,287
|
100,309
|
103,417
|
106,612
|
109,898
|
113,276
|
116,748
|
120,317
|
123,986
|
127,758
|
131,634
|
950,229
|
1,525,584
|
1,525,584
|
||||
|
2011 Model
|
0
|
0
|
0
|
0
|
0
|
0
|
106,868
|
111,136
|
111,136
|
111,136
|
111,136
|
111,136
|
111,136
|
111,136
|
111,136
|
111,136
|
111,136
|
111,136
|
111,136
|
889,090
|
1,440,503
|
1,440,503
|
||||
|
Difference
|
0
|
0
|
0
|
0
|
0
|
-88,505
|
15,378
|
16,788
|
13,849
|
10,827
|
7,719
|
4,524
|
1,238
|
-2,139
|
-5,612
|
-9,181
|
-12,850
|
-16,621
|
-20,497
|
-61,139
|
-85,081
|
-85,081
|
||||
|
% Difference
|
NA
|
NA
|
NA
|
NMF
|
NMF
|
-100.0%
|
16.8%
|
17.8%
|
14.2%
|
10.8%
|
7.5%
|
4.2%
|
1.1%
|
-1.9%
|
-4.8%
|
-7.6%
|
-10.4%
|
-13.0%
|
-15.6%
|
-6.4%
|
-5.6%
|
-5.6%
|
||||
|
Agricultural Costs (US$ 000s)
|
||||||||||||||||||||||||||
|
2010 Model
|
0
|
0
|
0
|
0
|
5,340
|
18,655
|
18,655
|
18,655
|
21,095
|
20,484
|
18,044
|
18,655
|
18,655
|
18,655
|
21,095
|
20,484
|
18,044
|
18,655
|
18,655
|
152,899
|
273,828
|
268,488
|
||||
|
2011 Model
|
0
|
0
|
0
|
0
|
0
|
4,388
|
19,633
|
19,788
|
19,788
|
19,788
|
24,058
|
19,311
|
19,633
|
19,788
|
19,788
|
19,788
|
24,058
|
19,311
|
19,633
|
161,310
|
268,753
|
268,753
|
||||
|
Difference
|
0
|
0
|
0
|
0
|
-5,340
|
-14,267
|
978
|
1,133
|
-1,307
|
-695
|
6,014
|
655
|
978
|
1,133
|
-1,307
|
-695
|
6,014
|
655
|
978
|
8,410
|
-5,074
|
266
|
||||
|
Industrial Costs (US$ 000s)
|
||||||||||||||||||||||||||
|
2010 Model
|
0
|
0
|
0
|
0
|
0
|
4,738
|
4,738
|
4,738
|
4,738
|
4,738
|
4,738
|
4,738
|
4,738
|
4,738
|
4,738
|
4,738
|
4,738
|
4,738
|
4,738
|
37,902
|
66,329
|
66,329
|
||||
|
2011 Model
|
0
|
0
|
0
|
0
|
0
|
0
|
8,330
|
8,543
|
8,543
|
8,543
|
8,543
|
8,543
|
8,543
|
8,543
|
8,543
|
8,543
|
8,543
|
8,543
|
8,543
|
68,343
|
110,844
|
110,844
|
||||
|
Difference
|
0
|
0
|
0
|
0
|
0
|
-4,738
|
3,592
|
3,805
|
3,805
|
3,805
|
3,805
|
3,805
|
3,805
|
3,805
|
3,805
|
3,805
|
3,805
|
3,805
|
3,805
|
30,441
|
44,515
|
44,515
|
||||
|
Land leased payments (US$ 000s)
|
||||||||||||||||||||||||||
|
2010 Model
|
0
|
0
|
0
|
3,161
|
3,104
|
3,052
|
2,958
|
2,859
|
2,755
|
2,653
|
2,539
|
2,447
|
2,392
|
2,305
|
2,193
|
2,091
|
1,973
|
1,857
|
1,765
|
17,022
|
40,102
|
33,837
|
||||
|
2011 Model
|
0
|
0
|
0
|
0
|
2,859
|
2,859
|
2,859
|
2,859
|
4,459
|
4,459
|
4,459
|
4,459
|
4,459
|
4,459
|
4,459
|
4,459
|
4,459
|
4,459
|
4,459
|
16,979
|
41,795
|
38,935
|
||||
|
Difference
|
0
|
0
|
0
|
-3,161
|
-245
|
-192
|
-98
|
1
|
1,705
|
1,806
|
1,920
|
2,013
|
2,068
|
2,154
|
2,266
|
2,368
|
2,487
|
2,602
|
2,694
|
-43
|
1,693
|
5,098
|
||||
|
D&A (US$ 000s)
|
||||||||||||||||||||||||||
|
2010 Model
|
0
|
0
|
1,438
|
7,429
|
9,586
|
15,698
|
15,698
|
15,558
|
16,013
|
16,842
|
15,203
|
15,203
|
14,758
|
12,905
|
12,238
|
12,238
|
12,238
|
12,238
|
12,238
|
104,058
|
217,522
|
199,069
|
||||
|
2011 Model
|
0
|
0
|
0
|
2,139
|
5,882
|
10,695
|
19,651
|
19,651
|
19,366
|
18,867
|
19,945
|
18,163
|
18,163
|
17,164
|
15,417
|
13,171
|
11,820
|
11,820
|
11,820
|
117,537
|
233,733
|
225,712
|
||||
|
Difference
|
0
|
0
|
-1,438
|
-5,290
|
-3,704
|
-5,003
|
3,953
|
4,093
|
3,353
|
2,025
|
4,742
|
2,960
|
3,404
|
4,259
|
3,179
|
933
|
-419
|
-419
|
-419
|
13,479
|
16,211
|
26,643
|
||||
|
Operating profit (US$ 000s)
|
||||||||||||||||||||||||||
|
2010 Model
|
-22,796
|
-3,328
|
-6,942
|
-29,504
|
-34,395
|
43,366
|
46,271
|
49,349
|
49,465
|
52,349
|
59,643
|
62,295
|
66,059
|
71,360
|
73,141
|
77,401
|
83,611
|
86,858
|
90,798
|
611,524
|
815,002
|
911,967
|
||||
|
2011 Model
|
-16,876
|
-5,911
|
-3,329
|
-13,029
|
-16,603
|
-25,695
|
54,056
|
58,045
|
56,724
|
57,398
|
52,051
|
58,580
|
58,258
|
59,101
|
60,848
|
63,094
|
60,176
|
64,923
|
64,601
|
611,567
|
808,397
|
864,145
|
||||
|
Difference
|
5,919
|
-2,583
|
3,614
|
16,475
|
17,792
|
-69,062
|
7,785
|
8,696
|
7,259
|
5,050
|
-7,593
|
-3,715
|
-7,801
|
-12,259
|
-12,293
|
-14,307
|
-23,435
|
-21,935
|
-26,198
|
43
|
-6,604
|
-47,822
|
||||
|
% Difference
|
26.0%
|
-77.6%
|
52.1%
|
-55.8%
|
-51.7%
|
-159.3%
|
16.8%
|
17.6%
|
14.7%
|
9.6%
|
-12.7%
|
-6.0%
|
-11.8%
|
-17.2%
|
-16.8%
|
-18.5%
|
-28.0%
|
-25.3%
|
-28.9%
|
0.0%
|
-0.8%
|
-5.2%
|
|
DRAFT
 |
Notes:
(1) Based on management projections.
|
 |
|
| (2) Represents average ethanol price for the period represented. |

|
Total
|
Total
|
|||||||||||||||||||||||||
|
2007 - 2009
|
2010
|
2011
|
2012
|
2013
|
2014
|
2015
|
2016
|
2017
|
2018
|
2019
|
2020
|
2021
|
2022
|
2023
|
2024
|
2025
|
2026
|
2027
|
2020 - 2027
|
2007 - 2027
|
2014 - 2027
|
|||||
|
Financial expenses (US$ 000s)
|
||||||||||||||||||||||||||
|
2010 Model
|
0
|
0
|
3
|
1,855
|
6,842
|
9,118
|
8,669
|
7,872
|
6,530
|
5,214
|
3,758
|
2,220
|
1,221
|
465
|
23
|
0
|
0
|
0
|
0
|
3,929
|
53,789
|
45,090
|
||||
|
2011 Model
|
0
|
0
|
0
|
972
|
9,264
|
19,336
|
22,261
|
20,951
|
18,332
|
15,713
|
13,095
|
10,476
|
7,857
|
5,238
|
2,619
|
327
|
0
|
0
|
0
|
3,929
|
123,853
|
113,617
|
||||
|
Difference
|
0
|
0
|
-3
|
-882
|
2,422
|
10,218
|
13,592
|
13,079
|
11,802
|
10,500
|
9,336
|
8,256
|
6,636
|
4,773
|
2,596
|
327
|
0
|
0
|
0
|
0
|
70,064
|
68,527
|
||||
|
Taxes (US$ 000s)
|
||||||||||||||||||||||||||
|
2010 Model
|
0
|
0
|
0
|
0
|
0
|
0
|
93
|
261
|
4,523
|
7,069
|
7,499
|
8,592
|
8,986
|
9,547
|
10,340
|
10,602
|
11,238
|
12,167
|
12,650
|
84,123
|
103,569
|
103,569
|
||||
|
2011 Model
|
0
|
0
|
0
|
0
|
0
|
0
|
135
|
369
|
540
|
5,685
|
5,635
|
7,007
|
7,351
|
7,871
|
8,526
|
9,206
|
8,818
|
9,530
|
9,481
|
67,789
|
80,152
|
80,152
|
||||
|
Difference
|
0
|
0
|
0
|
0
|
0
|
0
|
41
|
108
|
-3,984
|
-1,385
|
-1,864
|
-1,585
|
-1,635
|
-1,677
|
-1,815
|
-1,396
|
-2,420
|
-2,638
|
-3,169
|
-16,334
|
-23,417
|
-23,417
|
||||
|
CapEx (US$ 000s)
|
||||||||||||||||||||||||||
|
2010 Model
|
8,500
|
0
|
29,530
|
141,350
|
74,810
|
0
|
0
|
0
|
6,239
|
6,239
|
0
|
0
|
0
|
0
|
6,239
|
6,239
|
0
|
0
|
0
|
12,479
|
279,148
|
24,957
|
||||
|
2011 Model
|
0
|
0
|
0
|
55,557
|
90,466
|
131,762
|
0
|
0
|
0
|
0
|
10,319
|
1,472
|
0
|
0
|
0
|
0
|
10,319
|
1,472
|
0
|
13,264
|
301,368
|
155,345
|
||||
|
Difference
|
-8,500
|
0
|
-29,530
|
-85,793
|
15,656
|
131,762
|
0
|
0
|
-6,239
|
-6,239
|
10,319
|
1,472
|
0
|
0
|
-6,239
|
-6,239
|
10,319
|
1,472
|
0
|
785
|
22,220
|
130,387
|
||||
|
Working Capital (US$ 000s)
|
||||||||||||||||||||||||||
|
2010 Model
|
0
|
0
|
0
|
0
|
439
|
-6,196
|
-245
|
-235
|
-41
|
-299
|
-456
|
-212
|
-270
|
-278
|
-85
|
-344
|
-502
|
-260
|
-319
|
-2,269
|
-9,302
|
-9,741
|
||||
|
2011 Model
|
0
|
0
|
0
|
0
|
0
|
361
|
-7,496
|
-334
|
0
|
0
|
351
|
-390
|
27
|
13
|
0
|
0
|
351
|
-390
|
27
|
-364
|
-7,482
|
-7,482
|
||||
|
Difference
|
0
|
0
|
0
|
0
|
-439
|
6,557
|
-7,251
|
-99
|
41
|
299
|
807
|
-178
|
297
|
290
|
85
|
344
|
853
|
-130
|
345
|
1,905
|
1,821
|
2,260
|
|
DRAFT
|
 |
||

Valuation Analysis
Cash Flow Analysis
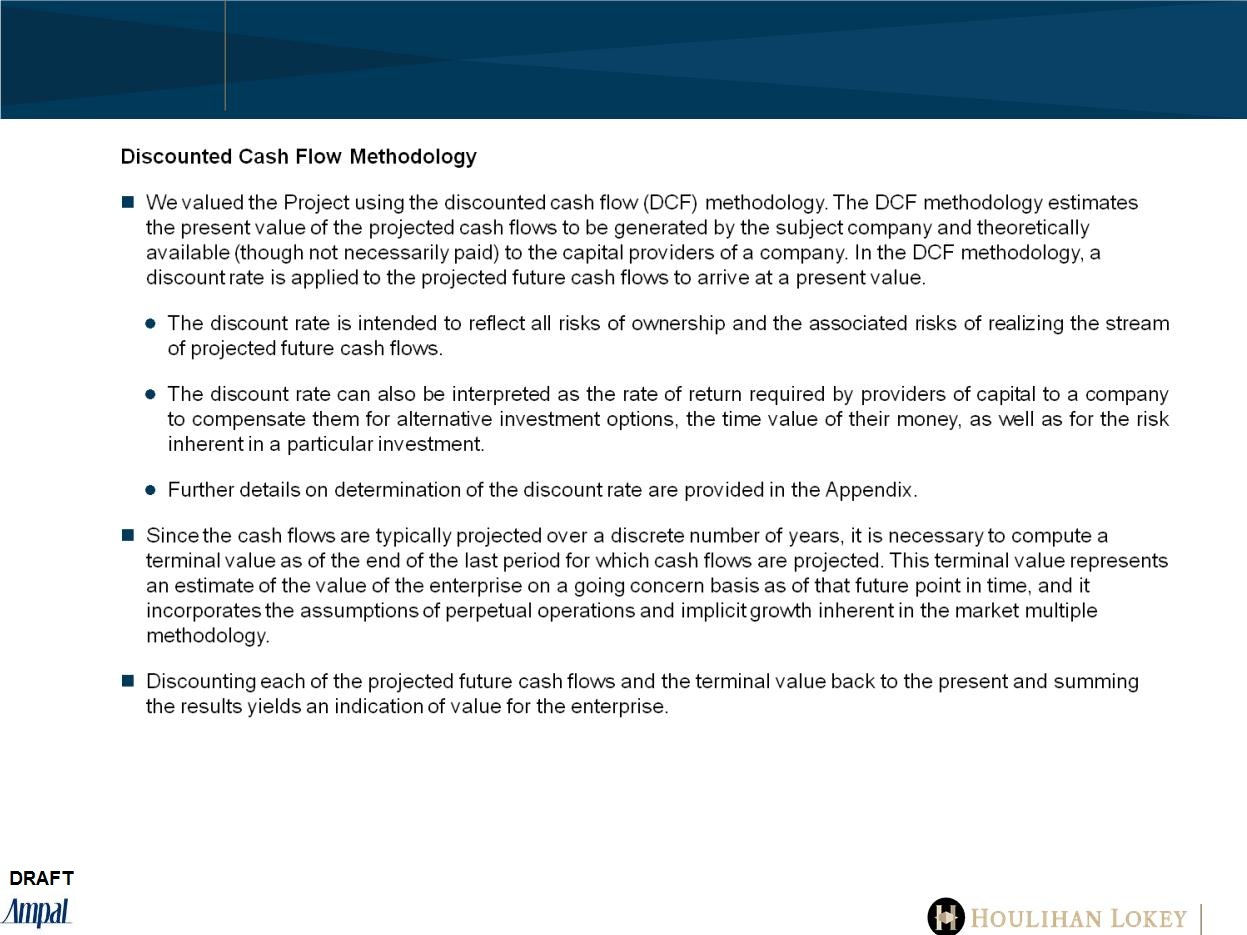
HL Methodology Overview
Cash Flow Analysis
14

HL Methodology Overview (continued)
Cash Flow Analysis
15

|
FYE December 31,
|
||||||||||||||||
|
(Figures in thousands of USD)
|
2012
|
2013
|
2014
|
2015
|
2016
|
2017
|
2018
|
2019
|
2020
|
2021
|
2022
|
2023
|
2024
|
2025
|
2026
|
2027
|
|
Operating Profit (1)
|
-13,029
|
-16,603
|
-25,695
|
54,056
|
58,045
|
56,724
|
57,398
|
52,051
|
58,580
|
58,258
|
59,101
|
60,848
|
63,094
|
60,176
|
64,923
|
64,601
|
|
Non Cash Charges
|
2,139
|
5,882
|
10,695
|
19,651
|
19,651
|
19,366
|
18,867
|
19,945
|
18,163
|
18,163
|
17,164
|
15,417
|
13,171
|
11,820
|
11,820
|
11,820
|
|
EBITDA
|
-10,890
|
-10,721
|
-15,000
|
73,707
|
77,696
|
76,090
|
76,265
|
71,996
|
76,743
|
76,420
|
76,265
|
76,265
|
76,265
|
71,996
|
76,743
|
76,420
|
|
Taxes
|
-
|
-
|
-
|
135
|
3,634
|
8,273
|
8,401
|
7,599
|
8,578
|
8,530
|
8,656
|
8,918
|
9,255
|
8,818
|
9,530
|
9,481
|
|
WC
|
-
|
-
|
361
|
-7,496
|
-334
|
-
|
-
|
351
|
-390
|
27
|
13
|
-
|
-
|
351
|
-390
|
27
|
|
Capex
|
55,557
|
90,466
|
131,762
|
-
|
-
|
-
|
-
|
10,319
|
1,472
|
-
|
-
|
-
|
-
|
10,319
|
1,472
|
-
|
|
Operating Cash Flow
|
-66,447
|
-101,187
|
-146,402
|
66,076
|
73,729
|
67,816
|
67,864
|
54,429
|
66,302
|
67,917
|
67,622
|
67,347
|
67,010
|
53,210
|
65,351
|
66,966
|
|
Plus: BNDES Debt
|
47,083
|
138,987
|
83,429
|
-
|
-
|
-
|
-
|
-
|
-
|
-
|
-
|
-
|
-
|
-
|
-
|
-
|
|
Less: BNDES Paid Interest
|
972
|
9,264
|
19,336
|
22,261
|
20,951
|
18,332
|
15,713
|
13,095
|
10,476
|
7,857
|
5,238
|
2,619
|
327
|
-
|
-
|
-
|
|
Less: BNDES Debt Payments
|
-
|
-
|
-
|
-
|
31,706
|
31,706
|
31,706
|
31,706
|
31,706
|
31,706
|
31,706
|
31,706
|
15,853
|
-
|
-
|
-
|
|
Less: Debt Service Reserve Funding
|
-
|
-
|
-
|
-
|
-
|
25,019
|
25,019
|
25,019
|
-
|
-
|
-27,499
|
-31,706
|
-15,853
|
-
|
-
|
-
|
|
Plus: Debt tax shield
|
-
|
-
|
-
|
-
|
3,264
|
7,734
|
2,716
|
1,964
|
1,571
|
1,179
|
786
|
393
|
49
|
-
|
-
|
-
|
|
Plus: Land Sale
|
-
|
-
|
-
|
-
|
24,000
|
-
|
-
|
-
|
-
|
-
|
-
|
-
|
-
|
-
|
-
|
-
|
|
Less: Excess Cash Flow Escrow
|
-
|
28,537
|
-
|
-
|
-
|
-
|
-
|
-
|
-
|
-
|
-
|
-
|
-
|
-
|
-
|
-
|
|
Plus: Excess Cash Flow Escrow Release
|
-
|
-
|
28,067
|
470
|
-
|
-
|
-
|
-
|
-
|
-
|
-
|
-
|
-
|
-
|
-
|
-
|
|
Cash Flow to Equity Holders
|
-20,336
|
-
|
-54,241
|
44,286
|
48,336
|
493
|
-1,858
|
-13,426
|
25,692
|
29,533
|
58,962
|
65,121
|
66,732
|
53,210
|
65,351
|
66,966
|
|
Discount Period
|
1.0
|
2.0
|
3.0
|
4.0
|
5.0
|
6.0
|
7.0
|
8.0
|
9.0
|
10.0
|
11.0
|
12.0
|
13.0
|
14.0
|
15.0
|
16.0
|
|
Discount Factor at 12.5%
|
0.89
|
0.79
|
0.70
|
0.62
|
0.55
|
0.49
|
0.44
|
0.39
|
0.35
|
0.31
|
0.27
|
0.24
|
0.22
|
0.19
|
0.17
|
0.15
|
|
Present Value ("PV") of Equity Cash Flows
|
-18,077
|
0
|
-38,095
|
27,647
|
26,823
|
243
|
-815
|
-5,233
|
8,901
|
9,095
|
16,140
|
15,845
|
14,433
|
10,230
|
11,168
|
10,172
|
|
NPV of Equity Cash Flows
|
$169,853
|
|
Add: Non-Operating Assets (2)
|
$1,500
|
|
Total Equity NPV of Project
|
$171,353
|
|
Less: 7.5% Equity Allocated to Third-Parties
|
$12,851
|
|
Concluded Equity NPV of Project
|
$158,501
|
|
Terminal Value Assumptions
|
||
|
Gordon Growth Rate (Real Growth)
|
0.0%
|
|
|
Discount Rate
|
12.5%
|
|
|
Terminal Value
|
535,724
|
|
|
Discount Period
|
16.0
|
|
|
Discount Factor
|
0.15
|
|
|
PV of Terminal Value
|
81,377
|
|
DCF Assumptions
|
||
|
Discount Rate
|
12.5%
|
|
|
Distribution of Value
|
||
|
Period Cash Flow
|
52.1%
|
|
|
Terminal Cash Flow
|
47.9%
|
|
|
Project Equity NPV Sensitivity Analysis
|
|||||||
|
Discount Rate
|
|||||||
|
10.5%
|
11.5%
|
12.5%
|
13.5%
|
14.5%
|
|||
|
Terminal Growth Rate
|
-1.0%
|
214,710
|
180,255
|
152,229
|
129,176
|
110,031
|
|
|
-0.5%
|
220,185
|
184,289
|
155,244
|
131,459
|
111,779
|
||
|
0.0%
|
226,182
|
188,674
|
158,501
|
133,911
|
113,647
|
||
|
0.5%
|
232,779
|
193,458
|
162,030
|
136,552
|
115,649
|
||
|
1.0%
|
240,071
|
198,697
|
165,865
|
139,404
|
117,799
|
Footnote:
(1) Assumes current forward exchange rate.
(2) Non-operating assets refer to 500 hectares owned by Agrifuels de Colombia SAS not expected to be used for production purposes.
|
DRAFT
|
 |
||

Appendices

Appendices
Selected Publicly Traded Brazilian Ethanol Producers

Selected Publicly Traded Brazilian Ethanol Producers
n We analyzed publicly traded ethanol producers in Brazil to determine the reasonableness of the Project's assumptions
and value.
and value.
Selected Publicly Traded
Brazilian Ethanol
Producers
Brazilian Ethanol
Producers
19
Analysis of Selected Brazilian Ethanol Producers
Source: Company filings and press releases.
Notes:
(1) Based on 2010/11 harvest.
(2) EV based on equity NPV of $158.5 million plus debt at face value of $269.5 million; EV does not account for the 500 hectares owned by Agrifuels de Colombia SAS not expected to
be used for production purposes valued at approximately $1.5 million. Current production based on 2011 management estimates.
be used for production purposes valued at approximately $1.5 million. Current production based on 2011 management estimates.

Appendices
Support for Discount Rate

Support for Discount Rate
Support for Discount
Rate
Rate
21

Estimated Cost of Equity
Support for Discount
Rate
Rate
22
Estimated Cost of Equity Range
Sensitivity Analysis

Appendices
International CAPM

Methodology
International CAPM
24
n The standard CAPM formula explains that the expected risk premium varies in direct proportion to its beta coefficient. The beta
coefficient on the asset, measures the covariance between the return on the asset and the return on the market portfolio. The
CAPM is shown below:
coefficient on the asset, measures the covariance between the return on the asset and the return on the market portfolio. The
CAPM is shown below:
KE = RF + (β * ERPM)
Where:
n KE = the cost of equity
n RF = the expected return of the risk free asset
n β = the company’s covariance with the market risk
n ERPM = the expected market equity risk premium
n A US-based cost of equity has historically not been viewed as an appropriate model for developed foreign markets since it does
not account for:
not account for:
l foreign exchange risk, or more specifically, unanticipated exchange rate changes. However, the CAPM should not be
adjusted for foreign exchange rate. Instead, the cash flows should be adjusted);
adjusted for foreign exchange rate. Instead, the cash flows should be adjusted);
l deviations from Purchasing Power Parity (“PPP”) and International Fisher Effect (“IFE”) which can persist for
considerable periods of time. (PPP theory describes the linkage between relative inflation rates and exchange rates and
IFE ties interest rate differences to exchange rate expectations);
considerable periods of time. (PPP theory describes the linkage between relative inflation rates and exchange rates and
IFE ties interest rate differences to exchange rate expectations);
l differences in risk-free rates between countries;
l company and country market volatility differentials; and
l company and country leverage differentials.

Methodology (continued)
International CAPM
25
n For companies in countries outside of the U.S., we suggest using an International CAPM, which is the same formula, but with
country specific inputs.
country specific inputs.
KE = RF, C + β W * ERPW
Where:
n KE = the cost of equity
n RF, C = the expected return of the subject country's risk free asset
n βW = the subject company beta based as measured against the world market equity index
n ERPW = the expected global market equity risk premium
n The risk-free rate is derived from government bond rates from the foreign country. To remove the effect inflation, the risk-free rate
is also adjusted for year-over-year growth in the country’s CPI. Betas used reflect the relative risk of the subject company as
compared to the world index.
is also adjusted for year-over-year growth in the country’s CPI. Betas used reflect the relative risk of the subject company as
compared to the world index.
n The US may be used as a proxy for markets that are developed and integrated into world markets since the world market
capitalization is largely made up of the US market. However, we recommend an adjustment to move the U.S. Equity Risk
Premium to a world Equity Risk Premium based on Ibbotson's observed correlation between the U.S. and world markets of 92.0
percent.
capitalization is largely made up of the US market. However, we recommend an adjustment to move the U.S. Equity Risk
Premium to a world Equity Risk Premium based on Ibbotson's observed correlation between the U.S. and world markets of 92.0
percent.

Appendices
Limiting Factors and Conditions

Limiting Conditions
Limiting Factors and
Conditions
Conditions
27
n Our analysis is based on our understanding of the facts and circumstances surrounding the Company as of the Valuation
Date and the Report is written from the perspective of that date.
Date and the Report is written from the perspective of that date.
n We have relied upon and assumed, without independent verification, that the financial forecasts and projections provided to
us have been reasonably prepared and reflect the best currently available estimates f of the future financial results and
conditions of the Company, and that there has been no material change in the assets, financial condition, business or
prospects of the Company since the date of the most recent financial statements made available to us.
n We have not independently verified the accuracy and completeness of the information supplied to us with respect to the
Company and do not assume any responsibility with respect to it. We have not made any physical inspection or independent
appraisal of any of the properties or assets of the Company.
Company and do not assume any responsibility with respect to it. We have not made any physical inspection or independent
appraisal of any of the properties or assets of the Company.
n All valuation methodologies that estimate the worth of an enterprise, or its underlying assets, on a going concern basis are
predicted on numerous assumptions pertaining to prospective economic and operating conditions. Our valuation is
necessarily based on business, economic, market and other conditions as they exist and can be evaluated by us as of the
Valuation Date. Unanticipated events and circumstances may occur and actual results may vary from those assumed. The
variations may be materials.

Limiting Conditions (continued)
Limiting Factors and
Conditions
Conditions
28
n The professional fee for this engagement is not contingent upon the opinions of value set forth herein.
n This Report is based on business, general economic, market and other conditions that could be reasonably evaluated by Houlihan Lokey as
of the Valuation Date. Subsequent events that could affect the conclusions set forth in this Report include adverse changes in industry
performance or market conditions and changes to the business, financial condition and results of operations of the Company. Houlihan
Lokey is under no obligation to update, revise or affirm this report.
n This Report is intended solely for the information of the person or persons to whom it is addressed, solely for the purpose stated, and may
not be relied upon by any other person or for any other purpose without Houlihan Lokey’s prior written consent. The conclusions set forth in
this Report are based on methods and techniques that Houlihan Lokey considers appropriate under the circumstances, and represent the
opinion of Houlihan Lokey based upon information furnished by the Company, its advisors and other publicly available sources. Houlihan
Lokey has relied upon the Company’s representations that the information provided by it, or on its behalf, is accurate and complete in all
material respects. While all public information (including industry and statistical information) was obtained from sources we believe are
reliable, Houlihan Lokey makes no representation as to the accuracy or completeness thereof, and we relied upon such public information
without further verification.
n The opinions set forth in this Report are not intended by Houlihan Lokey, and should not be construed, to be investment advice in any
manner whatsoever. Furthermore, no opinion, counsel or interpretation is intended in matters that require legal, accounting, tax or other
appropriate professional advice. It is assumed that such opinions, counsel or interpretations have been or will be obtained from the
appropriate professional sources.
n Houlihan Lokey assumes that the Company has complied with all applicable federal, state and local regulations and laws, unless the lack of
compliance is specifically noted in this Report.
compliance is specifically noted in this Report.
n Except to the extent specifically disclosed in writing to Houlihan Lokey, and noted herein, this Report also assumes that the Company has
no material contingent assets or liabilities, no unusual obligations or substantial commitments other than those incurred in the ordinary
course of business, and no pending or threatened litigation that would have material effect on the Company
no material contingent assets or liabilities, no unusual obligations or substantial commitments other than those incurred in the ordinary
course of business, and no pending or threatened litigation that would have material effect on the Company