Attached files
| file | filename |
|---|---|
| 8-K - FORM 8-K - PEABODY ENERGY CORP | btu8k20120820.htm |
Exhibit 99.1

Energizing The World One BTU At A Time
West Coast Roadshow Investor Presentation
August 2012
Peabody Energy

Statement on Forward-Looking Information Peabody Energy
Some of the following information contains forward-looking statements within the meaning of Section 27A of the Securities Act of 1933 and Section 21E of the Securities Exchange Act of 1934, as amended, and is intended to come within the safe-harbor protection provided by those sections. Our forward-looking statements are based on numerous assumptions that the company believes are reasonable, but they are open to a wide range of uncertainties and business risks that may cause actual results to differ materially from expectations as of August 20, 2012. These factors are difficult to accurately predict and may be beyond the company's control. The company does not undertake to update its forward-looking statements. Factors that could affect the company's results include, but are not limited to: global supply and demand for coal, including the seaborne thermal and metallurgical coal markets; price volatility, particularly in higher-margin products and in our trading and brokerage businesses; impact of alternative energy sources, including natural gas and renewables; global steel demand and the downstream impact on metallurgical coal prices; impact of weather and natural disasters on demand, production and transportation; reductions and/or deferrals of purchases by major customers and ability to renew sales contracts; credit and performance risks associated with customers, suppliers, contract miners, co-shippers, and trading, banks and other financial counterparties; geologic, equipment, permitting and operational risks related to mining; transportation availability, performance and costs; availability, timing of delivery and costs of key supplies, capital equipment or commodities such as diesel fuel, steel, explosives and tires; integration of Macarthur Coal Limited (PEA-PCI) operations; successful implementation of business strategies; negotiation of labor contracts, employee relations and workforce availability; changes in postretirement benefit and pension obligations and their funding requirements; replacement and development of coal reserves; availability, access to and the related cost of capital and financial markets; effects of changes in interest rates and currency exchange rates (primarily the Australian dollar); effects of acquisitions or divestitures; economic strength and political stability of countries in which we have operations or serve customers; legislation, regulations and court decisions or other government actions, including, but not limited to, new environmental and mine safety requirements and changes in income tax regulations, sales-related royalties or other regulatory taxes; litigation, including claims not yet asserted; and other risks detailed in the company's reports filed with the Securities and Exchange Commission (SEC). The use of “Peabody,” “the company,” and “our” relate to Peabody, its subsidiaries and majority-owned affiliates.
Adjusted EBITDA is defined as income from continuing operations before deducting net interest expense, income taxes, asset retirement obligation expense, depreciation, depletion and amortization and amortization of basis difference associated with equity method investments. Adjusted EBITDA, which is not calculated identically by all companies, is not a substitute for operating income, net income or cash flow as determined in accordance with United States generally accepted accounting principles. Management uses Adjusted EBITDA as a key measure of operating performance and also believes it is a useful indicator of the company's ability to meet debt service and capital expenditure requirements.
Adjusted Income from Continuing Operations and Adjusted Diluted EPS are defined as income from continuing operations and diluted earnings per share excluding the impact of the remeasurement of foreign income tax accounts. Management has included these measures because, in management's opinion, excluding such impact is a better indicator of the company's ongoing effective tax rate and diluted earnings per share, and is therefore more useful in comparing the company's results with prior and future periods.
8/20/12
2
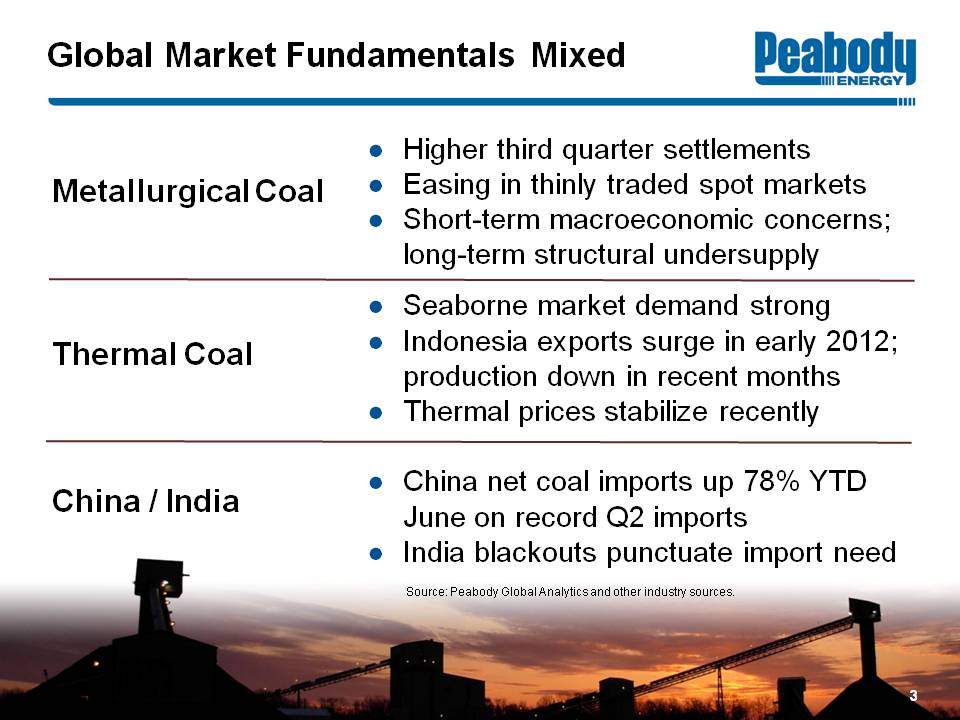
Global Market Fundamentals Mixed
Metallurgical Coal Higher third quarter settlements Easing in thinly traded spot markets Short-term macroeconomic concerns; long-term structural undersupply
Thermal Coal Seaborne market demand strong Indonesia exports surge in early 2012; production down in recent months Thermal prices stabilize recently
China / India China net coal imports up 78% YTD June on record Q2 imports India blackouts punctuate import need
Source: Peabody Global Energy Analytics and other industry sources.
3

U.S. Markets Working Through Challenges Peabody Energy
Natural Gas Rebounded >50% off May 2012 lows; record heat, lower rig count Gas-to-coal switching in PRB
Coal Fundamentals Annualized Q2 output down 104 million tons; June/July stockpile draws ~50% above average Expect 2012 down 100 - 120 million tons
Outlook for U.S. Market Continued reductions in production, particularly from higher-cost East Expect meaningful rebound in 2013 consumption as stockpiles drawn
Source: Peabody Global Analytics and other industry sources.
4

Peabody Reports Solid Results Peabody Energy
Second Quarter 2012 Highlights Revenues of $2.0 billion Adjusted EBITDA of $453 million Adjusted Diluted EPS of $0.73 (includes net tax benefit of $0.22)
Outlook Reduced 2012 planned capex to $1.0 - $1.2 billion 100% priced in U.S. for 2012; 70% - 75% priced for 2013 Q3 Adjusted EBITDA guidance of $350 - $450 million Targeting 2012 volumes of: 185 - 195 million tons from U.S. 31 - 34 million tons from Australia 230 - 250 million tons of total sales
Unpriced position as of June 30, 2012.
5

Positioning Diversified Global Operations for Long-Term Success Peabody Energy
Australia Transitioning to new Burton area in Q3 Converting to owner operator at 2 mines Represents 40% of 2012 Australia production Advancing corrective actions at PCI mines Ramping up Middlemount, Wilpinjong and Millennium production
Leased 1.1 billion tons of PRB reserves Reached long-term agreement with Kinder Morgan on Gulf Coast exports Advancing West Coast export capacity Leading position in low-cost regions
6

Strong Financial Position from Diversified Operations Peabody Energy
Improving Balance Sheet Repurchased $242 million in bonds in Q2 Debt repayment a top priority Target return to historic debt-to-capital ratio No significant near-term maturities Best coal company credit rating
Strong Cash Flow Generation Strong YTD margins 31% Australia, 27% U.S. gross margins Operating cash flow rises 10% YTD to $676 million Cut $200 million of capex in 2012 Continue to evaluate spending in 2012/13 Manageable debt service and maintenance capital
Deleveraging
7

Global Coal Markets

Annual World Coal Demand Expected to Grow ~1.3 Billion Tonnes in Five Years Peabody Energy
Expected Global Coal Demand (Million Tonnes) 0 2,000 4,000 6,000 8,000 10,000
2011 7,600 ROW 3,175 China 3,845 India 600
2012P 7,900 ROW 3,140 China 4,090 India 640
2016P 8,900 ROW 3,290 China 4,795 India 840
Coal-fueled generation expected to grow 390+ GW by 2016
Volume growth expected to exceed last five year increase in global demand
More than 85% of global demand growth in China/India
Rising share supplied by seaborne markets
Source: Peabody Global Analytics.
9

Global Met Coal Use Likely to Increase 25% by 2016 to Track Steel Growth Peabody Energy
Global Steel Production Expected to Grow 25% by 2016
Steel growth would require 250 MTPY of metallurgical coal by 2016
China NDRC treating coking coal as “special and scarce” resource to be managed by government
Global Steel Production Million Tonnes 0 200 400 600 800 1,000 1,200 1,400 1,600 1,800 2,000
2011 2016P ROW China India
Met Coal Consumption
Source: Peabody Global Analytics; China NDRC statements as of April 2012.
10

Global Seaborne Demand: 450 - 500 MTPA Growth Expected by 2016; 8% CAGR Peabody Energy
Pacific Demand Growth 85+% of Total Demand Increase
Million Tonnes 0 200 400 600 800 1000 1200 1400 1600
2011 1,050 Met Thermal
2016P 1,500 - 1,600 Existing Growth 2011 - 2016 Growth
Estimated Growth in Seaborne Imports 2011 - 2016 (Millions Tonnes) China 225 - 275 India 75 - 125 Atlantic 45 - 55 Other Pacific 50 - 60 Taiwan 5 - 15 South Korea 20 - 30 Japan 15 - 25
Source: Peabody Global Analytics.
11

China Coal Imports Expected to Double by 2016 Peabody Energy
Raising 2016 Projected Coal Imports to 400 - 450 Million Tonnes
2011 coal imports rise 20% to record 223 million tonnes
Net coal imports up 78% YTD 2012 Met coal imports up 62% YTD
Imports expected to be 400 - 450 million tonnes per year by 2016
China Gross Coal Imports Tonnes in Million 0 50 100 150 200 250 300 350 400 450 500
2008 37 Met 3 Thermal 34 2009 125 Met 35 Thermal 90 2010 186 Met 47 Thermal 139 2011 223 Met 45 Thermal 178 2012P 285 Met 60 Thermal 225 2016P 400 - 450 Met 100 - 100 Thermal 300 - 350
Source: Peabody Global Analytics, China National Bureau of Statistics. 2008, 2009 imports exclude 'other lignite' product that is now reported in total import figures. YTD stats through June 2012.
12

India's New Generation Built for Coal Imports Peabody Energy
~120 GW Current Coal Capacity
Coal Port Coal Plants Under Construction
Capacity Unit: GW >10 GW 5-10 GW 1-5GW <1 GW
Majority of 70 GW of new coal plants built along coastal regions
Recent blackouts highlight need for more coal and generation
Multiple new port projects under way to enable increased imports
Source: Platts' Industry reports.
13

India Likely to be World's Fastest Growing Coal Importer Peabody Energy
June YTD 2012 coal-fueled generation up 11%; Thermal imports +13%
Thermal demand expected to outpace production by >150 MTPY within five years
70 GW of new coal generation expected to start over five years; Requires additional ~250 MTPY of thermal coal use over time
Infrastructure in 12th Five-Year Plan doubles prior plan to $1 trillion in investments
India Coal Imports Tonnes in Millions 0 50 100 150 200
2009 74 Met 31 Thermal 43 2010 100 Met 37 Thermal 63 2011 115 Met 30 Thermal 85 2012P 130 Met 30 Thermal 100 2016P 200 - 220 Met 50 - 60 Thermal 150 - 160
Source: Peabody Global Analytics and other industry sources.
14

U.S. Coal: PRB and Illinois Basin to Gain from Rising Gas Prices, Exports Peabody Energy
Near Term: Expected use down 100 - 120 million tons in 2012 June/July stockpile declines ~50% higher than average Q2 shipments down an annualized 104 million tons versus 2011 Coal use rebounding as gas prices rise
Long Term: PRB, ILB to gain as CAPP declines Plant retirement effects likely less than many project U.S. exports could grow to 150 - 170 million tons by 2017
Source: Peabody Global Analytics and other industry sources.
15

Rising Gas Prices to Benefit PRB First Peabody Energy
Natural Gas Prices Favorable for PRB and ILB
U.S. Natural Gas Prices ($/mmBtu)
$1 $2 $3 $4 $5 2011 2012 2013 2014 2015 2016
Futures ILB Competitive PRB Competitive
PRB to benefit as gas prices move above $2.50 - $2.75/mmBtu
ILB more competitive at $3.25 - $3.50/mmBtu
Eastern coal requires gas prices of $4.50/mmBtu or higher to be competitive
Source: Energy Information Administration, Genscape, EVA, PIRA, Bloomberg, Peabody Global Analytics.
16

U.S. Coal Plant Retirements Largely Offset by New Plants, Capacity Utilization Peabody Energy
GW of Coal Capacity Retired & Million Tons Consumed by Plants Retiring 2011 - 2016
1 GW 3 MT 2 GW 3 MT 3 GW 8 MT 2 GW 5 MT 5 GW 9 MT 10 GW 11 MT 5 GW 5 MT 11 GW 13 MT 1 GW 1 MT
Cumulative Generation Changes Million Tons
New Generation SPRB / ILB 27 Other 11 Total New Gen 38
Retirements SPRB / ILB -22 Other -35 Total Retirements -58
Capacity Utilization & Switching SPRB / ILB 44 Other -43 Total Cap./Switch 1
Total SPRB / ILB 48 Other -67 Total Change -19
Majority of Retirements in Eastern U.S.
Source: Peabody Global Analytics and Ventyx.
17

Significant Demand Shift Towards PRB and Illinois Basin Peabody Energy
PRB advantage Low end of cost curve Primary source for new plants Benefits from basin switching Asian export potential
Illinois Basin Advantage Major source for new plants Benefits from new scrubbers and basin switching Transport advantage to Gulf
CAPP Challenged to compete with natural gas generation and PRB/Illinois Basin
Expected U.S. Production Change 2011 - 2016P (Tons in Millions)
ILB SPRB CO Other CAPP -80 -60 -40 -20 0 20 40
Source: Peabody Global Analytics and industry reports.
18

Coal: the World's Fastest Growing Major Fuel Peabody Energy
Growth 2001 - 2011 0% 10% 20% 30% 40% 50% 60%
Coal 56% Hydro 35% Natural Gas 31% Oil 13% Nuclear 0%
Largest Share of Global Energy Since 1969
Growth to 2035 Million Tonnes of Oil Equivalent 0 1,000 2,000 3,000 4,000 5,000
Coal 2009 2020 2035 Oil N. Gas Nuclear Hydro Other
Coal Expected to Pass Oil by 2035
Source: BP Statistical Review of World Energy 2012; International Energy Agency, World Energy Outlook 2011 'Current Policies' scenario.
19
Peabody's Global Platform: Driving Results

Peabody Continues Global Expansion to Serve High-Growth Regions Peabody Energy
World's Only Global Pure-Play Coal Investment
London Essen New Delhi Urumqi Ulaanbaatar Beijing Singapore Jakarta Balikpapan NCIG St. Louis DTA
International Offices Brisbane Newcastle London Ulaanbaatar Essen New Delhi Beijing Urumqi Singapore Jakarta Balikpapan
Mining Operations Position Sales Reserves
S. PRB #1 148 2.7 Midwest #1 30 3.6 Southwest #1 18 1.1 Colorado #1 8 0.2 Australia #5 25 1.2
Mining position and sales based on 2011 reported sales volumes in millions of tons. Reserves based on 2011 10-K filing in billions of tons.
21

Peabody Consistently Delivers Superior Margins Peabody Energy
Peabody's Gross Margins Average Nearly 30% Above NYSE Peers
Gross Margins 2010 33% 25% 2011 32% 25% YTD 2012 29% 23%
Peabody Mining Operations U.S. Peer Average
Peabody's U.S. and Australia margins surpass NYSE coal peers
Leading producer in low-cost regions in the U.S. with high-margin operations in Australia
Peabody Australia results include impact of PEA-PCI since acquisition. U.S. peers include ACI, ANR, CNX, CLD, PCX, WLT, ICO, and MEE in years of operation. YTD 2012 results shown through June 30, 2012.
22
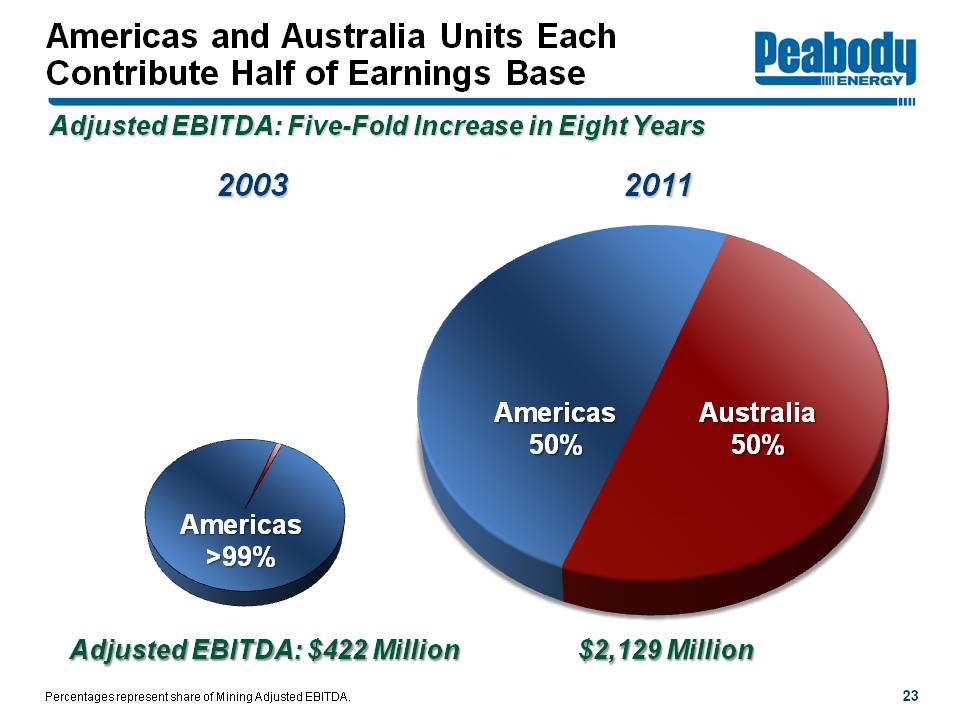
Americas and Australia Units Each Contribute Half of Earnings Base Peabody Energy
Adjusted EBITDA: Five-Fold Increase in Eight Years
2003 Americas >99% 2011 Americas 50% Australia 50%
Adjusted EBITDA: $422 Million $2,129 Million
Percentages represent share of Mining Adjusted EBITDA.
23

Strong U.S. Operating Results Peabody Energy
U.S. Adjusted EBITDA up 17% to $591 million YTD
2012 U.S. shipments target: 185 - 195 million tons
Current-year position fully priced since late 2011
Reducing production by ~ 10 - 20 million tons versus 2011 through customer negotiations, preserving contract NPV
Flexible contracting approach accommodates market view and mine optionality
70% - 75% priced for 2013 based on 2012 production levels
Sourcing flexibility incorporated into contracts to optimize high-margin operations
Unpriced position as of June 30, 2012.
24

Peabody U.S. Export Opportunities Peabody Energy
Peabody exporting PRB, Illinois basin and Colorado coals through Canada, Gulf and East coasts
Recently secured a long-term agreement with Kinder Morgan for coal exports through the Gulf coast Increases Peabody's Gulf Coast export capacity to ~ 5 -7 million tons of coal per year between 2014 and 2020
U.S. exports of ~6 million tons in 2011; Targeting 10 million tons for 2012
Export initiatives: Gateway Pacific Terminal in Washington; 24 MTPY initial throughput Additional avenues to export PRB coal to Asia
Site of Planned Gateway Pacific Terminal
25

Australia Platform Expanding Through Acquisition and Organic Growth Peabody Energy
PEA Met PEA Thermal Port PCI Mine
Queensland Burton North Goonyella Eaglefield Coppabella Moorvale Millennium Middlemount Abbot Point Dalrymple Bay Gladstone Brisbane
New South Wales Wambo Underground Wilpinjong Wambo Open Cut Metropolitan PWCS NCIG Port Kembla
Expected Australia Volumes Tons in Millions 0 10 20 30 40 50
2005 2.5 5.8 8.3 2011 5.9 10.1 9.3 25.3 2012P 7 - 8 11 - 12 13 - 14 31 - 34 2015 - 17P ~8 15 - 17 22 - 25 45 - 50
Domestic Thermal Seaborne Thermal Met
PCI refers to legacy Macarthur Coal mines. 2015 - 17 target includes Middlemount equity tonnages.
26

Australia Organic Pipeline To Deliver Growth in 2012 and Beyond Peabody Energy
Wilpinjong expansion complete
Millennium expansion near completion
Burton extension Moving to new mining area
Middlemount ramping up Permit approval obtained in July
Metropolitan expansion Rescheduled for 2014 - 2015 at higher volumes
Re-evaluating Codrilla and Wambo Open-Cut
Low Sustaining Capital Allows both Growth and Deleveraging
27

Acquisition Significantly Strengthens Bowen Basin Position Peabody Energy
Peabody Energy Australia Bowen Basin Positioning Before Acquisition
Existing Mines: North Goonyella Eaglefield Burton Millennium
North Goonyella Mine Eaglefield Mine Denham Burton Mine Coppabella Nebo Millenium Mine Saraji Norwich Park Middlemount Sarina Carmila St. Lawrence Marlborough
100km
28

Acquisition Significantly Strengthens Bowen Basin Position Peabody Energy
New Bowen Basin Portfolio
New Mines: Coppabella Moorvale Middlemount
Resources: Addition of significant metallurgical and LV PCI potential in high-demand Bowen Basin
Cautionary Note to U.S. Investors - The United States Securities and Exchange Commission permits U.S. mining companies, in their filings with the SEC, to disclose only those mineral deposits that a company can economically and legally extract or produce. We use certain terms here, such as “resources,” which the SEC guidelines generally prohibit U.S. registered companies from including in their filings with the SEC. U.S. Investors are urged to consider closely the disclosure in our Form 10-K which may be accessed from the SEC website at http://www.sec.gov/edgar.shtml.
100km
North Burton West Burton North Goonyella Mine Eaglefield Mine Denham Burton Mine West Walker Cooper Creek Nebo Coppabella Mine Coppabella Moorvale West Moorvale Mine Millenium Mine Olive Downs North Olive Downs South Yeerun Codrilla Codrilla South Amaroo Vermont East Willunga Middlemount Mine Saraji Norwich Park Middlemount Sarina Carmila St. Lawrence Marlborough
29
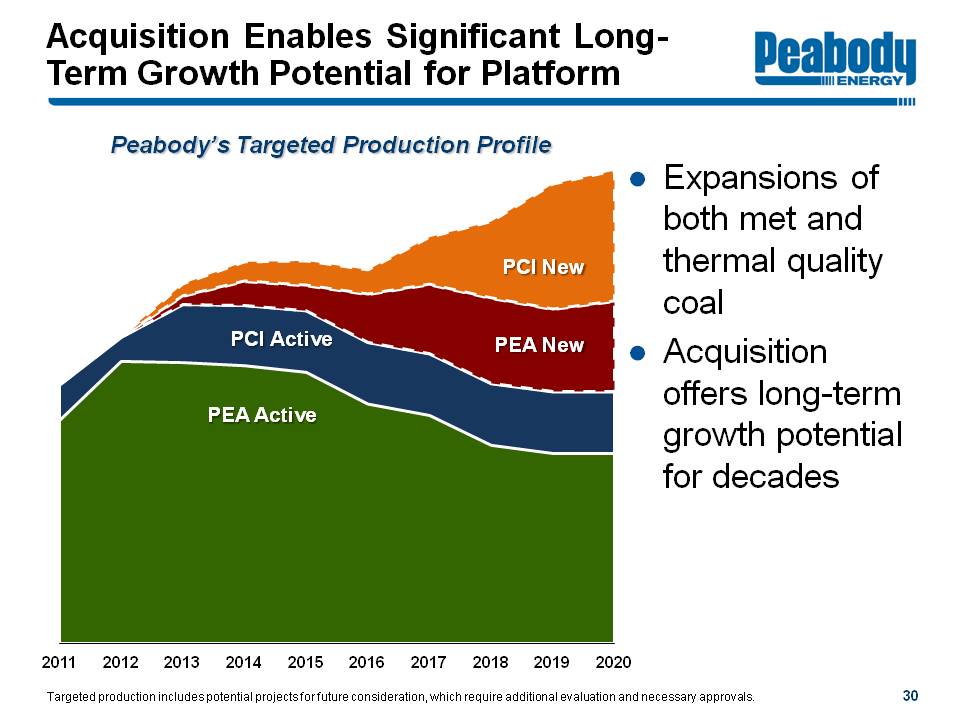
Acquisition Enables Significant Long-Term Growth Potential for Platform Peabody Energy
Peabody's Targeted Production Profile
PCI New PEA New PCI Active PEA Active
2011 2012 2013 2014 2015 2016 2017 2018 2019 2020
Expansions of both met and thermal quality coal
Acquisition offers long-term growth potential for decades
Targeted production includes potential projects for future consideration, which require additional evaluation and necessary approvals.
30

Australia: Conversion to Owner Operator on Target at Millennium and Wilpinjong Peabody Energy
Moving ~40% of Australia Production to Owner-Operator
15% - 20% cost improvement by avoiding contractor margins and using 'right-sized' equipment, mitigating other pressures
Increased control over all aspects of mining
Sharing best practices from other Peabody operations
Once complete, ~75% of Australian production to be owner operated
Evaluation under way for other operations
31
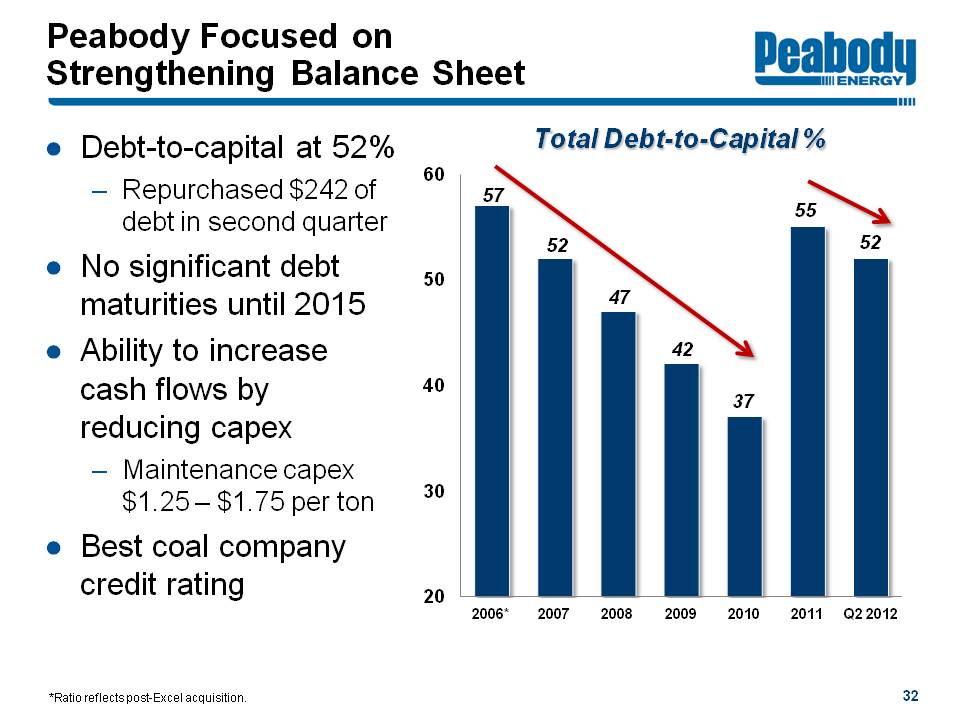
Peabody Focused on Strengthening Balance Sheet Peabody Energy
Debt-to-capital at 52% Repurchased $242 of debt in second quarter
No significant debt maturities until 2015
Ability to increase cash flows by reducing capex Maintenance capex $1.25 - $1.75 per ton
Best coal company credit rating
Total Debt-to-Capital % 20 30 40 50 60
2006* 57 2007 52 2008 47 2009 42 2010 37 2011 55 Q2 2012 52
*Ratio reflects post-Excel acquisition.
32

Peabody: Outstanding Position for Value Creation Peabody Energy
Why Coal?
Rapidly rising seaborne demand Major global buildout of steel and generation High global gas and oil prices
Why Peabody?
Increasing Australian exports Leader in U.S. regions at low end of cost curve Strong financial position
Why Now?
U.S. gas prices coming off lows Beginning to realize benefits of organic growth in Australia BTU a bargain on multiple metrics
33

Energizing The World One BTU At A Time
West Coast Roadshow Investor Presentation
August 2012
Peabody Energy
Appendix: Reconciliation of Non-GAAP Measures Peabody Energy
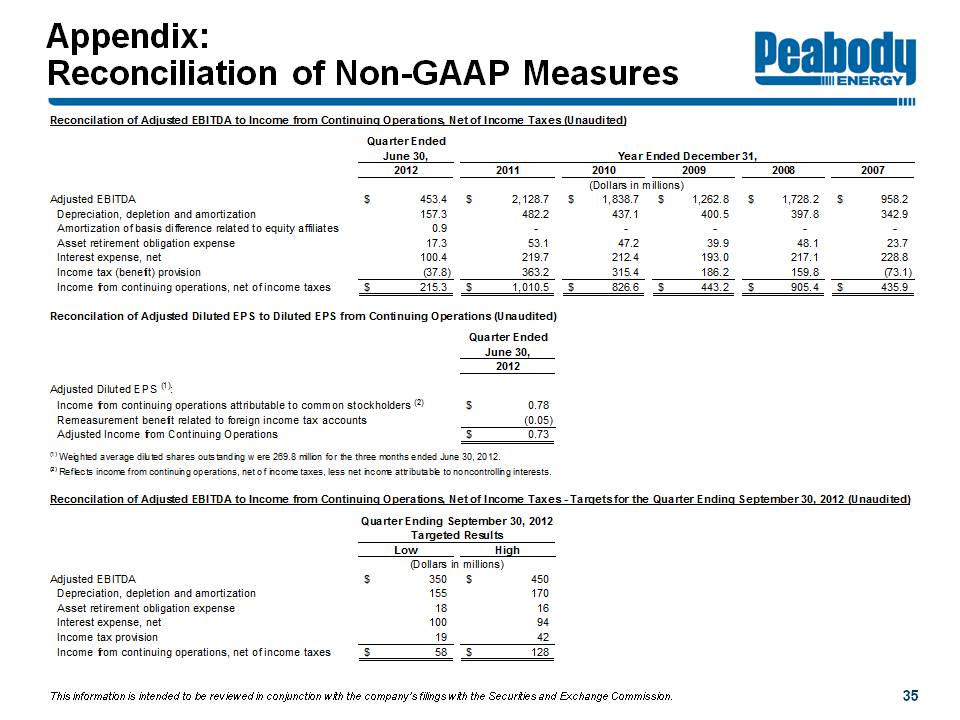
Reconciliation of Adjusted EBITDA to Income from Continuing Operations, Net of Income Taxes (Unaudited)
Quarter Ended June 30, 2012 Year ended December 31, 2011 2010 2009 2008 2007 (Dollars in Millions)
Adjusted EBITDA $453.4 $2,128.7 $1,838.7 $1,262.8 $1,728.2 $958.2
Depreciation, depletion and amortization 157.3 482.2 437.1 400.5 397.8 342.9
Amortization of basis difference related to equity affiliates 0.9 - - - - -
Asset retirement obligation expense 17.3 53.1 47.2 39.9 48.1 23.7
Interest expense, net 100.4 219.7 212.4 193.0 217.1 228.8
Income tax (benefit) provision (37.8) 363.2 315.4 186.2 159.8 (73.1)
Income from continuing operations, net of income taxes $215.3 $1,010.5 $826.6 $443.2 $905.4 $435.9
Reconciliation of Adjusted Diluted EPS to Diluted EPS from Continuing Operations (Unaudited)
Quarter Ended June 30, 2012
Adjusted Diluted EPS (1):
Income from continuing operations attributable to common stockholders (2) $0.78
Remeasurement benefit related to foreign income tax accounts (0.05)
Adjusted Income from Continuing Operations $0.73
(1) Weighted average diluted shares outstanding were 269.8 million for the three months ended June 30, 2012.
(2) Reflects income from continuing operations, net of income taxes, less net income attributable to noncontrolling interests.
Reconciliation of Adjusted EBITDA to Income from Continuing Operations, Net of Income Taxes - Targets for the Quarter Ending September 30, 2012 (Unaudited)
Quarter Ending September 30, 2012 Targeted Results Low High (Dollars in Millions)
Adjusted EBITDA $350 $450
Depreciation, depletion and amortization 155 170
Asset retirement obligation expense 18 16
Interest expense, net 100 94
Income tax (benefit) provision 19 42
Income from continuing operations, net of income taxes $58 $128
This information is intended to be reviewed in conjunction with the company's filings with the Securities and Exchange Commission.
35