Attached files
| file | filename |
|---|---|
| 8-K - FORM 8-K - SVB FINANCIAL GROUP | d396157d8k.htm |
 Corporate
Overview and Second Quarter 2012 Financial Results
Exhibit 99.1 |
 The
presentations made in this document contain projections or other forward- looking
statements regarding management’s expectations about the future events or the future
financial performance of the Company, as well as future economic, market and tax
conditions. Forward-looking statements are
statements that are not historical facts.
We wish to caution you that such
statements are just predictions and actual events or results may
differ materially,
due to changes in economic, business and regulatory factors and trends.
We refer you to the documents the Company files from time to time with the
Securities and Exchange Commission, specifically the Company’s latest Annual
Report on Form 10-K for the year ended December 31, 2011, which was filed on
February 28, 2012, and our latest Quarterly Report on Form 10-Q.
These
documents contain and identify important risk factors that could
cause the
Company’s actual results to differ materially from those contained in our
projections or other forward-looking statements.
All subsequent written or oral
forward-looking statements attributable to the Company or persons acting
on its
behalf are expressly qualified in their entirety by these cautionary statements. All
forward-looking statements included in this presentation are made only as of the
filing date of this document and the Company undertakes no obligation to update
such forward-looking statements.
Safe Harbor Disclosure
2 |
 SVB’s
Unique Model Growth Initiatives
Outlook
Overview
3
Strong Performance |
 Our
Mission: To increase our clients’
probability of success
Build Deep Relationships
Give Advice
Make It Easy To Do Business
With Us
Solve Problems
4 |
 A Unique
Financial Services Company Differentiated business model
•
Focus on “innovation”
markets
•
Balance sheet lender
•
Strong deposit franchise
•
Diversified revenue streams
Leader
•
Leading market share
•
More than 600 venture firm clients
•
The
bank for innovation companies
Established
•
27 U.S. and seven international offices
•
$21.3 billion in total assets
(1)
•
$38.2 billion in total client funds
(1,2)
(1) As of 6/30/12
(2) Total client funds consists of on-balance sheet deposits and off-balance sheet
client investment funds 5 |
 An Expansive
Platform 6 |
 We Serve The
Innovation Economy 7
< 10%
Market Share
<15%
Market Share
~50%
Market Share |
 Across the
Globe 8 |
 Strong Q2 2012
Performance 9
*Total client funds consists of deposits and off-balance sheet client investment
funds. Outstanding
loan growth
Continued deposit
growth
Total client funds
at all-time high *
Higher net interest
income
Gains on VC
investments and
equity warrants
Controlled non-
interest expense
Strong new client
acquisition
Continued high
credit quality
Clients continue to
do well |
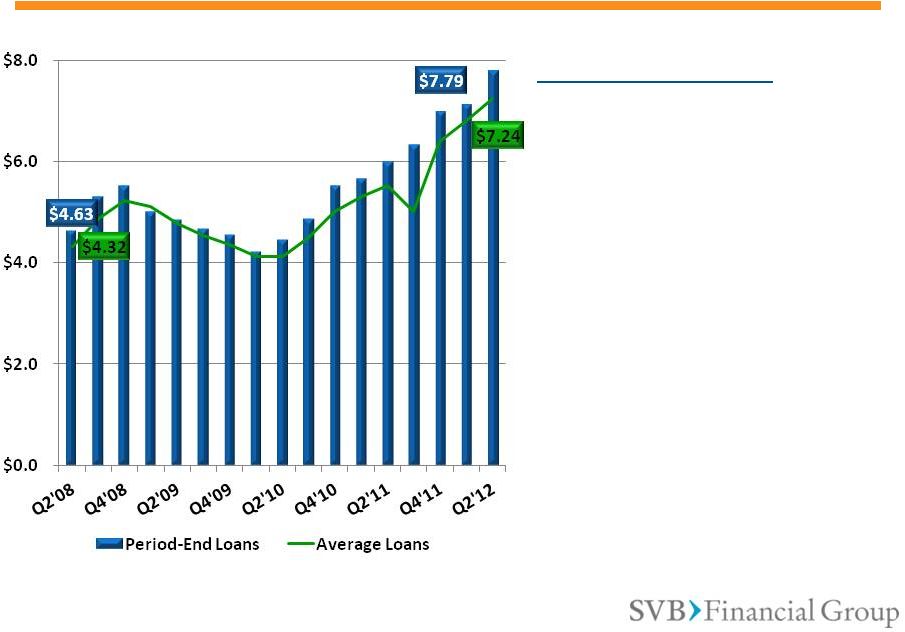 Growth in
Average Loans of 68% Since Q2 2008 Growth Drivers
•
Resilience of innovation
sector and our clients
•
Growing pervasiveness of
technology
•
SVB Growth initiatives:
o
U.S. domestic
o
Segmentation
o
Private Bank
o
Global
•
M&A market activity
10
Billions |
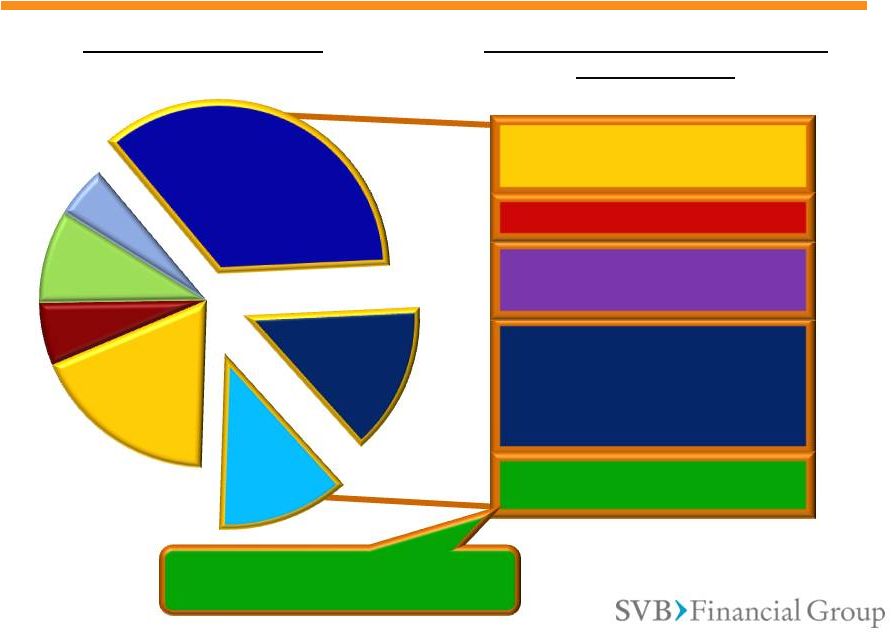 A Diversified
Loan Portfolio Gross Loan Portfolio
$7.9 Billion as of 6/30/12
Technology and Life Sciences
Portfolio Only
$4.9 Billion (62% of Total Portfolio)
Early-Stage Loans = $711 Million
(9% of TOTAL Loan Portfolio)
Note: Cleantech-related loans are reported under
hardware, software, life sciences and other
commercial loan categories, as applicable.
11
Software
35%
Hardware
14%
Life Sciences
12%
VC/PE
18%
Wine
6%
Private Bank
9%
Other
6%
Balance Sheet
Lending
53%
Sponsor-Led Buyout
16%
Commercial Finance
10%
Early Stage 15%
Factoring 6% |
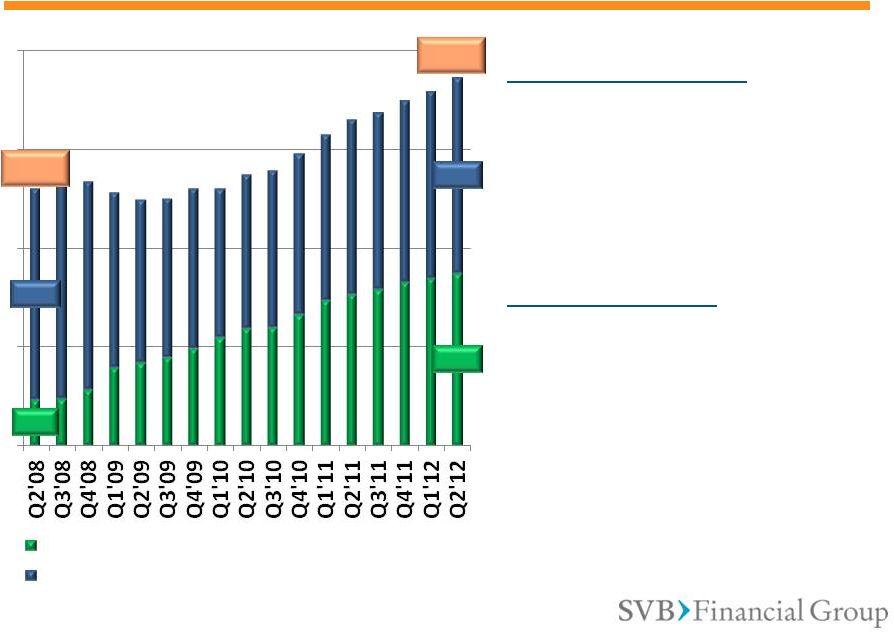 Powerful Client
Funds Franchise Organic Factors
•
Highly liquid clients
•
Clients performing well
•
New client acquisitions
Other Factors
•
Low rate environment
•
Safety of the balance
sheet (unlimited FDIC
insurance*)
* For non-interest-bearing accounts through December 31, 2012.
12
$4.6
$17.4
$21.4
$19.9
$0
$10
$20
$30
$40
Average On-Balance Sheet Deposits
Average Off-Balance Sheet Client Investment Funds
Billions
$37.3
$26.0 |
 Net Interest
Income has Grown 75% since Q2’08 13
$86.8
$151.9
5.62%
3.22%
2.5%
3.0%
3.5%
4.0%
4.5%
5.0%
5.5%
6.0%
6.5%
$85
$95
$105
$115
$125
$135
$145
$155
Net Interest Income
Net Interest Margin
Millions
NIM
All-time high |
 Solid Credit
Quality Through Market Cycles 14
NPLs as % of Total Gross Loans
NCOs as % of Average Total Gross Loans (annualized)
NPLs as % of Total Gross Loans
NCOs as % of Average Total Gross Loans (annualized)
1.57%
3.32%
1%
0%
1%
2%
3%
4%
5%
-
2.28%
0.34%
3.21%
0.59%
1%
0%
1%
2%
3%
4%
5%
-
0.52%
-0.02% |
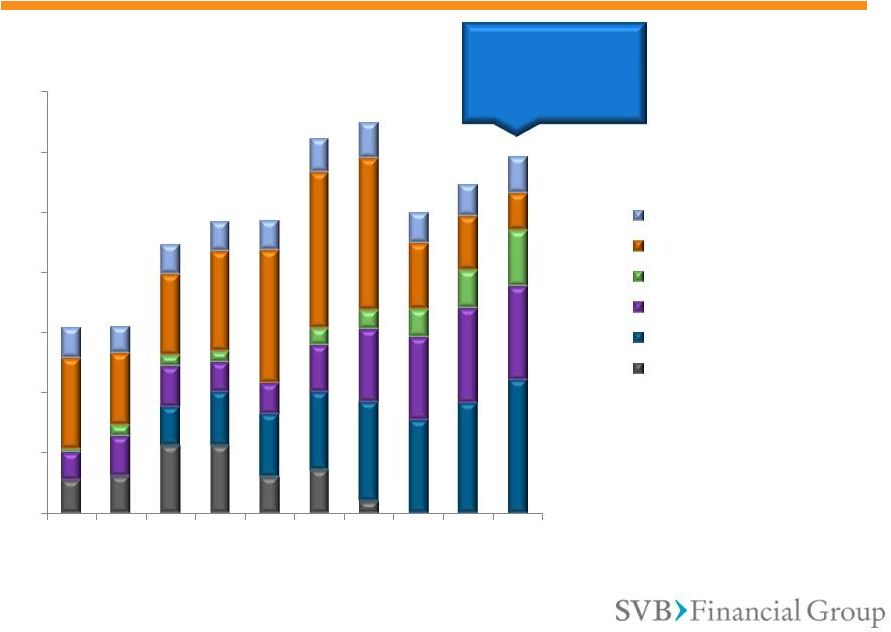
 Growing
“Core” Fee Income
“Core”
is defined as fees from letters of credit, client investments, credit cards, deposit services
and foreign exchange, in aggregate. This is a non-GAAP measure. Please see
non-GAAP reconciliations at end of presentation for more information.
15
Credit Cards and Foreign Exchange Have Driven
the Majority of Recent Growth
Total “Core”
Fee Income
$33.2m
$12.0
$8.4
$6.2
$3.4
$3.3
$0
$5
$10
$15
$20
$25
$30
$35
Millions
Letters of credit/standby
LOC
Client investment fees
Credit card fees
Deposit service charges
Foreign exchange fees |
 16
Diversified Growth Across the Business
GLOBAL PLATFORM
New Global Core Banking
System
IT Backbone Upgrade
Enhanced Global Payment
System
Enhanced On-line/Mobile
Systems
PRODUCT LINES
Expanded Banking Network
New Payment Solutions
New Products & Services
Enhanced Credit
Solutions
CLIENT NEEDS
Client Experience
Corporate Finance Segment
Growth Segment
Private Bank
GLOBAL MARKETS & REACH
Israel
India
China
UK and
Europe
U.S. |
 Outlook for 2012
Performance (1)
Change estimates are for full-year 2012 results relative to 2011 full-year results;
outlook is as of July 26, 2012, and may change. (2)
Full-year 2012 outlook improved from prior period.
(3)
“Core”
is defined as fees from letters of credit, client investments, credit cards, deposit services
and foreign exchange, in aggregate. (4)
Non-GAAP measures. Please see non-GAAP reconciliations at end of presentation and in our
most recent financial releases for more information. Business Driver
2012 Outlook vs. 2011
(1)
Average loans
(2)
High twenties % growth
Average deposits
Low teens % growth
Net interest income
High teens % growth
Net interest margin
Between 3.20% and 3.30%
Allowance for loan losses for total gross
performing loans/total gross performing loans
Comparable to 2011 levels of 1.23%
Net loan charge-offs
(2)
0.30%-0.50% of avg. total gross loans
Non-performing loans/total gross loans
Lower than 2011 levels of 0.52%
“Core”
fee income
(3)(4)
Mid-teens % growth
Non-interest expense (excluding expense
related to non-controlling interests)
(4)
High single digit % growth
17 |
 |
 Appendix
1)
Financial Results
20
•
Highlights
21
•
Loans
23
•
Credit Quality
25
•
Client Liquidity
26
•
Balance Sheet
27
•
Non-interest Income
28
•
Sensitivity Charts
31
•
Capital Ratios
33
2)
Venture Capital Markets
35
3)
Non-GAAP Reconciliations
38 |
 Financial
Results 20
Appendix |
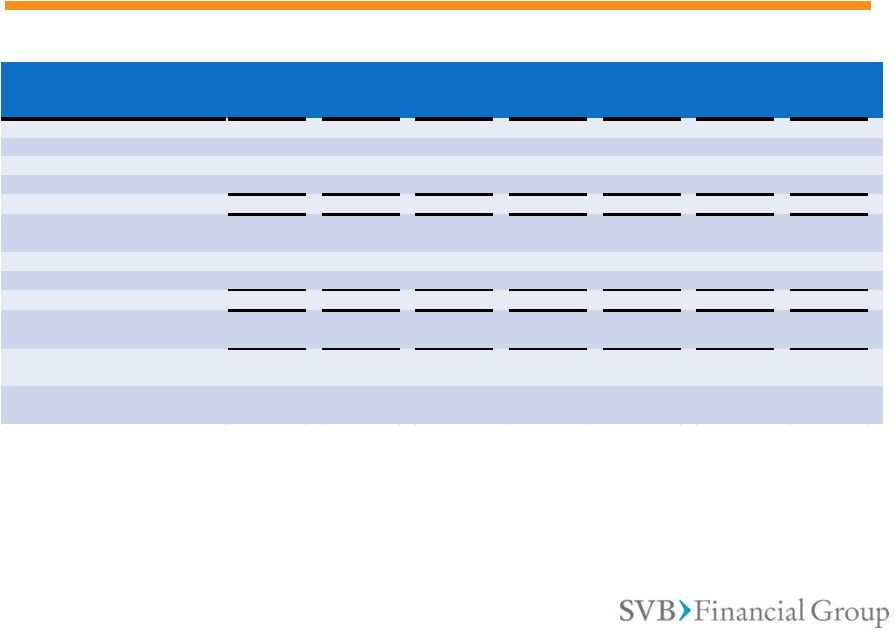
 Quarterly
Highlights: Q2 2011 – Q2 2012
Q2 2011
Q3 2011
Q4 2011
Q1 2012
Q2 2012
Diluted Earnings Per Share
$1.50
(1)(2)
$0.86
$0.81
$0.78
$1.06
(3)
Net Income Available to
Common Stockholders
$65.8M
(1)(2)
$37.6M
$35.6M
$34.8M
$47.6M
(3)
Average Loans
Change
$5.5B
4.2%
$6.0B
8.6%
$6.4B
6.5%
$6.8B
6.4%
$7.2B
6.4%
Average Deposits
Change
$15.3B
4.1%
$15.8B
3.5%
$16.5B
4.5%
$17.0B
2.7%
$17.4B
2.6%
Net Interest Margin
3.13%
3.13%
3.10%
3.30%
3.22%
Net Interest Income
$130.5M
$135.5M
$140.1M
$150.9M
$151.9M
Non-Interest Income
$123.7M
(1)
$95.6M
$73.1M
$59.3M
$80.4M
(3)
Net Charge-Offs (Recoveries)
/Average Total Gross Loans
0.00%
(0.15%)
0.22%
0.21%
0.59%
Non-Interest Expense
$121.0M
(2)
$127.5M
$134.7M
$132.0M
$135.8M
Return on Average Common
SVBFG Stockholders’
Equity
(annualized)
18.78%
(1)(2)
9.93%
8.99%
8.61%
11.21%
(3)
Return on Average Assets
(annualized)
1.44%
(1)(2)
0.79%
0.72%
0.69%
0.92%
(3)
(1)
Includes gains of $0.51/share or $22.5M (net of tax) from sales of AFS securities
(2)
Includes gains of $0.04/share or $1.9M (net of tax) from the early extinguishment of debt and
the termination of corresponding interest rate swaps (3)
Includes gains of $0.12/share or $5.5M (net of tax) from sales of AFS securities and certain
assets related to our equity management services business 21
Appendix –
Financial Results (Highlights) |
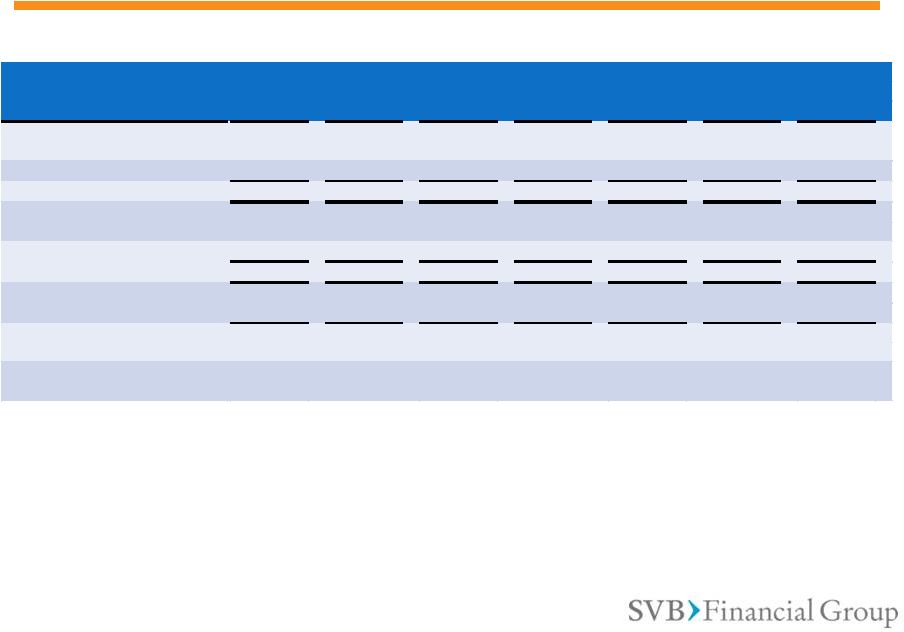
 Annual
Highlights: 2008 -2011 2008
2009
2010
2011
Diluted Earnings Per Share
$2.16
$0.66
$2.24
(3)
$3.94
(1)(2)
Net Income Available to Common
Stockholders
$73.6M
$22.7M
$95.0M
(3)
$171.9M
(1)(2)
Average Loans
Change
$4.6B
31.5%
$4.7B
1.4%
$4.4B
-5.6%
$5.8B
31.1%
Average Deposits
Change
$4.9B
23.6%
$8.8B
79.6%
$12.0B
36.8%
$15.6B
29.4%
Average AFS Securities
$1.3B
$2.3B
$5.3B
$9.4B
Net Interest Margin
5.72%
3.73%
3.08%
3.08%
Net Interest Income
$368.6M
$382.2M
$418.1M
$526.3M
Non-Interest Income
$152.4M
$97.7M
$247.5M
(3)
$382.3M
(1)
Net Charge-Offs (Recoveries)/ Total
Average Gross Loans
0.87%
2.64%
0.77%
(0.02%)
Non-Interest Expense
$312.9M
$343.9M
$422.8M
$500.6M
(2)
Return on Average Common SVBFG
Stockholders’
Equity
10.38%
2.68%
7.72%
(3)
11.87%
(1)(2)
Return on Average Assets
1.00%
0.42%
0.64%
(3)
0.92%
(1)(2)
22
Appendix –
Financial Results (Highlights)
(1)
Includes gains of $0.51/share or $22.5M (net of tax) from sales of AFS securities
(2)
Includes gains of $0.04/share or $1.9M (net of tax) from the early extinguishment of debt and
the termination of corresponding interest rate swaps (3)
Includes gains of $0.35/share or $14.9M (net of tax) from sales of AFS securities
|
 All-Time
High Loan Balance 23
Appendix –
Financial Results (Loans)
$0.00
$1.00
$2.00
$3.00
$4.00
$5.00
$6.00
$7.00
2003
2004
2005
2006
2007
2008
2009
2010
2011
Billions
Period-end Loans, net of unearned income
Average Loans, net of unearned income |
 Loan Portfolio
Evolution Note: Cleantech-related loans are reported under hardware, software, life
science and other commercial loan categories, as applicable. 24
Appendix –
Financial Results (Loans)
Software
40%
Hardware
8%
Life Sciences
6%
Premium Wine
7%
VC/PE
14%
Private Bank
1%
Real Estate
4%
Religious
Lending
8%
Media
2%
Other
10%
Loans at 12/31/2000
$1.7 Billion
(Technology/Life Sciences = 54% or $931 million)
Software
29%
Hardware
21%
Life
Sciences
9%
Premium Wine
12%
VC/PE
13%
Private Bank
10%
Real Estate
1%
Religious
Lending
1%
Media
<1%
Other
4%
Loans at 12/31/2005
$2.8 Billion
(Technology/Life Sciences = 59% or $1.7 Billion) |
 Credit Quality
Has Remained Strong 25
Appendix –
Financial Results (Credit Quality)
As % of
Avg. Total Gross Loans
-0.5%
1.5%
3.5%
5.5%
7.5%
9.5%
$0
$40
$80
$120
Non-Performing Loans
Net Charge-Offs (%)
Millions |
 Strong Client
Liquidity * Total client funds consists of on-balance sheet deposits and
off-balance sheet client investment funds. *
26
Appendix –
Financial Results (Client Liquidity)
$0.0
$5.0
$10.0
$15.0
$20.0
$25.0
$30.0
$35.0
$40.0
$45.0
2002
2003
2004
2005
2006
2007
2008
2009
2010
2011
Q1'12
Q2'12
Period-
End Total Client Funds
Billions
Period-
End Total Assets |
 Assets:
$21.3 Billion
(1)
A Highly Liquid Balance Sheet
(1)
As of 06/30/2012.
(2)
Net of non-controlling interests, non-marketable securities were $460.5 million.
Non-GAAP number. Please see non- GAAP reconciliations at end of presentation and
in our most recent financial releases for more information. Non-Marketable
Securities
(2)
(VC Investments)
$1.1
27
Appendix –
Financial Results (Balance Sheet)
Borrowings
$0.5
Liabilities:
$18.8 Billion
(1)
Net Loans
$7.7
AFS
Securities
(Primarily
Agencies)
$10.6
Cash
$1.4
Other
$0.4
Non-
Interest-
Bearing
Deposits
$12.8
Interest-
Bearing
Deposits
$5.2
Other
Liabilities
$0.3 |
 “Core”
(1)
Fee Income Is Growing
(1)
“Core”
is defined as fees from letters of credit, client investments, credit cards, deposit services
and foreign exchange, in aggregate. This is a non-GAAP measure. Please see non-GAAP
reconciliations at end of presentation for more information.
(2)
Corporate Finance fees were driven by the Company’s investment banking business, which was
sold in 2008. 28
Appendix –
Financial Results (Non-Interest Income)
(2)
Total “Core”
Fee
Income
$118.4M
$43.9
$31.2
$18.7
$12.4
$12.2
$0
$20
$40
$60
$80
$100
$120
$140
2002
2003
2004
2005
2006
2007
2008
2009
2010
2011
Letters of credit/standby LOC
Client investment fees
Credit card fees
Deposit service charges
Foreign exchange fees
Corporate finance fees
Millions |
 (2)
(2)
(2)
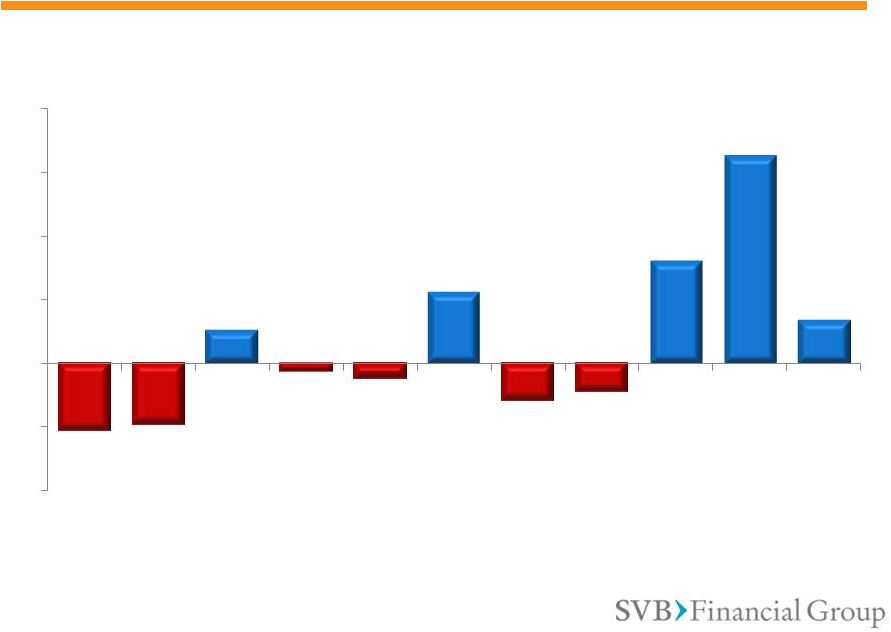
Investment Securities Gains and Losses
29
Appendix –
Financial Results (Non-Interest Income)
(2)
(2)
(2)
-$10.7
-$9.6
$5.2
-$1.4
-$2.5
$11.3
-$5.8
-$4.6
$16.1
$32.7
$6.9
($20)
($10)
$0
$10
$20
$30
$40
2002
2003
2004
2005
2006
2007
2008
2009
2010
2011
YTD
2012
Millions
Gains (losses) on Investment Securities
net
of
NCI
and
gains
on
AFS
(1)
(1) Non-GAAP measures. Please see non-GAAP reconciliations at end of presentation
and in our most recent financial releases for more information.
(2) Numbers are inclusive of non-controlling interests; Gains (losses) attributable to NCI
not reported for these periods. |
 Gains and Losses
on Equity Warrants 30
Appendix –
Financial Results (Non-Interest Income)
-$2.7
$8.2
$2.7
$3.3
$21.8
$23.5
$10.5
-$0.1
$6.6
$37.4
$11.8
($10)
$0
$10
$20
$30
$40
2002
2003
2004
2005
2006
2007
2008
2009
2010
2011
YTD
2012
Millions |
 Rising Rates
Will Benefit Us Significantly * Tax-effected estimates are based on static balance
sheet and assumptions as of 6/30/12 31
Appendix
–
Financial
Results
(Sensitivity)
Changes in
Fed Funds
Rate (basis
points)
Changes in
Net Interest
Income
(tax effected)
Incremental
EPS Effect
Incremental
ROE Effect
Net Interest
Margin
Effect
+75
+22.5 million
$0.51
+1.0%
+0.20%
+100
+$33.5 million
$0.75
+1.4%
+0.29%
+200
+$77.6 million
$1.75
+3.3%
+0.66%
+300
+$121.5 million
$2.74
+5.0%
+1.03%
We expect each 25 bps increase in the Fed Funds rate to contribute
approximately $7 –
$10 million to Net Interest Income* |
 Higher Loan
Balances Will Benefit Us 32
Appendix
–
Financial
Results
(Sensitivity)
Growth in
Overall Loan
Balances
($$)
Changes in
Net Interest
Income (tax
effected)
Incremental
EPS Effect
Incremental
ROE Effect
Net Interest
Margin
Effect
+250 million
+$9.9 million
$0.23
+0.4%
+0.08%
+500 million
+$19.7 million
$0.46
+0.9%
+0.16%
+750 million
+$29.6 million
$0.68
+1.3%
+0.25%
+1 billion
+$39.5 million
$0.91
+1.7%
+0.33%
* Tax-effected estimates are based on static balance sheet and assumptions as of
6/30/12 Each $250 million increase in loan volume contributes
approximately $0.23 to EPS* |
 * TCE/TA and
TCE/RWA are non-GAAP numbers; please refer to Non-GAAP reconciliations at end of presentation and in our most recent financial releases for more information.
We Are Well Capitalized
33
Appendix –
Financial
Results
(Capital
Ratios)
13.85%
12.62%
8.07%
8.06%
13.35%
5%
10%
15%
20%
2007
2008
2009
2010
2011
Q1'12
Q2'12
Holding
Company
Capital
Ratios
Total risk-based capital
Tier 1 risk-based capital
Tier 1 leverage
Tangible common equity to tangible assets *
Tangible common equity to risk
-
weighted assets * |
 We Are Well
Capitalized (2)
34
Appendix
–
Financial
Results
(Capital
Ratios)
(1)
All ratios, except TCE/TA and TCE/RWA are as reported in our most recent Bank Call
Reports. Bank TCE/TA and TCE/RWA ratios are as reported in our most recent financial releases.
(2)
TCE/TA and TCE/RWA are non-GAAP numbers; please refer to non-GAAP reconciliations at end
of presentation and in our most recent financial releases for more information. (2)
12.24%
10.98%
7.01%
7.39%
11.86%
5%
10%
15%
20%
2007
2008
2009
2010
2011
Q1'12
Q2'12
Bank Capital Ratios
Total risk-based capital
Tier 1 risk-based capital
Tier 1 leverage
Tangible common equity to tangible assets
Tangible common equity to risk-weighted assets
(1) |
 Venture Capital
Markets 35
Appendix –
Venture Capital Markets |
 Source:
National Venture Capital Association 36
Appendix –
Venture Capital Markets
Stabilizing VC Markets
U.S. VC Investment
M&A $$
IPOs $$
# IPOs
# M&As
# Investments
$0.0
$10.0
$20.0
$30.0
$40.0
$50.0
Billions
$28.4
$23.0
$9.9
52
429
3,673
0
1,500
3,000
4,500
2007
2008
2009
2010
2011
No. of Transactions |
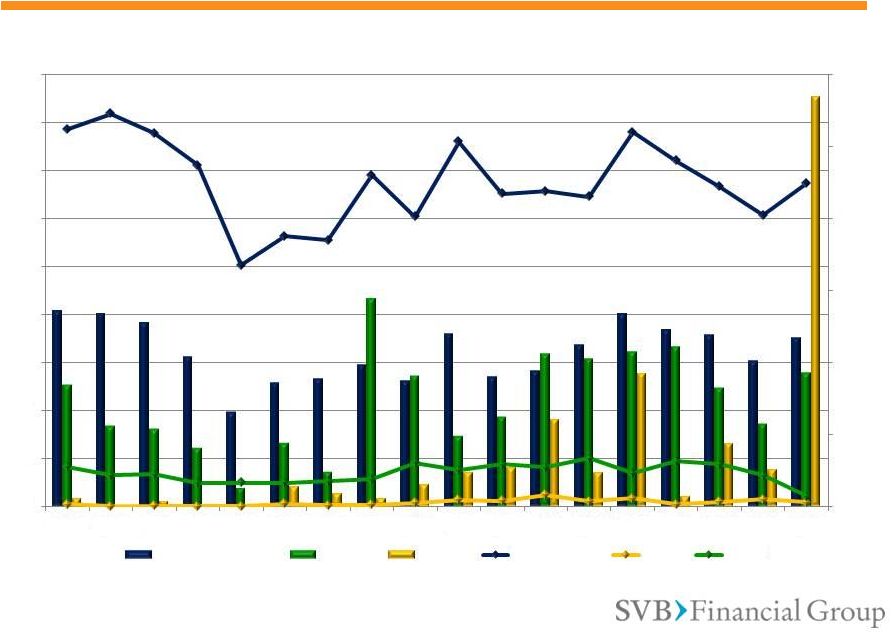 Source:
National Venture Capital Association 37
Appendix –
Venture Capital Markets
Quarterly VC Market Activity
0
200
400
600
800
1,000
1,200
$0.0
$2.0
$4.0
$6.0
$8.0
$10.0
$12.0
$14.0
$16.0
$18.0
Q1'08
Q2'08
Q3'08
Q4'08
Q1'09
Q2'09
Q3'09
Q4'09
Q1'10
Q2'10
Q3'10
Q4'10
Q1'11
Q2'11
Q3'11
Q4'11
Q1'12
Q2'12
Transactions
Billions
U.S. VC Investment
M&A $$
IPOs $$
Investments#
IPOs#
M&A# |
 Non-GAAP
Reconciliations 38
Appendix –
Non-GAAP Reconciliations |
 Non-GAAP
“Core” Fee Income Reconciliation
39
Appendix –
Non-GAAP Reconciliations
June 30,
September 30,
December 31,
March 31,
June 30,
September 30,
December 31,
March 31,
June 30,
2010
2010
2010
2011
2011
2011
2011
2012
2012
GAAP noninterest income
40,157
$
86,236
$
71,864
$
89,954
$
123,708
$
95,611
$
73,059
$
59,293
$
80,426
$
Less: gains (losses) on investment
securities, net
4,805
46,611
25,940
1,337
71,680
52,262
19,755
7,839
25,809
Less: gains (losses) on derivative
instruments, net
1,326
1,257
4,957
551
13,651
9,951
14,528
5,976
8,713
Less: other noninterest income
7,463
11,381
10,735
10,264
10,012
3,108
6,771
13,078
12,664
Non-GAAP core fee income
26,563
$
26,987
$
30,232
$
27,802
$
28,365
$
30,290
$
32,005
$
32,400
$
33,240
$
Non-GAAP core fee income (dollars
in thousands)
Three months ended
June 30,
September 30,
December 31,
March 31,
June 30,
September 30,
December 31,
March 31,
2008
2008
2008
2009
2009
2009
2009
2010
GAAP noninterest income
44,515
$
40,438
$
25,660
$
(5,581)
$
28,275
$
34,307
$
40,742
$
49,273
$
Less: gains (losses) on investment
securities, net
2,039
(876)
(9,828)
(35,045)
(6,750)
3,905
6,681
16,004
Less: gains (losses) on derivative
instruments, net
4,408
5,472
5,026
1,814
(2,847)
(1,090)
1,370
1,982
Less: other noninterest income
5,759
1,913
1,858
2,782
12,799
6,249
8,131
6,063
Non-GAAP core fee income
32,309
$
33,929
$
28,604
$
24,868
$
25,073
$
25,243
$
24,560
$
25,224
$
Non-GAAP core fee income (dollars
in thousands)
Three months ended
For additional non-GAAP disclosures, please refer to our latest Forms 10-Q and 10-K,
as well as our quarterly earnings releases. |
 Non-GAAP
“Core” Fee Income Reconciliation
40
Appendix –
Non-GAAP Reconciliations
For additional non-GAAP disclosures, please refer to our latest Forms 10-Q and 10-K,
as well as our quarterly earnings releases. 2002
2003
2004
2005
2006
2007
2008
2009
2010
2011
GAAP noninterest income
71,426
$
81,393
$
107,774
$
117,495
$
141,206
$
220,969
$
152,365
$
97,743
$
247,530
$
382,332
$
Less: gains (losses) on investment
securities, net
(10,679)
(9,614)
5,198
4,307
2,551
46,724
(14,777)
(31,209)
93,360
195,034
Less: gains (losses) on derivative
instruments, net
11,815
20,200
3,428
6,750
17,949
23,935
18,505
(753)
9,522
38,681
Less: other noninterest income
8,789
9,067
10,959
9,711
23,565
26,096
19,052
29,961
35,642
30,155
Non-GAAP core fee income
61,501
$
61,740
$
88,189
$
96,727
$
97,141
$
124,214
$
129,585
$
99,744
$
109,006
$
118,462
$
Year ended December 31,
Non-GAAP core fee income (dollars
in
thousands) |
 Non-GAAP
Non-Marketable Securities (Net of Non-Controlling Interests)
41
Appendix –
Non-GAAP Reconciliations
For additional non-GAAP disclosures, please refer to our latest Forms 10-Q and 10-K,
as well as our quarterly earnings releases. (Consolidated)
June 30,
2012
GAAP non-marketable securities
1,132,312
$
Less: noncontrolling interests in non-marketable securities
671,813
Non-GAAP non-marketable securities, net of non controlling interests
460,499
$
Non-GAAP non-marketable securities, net of non controlling interests
(dollars in thousands) |
 Non-GAAP
Gains (Losses) on Investment Securities Reconciliation 42
Appendix –
Non-GAAP Reconciliations
For additional non-GAAP disclosures, please refer to our latest Forms 10-Q and 10-K,
as well as our quarterly earnings releases. Six months ended
2005
2006
2007
2008
2009
2010
2011
June 30, 2012
GAAP net gains (losses) on investment securities
4,307
$
2,551
$
46,724
$
(14,777)
$
(31,209)
$
93,360
$
195,034
$
33,648
$
Less: income (losses) attributable to noncontrolling
interests, including carried interest
5,743
5,032
35,449
(8,929)
(26,638)
52,586
125,042
21,840
Net gains (losses) on investment securities, net of
noncontrolling interests
(1,436)
(2,481)
11,275
(5,848)
(4,571)
40,774
69,992
11,808
Less: gains on sales of certain available-for-sale
securities
-
-
-
-
-
24,699
37,341
4,955
Non-GAAP net gains (losses) on investment securities, net
of noncontrolling interests and excluding gains on sales of
certain available-for-sale securities
(1,436)
$
(2,481)
$
11,275
$
(5,848)
$
(4,571)
$
16,075
$
32,651
$
6,853
$
Non-GAAP net gains on investment securities, net of
noncontrolling interests (dollars in thousands)
Year ended December 31, |
 Non-GAAP
TCE/TA and TCE/RWA Reconciliation 43
Appendix –
Non-GAAP Reconciliations
For additional non-GAAP disclosures, please refer to our latest Forms 10-Q and 10-K,
as well as our quarterly earnings releases. (Consolidated)
December 31,
December 31,
December 31,
December 31,
December 31,
March 31,
June 30,
2007
2008
2009
2010
2011
2012
2012
GAAP SVBFG stockholders' equity
676,369
$
991,356
$
1,128,343
$
1,274,350
$
1,569,392
$
1,639,490
$
1,715,360
$
Less: intangible assets
1,632
1,087
665
847
601
559
-
Less: goodwill
4,092
4,092
-
-
-
-
-
Less: preferred stock
-
221,185
-
-
-
-
-
Tangible common equity (TCE)
670,645
$
764,992
$
1,127,678
$
1,273,503
$
1,568,791
$
1,638,931
$
1,715,360
$
GAAP total assets
6,692,171
$
10,018,280
$
12,841,399
$
17,527,761
$
19,968,894
$
20,818,337
$
21,289,772
$
Less: intangible assets
1,632
1,087
665
847
601
559
-
Less: goodwill
4,092
4,092
-
-
-
-
-
Tangible assets (TA)
6,686,447
$
10,013,101
$
12,840,734
$
17,526,914
$
19,968,293
$
20,817,778
$
21,289,772
$
Risk-weighted assets (RWA)
6,524,021
$
8,220,447
$
7,494,498
$
9,406,677
$
11,837,902
$
12,102,502
$
12,850,191
$
Tangible common equity to
tangible assets
10.03
%
7.64
%
8.78
%
7.27
7.86
%
7.87
%
8.06
%
Tangible common equity to
risk-weighted assets
10.28
9.31
15.05
13.54
13.25
13.54
13.35
Tangible common equity, tangible
assets and risk-weighted assets
(dollars in thousands, except ratios)
SVB Financial Group |
 Non-GAAP
TCE/TA and TCE/RWA Reconciliation 44
Appendix –
Non-GAAP Reconciliations
For additional non-GAAP disclosures, please refer to our latest Forms 10-Q and 10-K,
as well as our quarterly earnings releases. (Bank Only)
December 31,
December 31,
December 31,
December 31,
December 31,
March 31,
June 30,
2007
2008
2009
2010
2011
2012
2012
GAAP Silicon Valley Bank
stockholders' equity
586,949
$
695,438
$
914,068
$
1,074,561
$
1,346,854
$
1,403,570
$
1,479,817
$
Less: intangible assets
-
-
-
-
-
-
-
Tangible common equity (TCE)
586,949
$
695,438
$
914,068
$
1,074,561
$
1,346,854
$
1,403,570
$
1,479,817
$
GAAP total assets
6,164,111
$
9,419,440
$
12,186,203
$
16,268,589
$
18,758,813
$
19,596,848
$
20,027,219
$
Less: intangible assets
-
-
-
-
-
-
-
Tangible assets (TA)
6,164,111
$
9,419,440
$
12,186,203
$
16,268,589
$
18,758,813
$
19,596,848
$
20,027,219
$
Risk-weighted assets (RWA)
6,310,721
$
8,109,332
$
7,293,332
$
9,047,907
$
11,467,401
$
11,752,897
$
12,482,417
$
Tangible common equity to
tangible assets
9.52
%
7.38
%
7.50
%
6.61
7.18
%
7.16
%
7.39
%
Tangible common equity to
risk-weighted assets
9.30
8.58
12.53
11.88
11.75
11.94
11.86
Silicon Valley Bank
Tangible common equity, tangible
assets and risk-weighted assets
(dollars in thousands, except ratios) |
 |