Attached files
| file | filename |
|---|---|
| 8-K - 8-K - DEERE & CO | a12-18191_18k.htm |
| EX-99.2 - EX-99.2 - DEERE & CO | a12-18191_1ex99d2.htm |
| EX-99.1 - EX-99.1 - DEERE & CO | a12-18191_1ex99d1.htm |

|
|
| 3rd Quarter 2012 Earnings Conference Call 2 Safe Harbor Statement & Disclosures The earnings call and accompanying material include forward-looking comments and information concerning the company’s plans and projections for the future, including estimates and assumptions with respect to economic, political, technological, weather, market acceptance and other factors that impact our businesses and customers. They also may include financial measures that are not in conformance with accounting principles generally accepted in the United States of America (GAAP). Words such as “forecast,” “projection,” “outlook,” “prospects,” “expected,” “estimated,” “will,” “plan,” “anticipate,” “intend,” “believe,” or other similar words or phrases often identify forward-looking statements. Actual results may differ materially from those projected in these forward-looking statements based on a number of factors and uncertainties. Additional information concerning factors that could cause actual results to differ materially is contained in the company’s most recent Form 8-K and periodic report filed with the U.S. Securities and Exchange Commission, and is incorporated by reference herein. Investors should refer to and consider the incorporated information on risks and uncertainties in addition to the information presented here. Investors should consider non-GAAP financial measures in addition to, and not as a substitute for, financial measures prepared in accordance with GAAP. The company, except as required by law, undertakes no obligation to update or revise its forward-looking statements whether as a result of new developments or otherwise. The call and accompanying materials are not an offer to sell or a solicitation of offers to buy any of the company’s securities. 25 |
|
|
| 3rd Quarter 2012 Earnings Conference Call 3 Third Quarter Overview (in millions of dollars except per share amounts) Q3 2012 Q3 2011 Change Net Sales and Revenues $9,590 $8,372 +15% Net Sales $8,930 $7,722 +16% Net Income Attributable to Deere & Company $788 $712 +11% Diluted EPS $1.98 $1.69 +17% 26 |
|
|
| 3rd Quarter 2012 Earnings Conference Call 4 Third Quarter Overview Net Sales Equipment operations net sales: Up 16% in Q3 2012 vs. Q3 2011 Price realization: +5 points Currency translation: (5) points 27 |
|
|
| 3rd Quarter 2012 Earnings Conference Call 5 Worldwide Agriculture & Turf Third Quarter Overview Incremental Margin ~ 17% *Q3 2012 operating profit impacted by: Price realization Higher shipment volumes Increased production and raw-material costs Unfavorable effects of foreign currency exchange Higher research and development expenses (in millions of dollars) Q3 2012 Q3 2011 Change Net Sales $7,271 $6,371 +14% Operating Profit* $1,014 $859 +18% 28 |
|
|
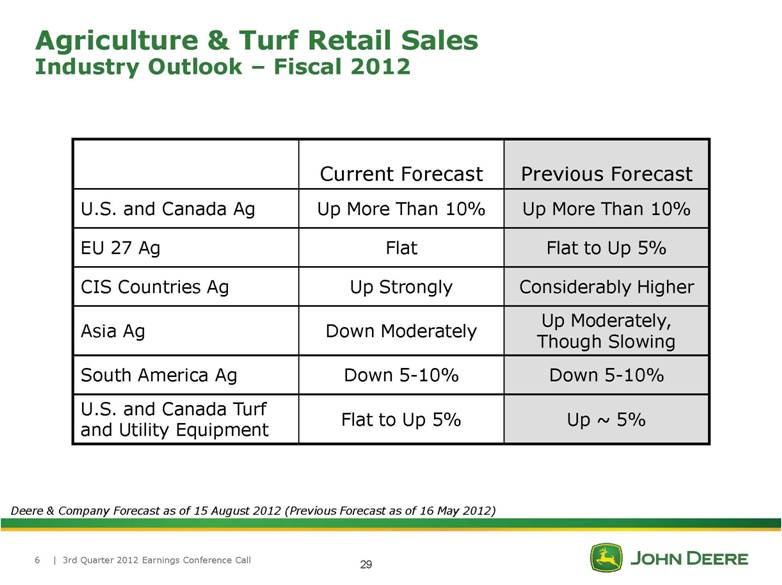
| 3rd Quarter 2012 Earnings Conference Call 6 Agriculture & Turf Retail Sales Industry Outlook – Fiscal 2012 Deere & Company Forecast as of 15 August 2012 (Previous Forecast as of 16 May 2012) Current Forecast Previous Forecast U.S. and Canada Ag Up More Than 10% Up More Than 10% EU 27 Ag Flat Flat to Up 5% CIS Countries Ag Up Strongly Considerably Higher Asia Ag Down Moderately Up Moderately, Though Slowing South America Ag Down 5-10% Down 5-10% U.S. and Canada Turf and Utility Equipment Flat to Up 5% Up ~ 5% 29 |
|
|
| 3rd Quarter 2012 Earnings Conference Call 7 Worldwide Agriculture & Turf Deere & Company Outlook Fiscal Year 2012 Forecast Net sales: Up ~ 13% Currency translation: ~ (4) points Previous forecast: Up ~ 15% Currency translation: ~ (3) points Deere & Company Forecast as of 15 August 2012 (Previous Forecast as of 16 May 2012) 30 |
|
|
| 3rd Quarter 2012 Earnings Conference Call 8 Worldwide Construction & Forestry Third Quarter Overview (in millions of dollars) Q3 2012 Q3 2011 Change Net Sales $1,659 $1,351 +23% Operating Profit* $113 $110 +3% Incremental Margin ~ 1% *Q3 2012 operating profit impacted by: Price realization Higher shipment volumes Increased production and raw-material costs Higher research and development expenses Higher selling, administrative and general expenses 31 |
|
|
U.S. Economic Indicators 2012 Forecast GDP Growth (annual percentage rate)* +2.0% Housing Starts (thousands) 765 Non-Residential Spending Growth (annual percentage rate)* +2.8% Government Spending Growth (annual percentage rate)* -6.8% | 3rd Quarter 2012 Earnings Conference Call 9 Worldwide Construction & Forestry Deere & Company Outlook Source: Global Insight, Calendar Year Estimates – July 2012 * Change from prior year in real dollars Fiscal Year 2012 Forecast Net sales: Up ~ 17% Currency translation: ~ (1) point Previous forecast: Up ~ 20% Currency translation: ~ (1) point Deere & Company Forecast as of 15 August 2012 (Previous Forecast as of 16 May 2012) 32 |
|
|
| 3rd Quarter 2012 Earnings Conference Call 10 Worldwide Financial Services Credit Loss History * Annualized provision for credit losses as of 31 July 2012 Provision for Credit Losses / Average Owned Portfolio 33 |
|
|
| 3rd Quarter 2012 Earnings Conference Call 11 Worldwide Financial Services Third Quarter 2012 Net income attributable to Deere & Company $110 million in Q3 2012 vs. $126 million in Q3 2011 Fiscal Year 2012 Forecast Net income attributable to Deere & Company of ~ $450 million Includes after-tax provision of ~ $25 million for the U.S. drought event Previous forecast: ~ $465 million Deere & Company Forecast as of 15 August 2012 (Previous Forecast as of 16 May 2012) 34 |
|
|
| 3rd Quarter 2012 Earnings Conference Call 12 Consolidated Trade Receivables & Inventory (in millions of dollars) Q3 2012* Actual 2012** Forecast 2012** Previous Forecast A&T ↑ $1,536 ↑ $1,100 ↑ $500 C&F ↑ $371 ↑ $225 ↑ $100 Total, as reported ↑ $1,907 ↑ $1,325 ↑ $600 Total, constant exchange ↑ $2,630 ↑ $1,775 ↑ $800 * Change at 31 July 2012 vs. 31 July 2011 ** Change at 31 October 2012 vs. 31 October 2011 Deere & Company Forecast as of 15 August 2012 (Previous Forecast as of 16 May 2012) 35 |
|
|
| 3rd Quarter 2012 Earnings Conference Call 13 Material Costs and Freight Equipment Operations Third Quarter 2012 Up ~ $70 million vs. Q3 2011 Fiscal Year 2012 Forecast Up ~ $400 million vs. FY 2011 Agriculture & Turf ↑ ~ $325 million Construction & Forestry ↑ ~ $75 million No change from previous forecast Deere & Company Forecast as of 15 August 2012 (Previous Forecast as of 16 May 2012) 36 |
|
|
| 3rd Quarter 2012 Earnings Conference Call 14 Research & Development Expense Equipment Operations Third Quarter 2012 Up ~ 18% vs. Q3 2011 Currency translation: ~ (3) points Fiscal Year 2012 Forecast Up ~ 15% vs. FY 2011 Currency translation: ~ (2) points Previous forecast: Up ~ 13% vs. FY 2011 Deere & Company Forecast as of 15 August 2012 (Previous Forecast as of 16 May 2012) 37 |
|
|
| 3rd Quarter 2012 Earnings Conference Call 15 Selling, Administrative & General Expense Equipment Operations Third Quarter 2012 Up ~ 8% vs. Q3 2011 Currency translation: ~ (4) points Fiscal Year 2012 Forecast Up ~ 9% vs. FY 2011 Growth: ~ +4 points Currency translation: ~ (3) points Previous forecast: Up ~ 11% vs. FY 2011 Growth: ~ +4 points Currency translation: ~ (2) points Deere & Company Forecast as of 15 August 2012 (Previous Forecast as of 16 May 2012) 38 |
|
|
| 3rd Quarter 2012 Earnings Conference Call 16 Pension and OPEB Expense Third Quarter 2012 Down ~ $20 million vs. FY 2011 Fiscal Year 2012 Forecast Down ~ $110 million vs. FY 2011 Deere & Company Forecast as of 15 August 2012 39 |
|
|
| 3rd Quarter 2012 Earnings Conference Call 17 Continued Strong Operating Performance Equipment Operations Fiscal Year Cash Flows from Operations * Previous forecast: ~ $3.4 billion Deere & Company Forecast as of 15 August 2012 (Previous Forecast as of 16 May 2012) $ Billions ~ 40 |
|
|
| 3rd Quarter 2012 Earnings Conference Call 18 2012 Company Outlook Fourth Quarter 2012 Forecast Net sales: Up ~ 13% vs. Q4 2011 Price realization: ~ +3 points Currency translation: ~ (4) points Fiscal Year 2012 Forecast Net sales: Up ~ 13% vs. FY 2011 Price realization: ~ +4 points Currency translation: ~ (3) points Previous forecast: Up ~ 15% vs. FY 2011 Price realization: ~ +4 points Currency translation: ~ (3) points Net income attributable to Deere & Company of ~ $3.1 billion Previous forecast ~ $3.35 billion Deere & Company Forecast as of 15 August 2012 (Previous Forecast as of 16 May 2012) 41 |
|
|
| 3rd Quarter 2012 Earnings Conference Call 19 Global Agricultural Outlook Expectations two months ago: Large harvests, replenished stocks, softer commodity prices. Global Ag sector now pressed to catch up with demand and restore stocks to more comfortable levels. Adverse weather in several parts of the world – notably drought in U.S. – but also Black Sea Region, India, and elsewhere has significantly altered the outlook for the agricultural economy. While enormous crop and livestock losses, sector performance remains strong for 2012 - and price levels today point to 2013 potentially being a very positive year for agriculture and farmers – strong prices should boost Ag activity all over the world and especially in the Deere growth markets. Deere & Company Forecast as of 15 August 2012 42 |
|
|
| 3rd Quarter 2012 Earnings Conference Call 20 U.S. Crop Report – 2012/2013 USDA Forecast as of 10 August 2012 (Previous Forecast as of 11 July 2012) Corn Soybeans Wheat August July August July August July Harvested Acres (millions) 87.4 88.9 74.6 75.3 48.8 48.8 Yield (bushels/acre) 123.4 146.0 36.1 40.5 46.5 45.6 Production (billion bushels) 10.8 13.0 2.7 3.1 2.3 2.2 Average Price (dollars/bushel) $8.20 $5.90 $16.00 $14.00 $8.30 $6.80 43 |
|
|
| 3rd Quarter 2012 Earnings Conference Call 21 Difficult to Predict Drought Effect on Yield Wide yield variability across fields Reflects soil differences in water-holding capacity Late-season rains should be helpful for soybeans Drought tolerance of today’s corn genetics far superior to 1988 Deere & Company Forecast as of 15 August 2012 Ear size variation in same field (Moline, IL) 640 420 370 160 Kernels per ear 44 |
|
|
| 3rd Quarter 2012 Earnings Conference Call 22 Farmers Entered 2012 in Strong Financial Position Cash flow – strong for a decade Cash flow – strong for a decade Balance sheet – strongest in history Crop and revenue insurance help ameliorate financial situation for crop farmers Disaster assistance expected for livestock producers Better genetics, machinery, technology, and management Deere & Company Forecast as of 15 August 2012 Farmers were in a better position to cope and respond entering this year (and drought) than ever before. 45 |
|
|
Crop Prices Projected to Remain Strong Well Into 2013 | 3rd Quarter 2012 Earnings Conference Call 23 Source: Actual Data: USDA Forecast Data: Deere & Company Forecast as of 15 August 2012 46 |
|
|
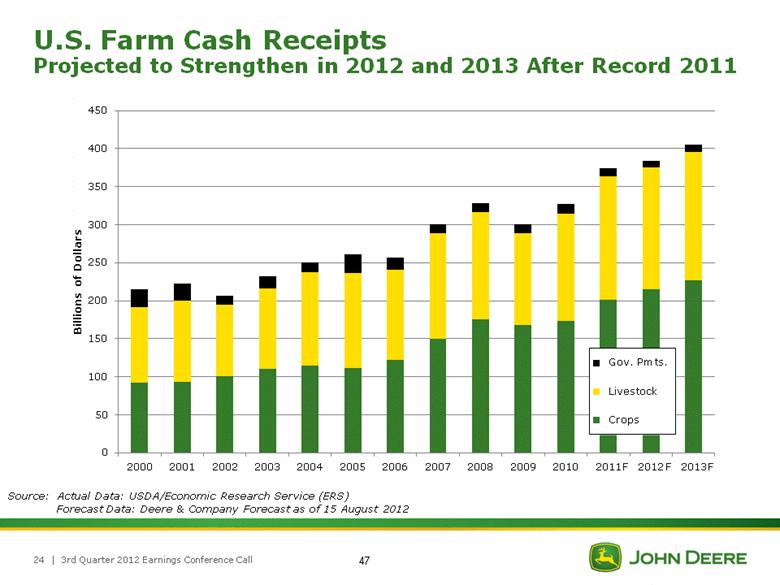
U.S. Farm Cash Receipts Projected to Strengthen in 2012 and 2013 After Record 2011 | 3rd Quarter 2012 Earnings Conference Call 24 Source: Actual Data: USDA/Economic Research Service (ERS) Forecast Data: Deere & Company Forecast as of 15 August 2012 F F F 47 |
|
|
U.S. Farm Net Cash Income New Records in 6 of Past 10 Years | 3rd Quarter 2012 Earnings Conference Call 25 Source: USDA/ERS – February 2012 48 |
|
|
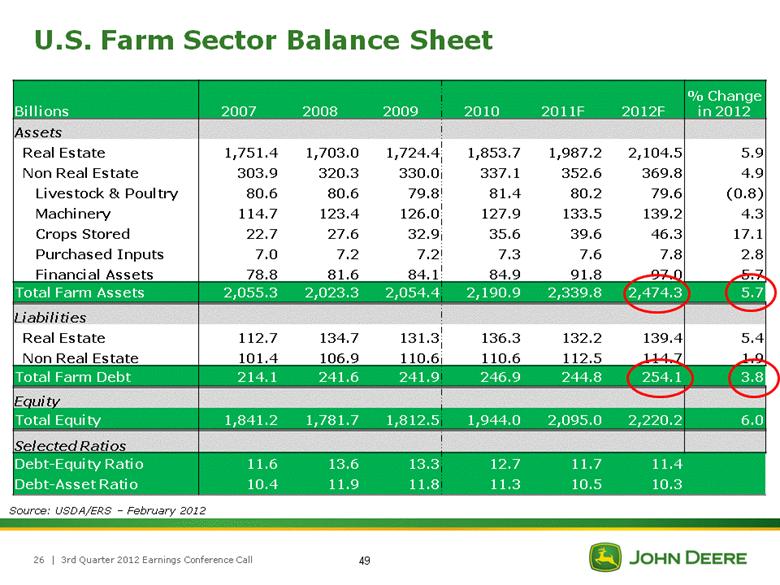
| 3rd Quarter 2012 Earnings Conference Call 26 Billions 2007 2008 2009 2010 2011F 2012F % Change in 2012 Assets Real Estate 1,751.4 1,703.0 1,724.4 1,853.7 1,987.2 2,104.5 5.9 Non Real Estate 303.9 320.3 330.0 337.1 352.6 369.8 4.9 Livestock & Poultry 80.6 80.6 79.8 81.4 80.2 79.6 (0.8) Machinery 114.7 123.4 126.0 127.9 133.5 139.2 4.3 Crops Stored 22.7 27.6 32.9 35.6 39.6 46.3 17.1 Purchased Inputs 7.0 7.2 7.2 7.3 7.6 7.8 2.8 Financial Assets 78.8 81.6 84.1 84.9 91.8 97.0 5.7 Total Farm Assets 2,055.3 2,023.3 2,054.4 2,190.9 2,339.8 2,474.3 5.7 Liabilities Real Estate 112.7 134.7 131.3 136.3 132.2 139.4 5.4 Non Real Estate 101.4 106.9 110.6 110.6 112.5 114.7 1.9 Total Farm Debt 214.1 241.6 241.9 246.9 244.8 254.1 3.8 Equity Total Equity 1,841.2 1,781.7 1,812.5 1,944.0 2,095.0 2,220.2 6.0 Selected Ratios Debt-Equity Ratio 11.6 13.6 13.3 12.7 11.7 11.4 Debt-Asset Ratio 10.4 11.9 11.8 11.3 10.5 10.3 Source: USDA/ERS – February 2012 U.S. Farm Sector Balance Sheet 49 |
|
|
| 3rd Quarter 2012 Earnings Conference Call 27 Crop Insurance and Disaster Assistance Source: Actual Data: USDA/Risk Management Agency (RMA) Forecast Data: Deere & Company Forecast as of 15 August 2012 50 |
|
|
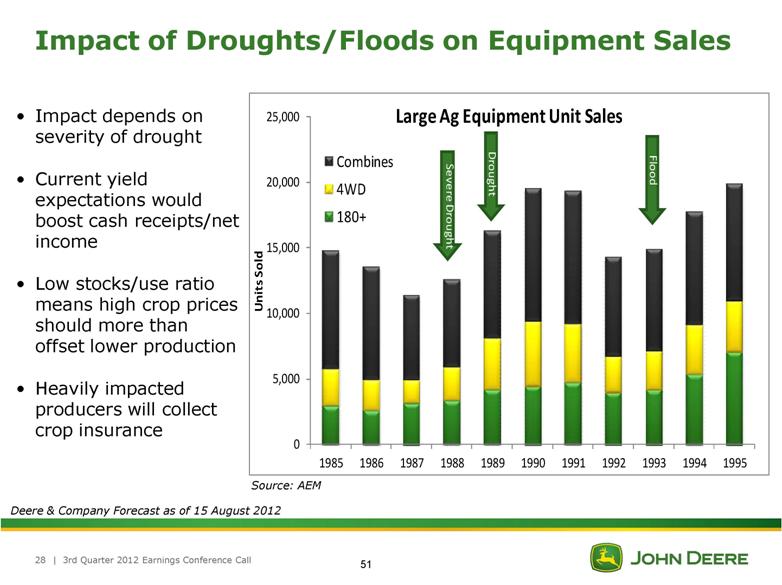
| 3rd Quarter 2012 Earnings Conference Call 28 Impact of Droughts/Floods on Equipment Sales • Impact depends on severity of drought • Current yield expectations would boost cash receipts/net income • Low stocks/use ratio means high crop prices should more than offset lower production • Heavily impacted producers will collect crop insurance Deere & Company Forecast as of 15 August 2012 0 5,000 10,000 15,000 20,000 25,000 1985 1986 1987 1988 1989 1990 1991 1992 1993 1994 1995 Units Sold Large Ag Equipment Unit Sales Combines 4WD 180+ Severe Drought Drought Flood Source: AEM 51 |
|
|
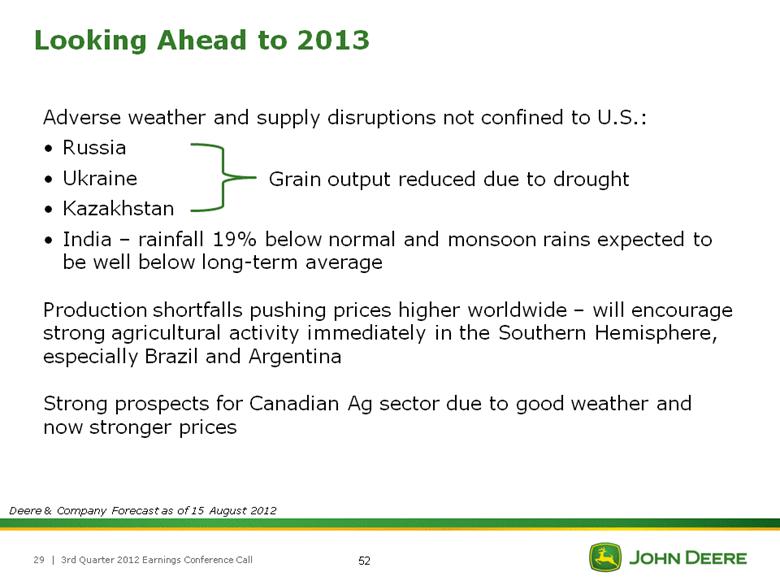
| 3rd Quarter 2012 Earnings Conference Call 29 Looking Ahead to 2013 Adverse weather and supply disruptions not confined to U.S.: Russia Ukraine Kazakhstan India – rainfall 19% below normal and monsoon rains expected to be well below long-term average Production shortfalls pushing prices higher worldwide – will encourage strong agricultural activity immediately in the Southern Hemisphere, especially Brazil and Argentina Strong prospects for Canadian Ag sector due to good weather and now stronger prices Deere & Company Forecast as of 15 August 2012 Grain output reduced due to drought 52 |
|
|
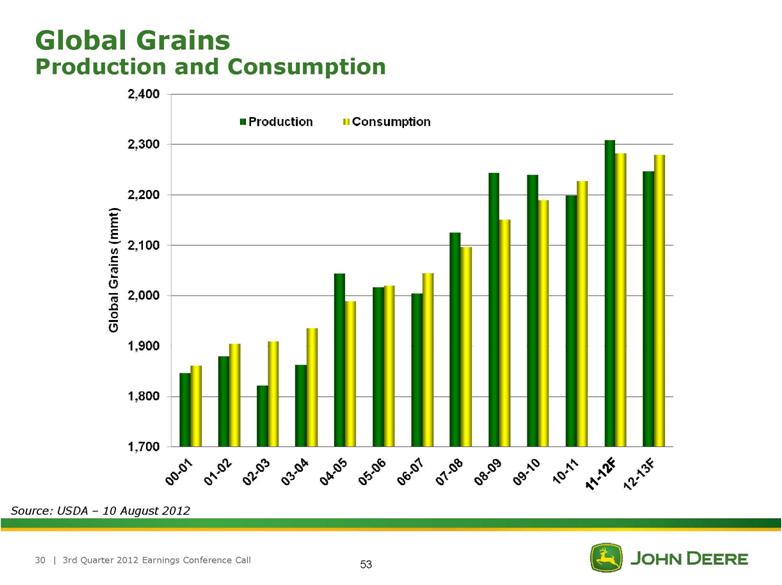
Global Grains Production and Consumption | 3rd Quarter 2012 Earnings Conference Call 30 Source: USDA – 10 August 2012 53 |
|
|
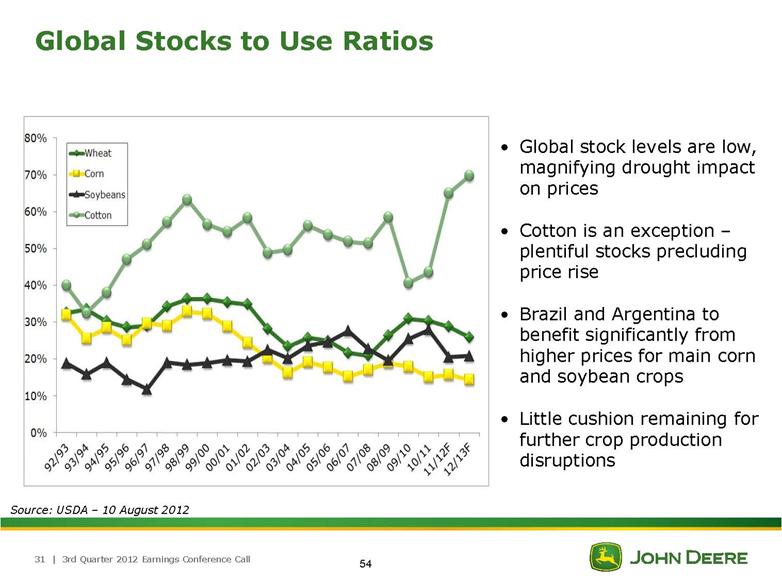
Global Stocks to Use Ratios | 3rd Quarter 2012 Earnings Conference Call 31 Source: USDA – 10 August 2012 • Global stock levels are low, magnifying drought impact on prices • Cotton is an exception – plentiful stocks precluding price rise • Brazil and Argentina to benefit significantly from higher prices for main corn and soybean crops • Little cushion remaining for further crop production disruptions 54 |
|
|
| 3rd Quarter 2012 Earnings Conference Call 32 Observations Deere & Company Forecast as of 15 August 2012 Severe U.S. drought – perhaps the worst since 1956—along with significant production shortfalls elsewhere in the world—have suddenly altered the economic outlook for agriculture for next year. Farmers are better prepared to cope and to respond than ever before: Better genetics, machinery, technology, management Several consecutive years of solid financial performance have provided a strong financial foundation Higher crop prices likely will boost gross receipts and net incomes for 2012 and 2013 Crop cash receipts (best predictor of Large Ag equipment sales) should be near record levels in both 2012 and 2013 Crop insurance for crop farmers and government assistance for livestock farmers should help ameliorate the current situation Price levels today point to 2013 as a very positive year for agriculture and farmers – strong prices should boost Ag activity all over the world and especially in the Deere growth markets. Global Ag sector now needs to catch up with demand and restore stocks to more comfortable levels. 55 |
|
|
| 3rd Quarter 2012 Earnings Conference Call 33 Appendix 56 |
|
|
| 3rd Quarter 2012 Earnings Conference Call 34 57 |
|
|
| 3rd Quarter 2012 Earnings Conference Call 35 Retail Sales U.S. and Canada Ag Industry* Deere** Utility Tractors ↑ 3% ↑ in line with the industry Row-Crop Tractors ↑ 33% ↑ in line with the industry 4WD Tractors ↑ 21% ↑ more than the industry Combines ↑ 14% ↑ more than the industry July 2012 Retail Sales and Dealer Inventories * As reported by the Association of Equipment Manufacturers ** As reported to the Association of Equipment Manufacturers *** At 31 July – in units as a % of trailing 12 months retail sales, as reported to the Association of Equipment Manufacturers Deere Dealer Inventories*** U.S. and Canada Ag 2012 2011 Row-Crop Tractors 23% 18% Combines 19% 18% 58 |
|
|
| 3rd Quarter 2012 Earnings Conference Call 36 July 2012 Retail Sales EU 27 Deere* Tractors ↓ low double digits Combines ↑ double digits U.S. and Canada Deere* Selected Turf & Utility Equipment ↓ a single digit * Based on internal sales reports U.S. and Canada – Construction & Forestry Deere* First-in-the-Dirt ↑ double digits Settlements ↑ a single digit 59 |
|
|
| 3rd Quarter 2012 Earnings Conference Call 37 Income Taxes Equipment Operations Third Quarter 2012 Effective tax rate: ~ 35% Fiscal Year 2012 Forecast Projected effective tax rate: 33-35% No change from previous forecast Deere & Company Forecast as of 15 August 2012 (Previous Forecast as of 16 May 2012) 60 |
|
|
| 3rd Quarter 2012 Earnings Conference Call 38 Other Information Equipment Operations Fiscal Year 2012 Forecast Capital Expenditures: ~ $1.3 billion No change from previous forecast Depreciation and Amortization: ~ $650 million No change from previous forecast Pension/OPEB Contributions: ~ $475 million Previous forecast: ~ $450 million Deere & Company Forecast as of 15 August 2012 (Previous Forecast as of 16 May 2012) 61 |
|
|
Deere Use-of-Cash Priorities | 3rd Quarter 2012 Earnings Conference Call 39 Manage the balance sheet, including liquidity, to support a rating that provides access to low-cost and readily available short- and long-term funding mechanisms Reflects the strategic nature of our financial services operation Committed to “A” Rating Cash from Operations Fund Operating and Growth Needs Common Stock Dividend Share Repurchase Fund value-creating investments in our businesses Consistently and moderately raise dividend targeting a 25%-35% payout ratio of mid-cycle earnings Consider share repurchase as a means to deploy excess cash to shareholders, once above requirements are met and repurchase is viewed as value-enhancing 62 |
|
|
| 3rd Quarter 2012 Earnings Conference Call 40 Worldwide Financial Services 2012 Unsecured Term Debt Maturities* * Maturities as of 31 July 2012 $ Millions 63 |
|
|
| 3rd Quarter 2012 Earnings Conference Call 41 Deere Quarterly Dividends Declared* Q1 2003 – Q3 2012 * Adjusted for 2 for 1 stock split on 26 November 2007 ** See Appendix for revised John Deere Strategy Dividend raised 64% since launch of the revised John Deere Strategy in 2010** 64 |
|
|
| 3rd Quarter 2012 Earnings Conference Call 42 Share Repurchase As Part of Publicly Announced Plans Cumulative cost of repurchases 2004-3Q2012: ~ $8.8 billion Amount remaining on May 2008 authorization of $5 billion: ~ $2.9 billion 31 July 2012 period ended shares (basic): ~ 391.7 million (diluted): ~ 395.9 million Shares repurchased 2004-3Q2012: ~ 156.1 million Average repurchase price 2004-3Q2012: $56.46 * All shares adjusted for two-for-one stock split effective 26 November 2007 ** Rounded totals for each period – sum may not tie to cumulative cost of repurchases 2004-3Q2012 Actual Shares Repurchased* (in millions) Total Amount** (in billions) 2004 5.9 $0.2 2005 27.7 $0.9 2006 34.0 $1.3 2007 25.7 $1.5 2008 21.2 $1.7 2009 0.0 $0.0 2010 5.2 $0.4 2011 20.8 $1.7 2012 YTD 15.6 $1.2 65 |
|
|
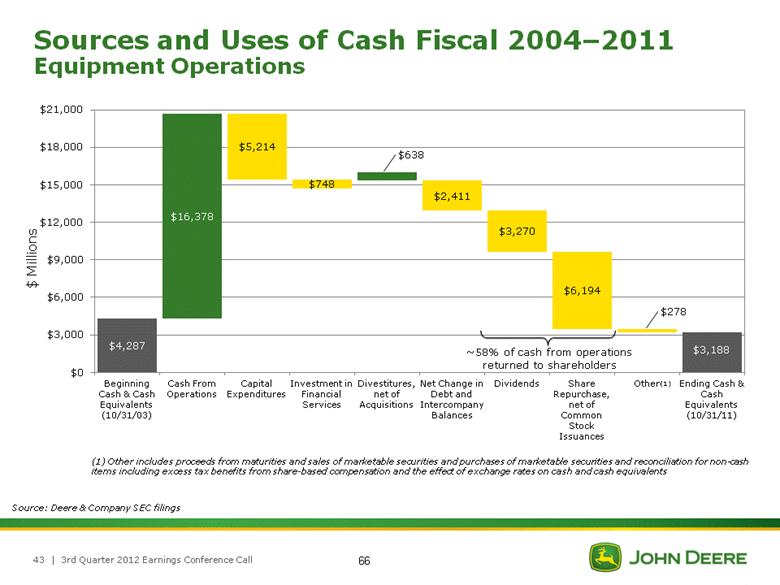
| 3rd Quarter 2012 Earnings Conference Call 43 Sources and Uses of Cash Fiscal 2004–2011 Equipment Operations (1) Other includes proceeds from maturities and sales of marketable securities and purchases of marketable securities and reconciliation for non-cash items including excess tax benefits from share-based compensation and the effect of exchange rates on cash and cash equivalents Source: Deere & Company SEC filings ~58% of cash from operations returned to shareholders (1) $3,188 66 |
|
|
| 3rd Quarter 2012 Earnings Conference Call 44 U.S. Commodity Price Estimates Unless Otherwise Labeled, Deere & Company Forecast as of 15 August 2012 (Previous Forecast as of 16 May 2012) USDA Forecast 10 August 2012 (dollars per bushel, except cotton, which is dollars per pound) 2010/11 2011/12 Forecast Previous 2011/12 2012/13 Forecast Previous 2012/13 2012/13 USDA Corn $5.18 $6.25 $6.05 $8.25 $4.85 $7.50-$8.90 Wheat $5.70 $7.24 $7.25 $8.25 $6.25 $7.60-$9.00 Soybeans $11.30 $12.50 $12.25 $16.00 $13.00 $15.00-$17.00 Cotton $0.82 $0.90 $0.90 $0.68 $0.70 $0.61-$0.79 67 |
|
|
| 3rd Quarter 2012 Earnings Conference Call 45 U.S. Farm Cash Receipts Deere & Company Forecast as of 15 August 2012 (Previous Forecast as of 16 May 2012) (in billions of dollars) 2010 2011 Forecast Previous 2011 2012 Forecast Previous 2012 2013 Forecast Crops $172.9 $201.2 $201.1 $215.4 $202.9 $226.9 Livestock $141.4 $162.4 $162.4 $159.6 $163.1 $168.8 Government Payments $12.4 $10.7 $10.7 $9.3 $9.3 $9.3 Total Cash Receipts $326.7 $374.3 $374.2 $384.3 $375.3 $405.0 68 |
|
|
| 3rd Quarter 2012 Earnings Conference Call 46 U.S. Acres Harvested and Crop Yields Unless Otherwise Labeled, Deere & Company Forecast as of 15 August 2012 USDA Forecast 10 August 2012 (Yield in bushels per acre, except cotton, which is pounds per acre) Acres Harvested (millions) Yield 2011/12 2012/13 Forecast 2012/13 USDA 2011/12 2012/13 Forecast 2012/13 USDA Corn 84.0 86.0 87.4 147.2 123.4 123.4 Wheat 45.7 48.8 48.8 43.7 46.5 46.5 Soybeans 73.6 74.6 74.6 41.5 36.1 36.1 Cotton 9.5 10.8 10.8 790 784 784 69 |
|
|
| 3rd Quarter 2012 Earnings Conference Call 47 U.S. Net Farm Cash Income (in billions of dollars) 2010 2011 Forecast Previous 2011 2012 Forecast Previous 2012 2013 Forecast Total Cash Receipts $326.7 $374.3 $374.2 $384.3 $375.3 $405.0 Other Cash Income $18.3 $22.6 $22.6 $22.0 $22.0 $24.0 Gross Cash Income $345.0 $396.9 $396.8 $406.3 $397.3 $429.0 Cash Expenses ($252.7) ($287.4) ($287.4) ($296.0) ($295.0) ($313.0) Net Cash Income $92.3 $109.5 $109.4 $110.3 $102.3 $116.0 Deere & Company Forecast as of 15 August 2012 (Previous Forecast as of 16 May 2012) 70 |
|
|
| 3rd Quarter 2012 Earnings Conference Call 48 Deere & Company Forecast as of 15 August 2012 Economic Update EU 27 Farmer sentiment remains generally positive Grain, beef and pork prices at attractive levels Production levels in the north are expected to increase while the south is hampered by drought Financing continues to be more readily available in the north Macroeconomic factors more heavily impacting the south 71 |
|
|
| 3rd Quarter 2012 Earnings Conference Call 49 Deere & Company Forecast as of 15 August 2012 Economic Update Other Selected Markets Commonwealth of Independent States (CIS) Farm sector remains strong Above normal temperatures have lowered yield projections by ~ 20% Some countries, notably Ukraine, are facing financing constraints India After several years of strong growth, the tractor market is softening Monsoon deficit expected to lower grain output China Government subsidies have been delayed in reaching farmer customers Crop prices are strong for rice, wheat and corn Corn production expected to increase slightly Soybean production expected to decrease as farmers switch to corn and rice 72 |
|
|
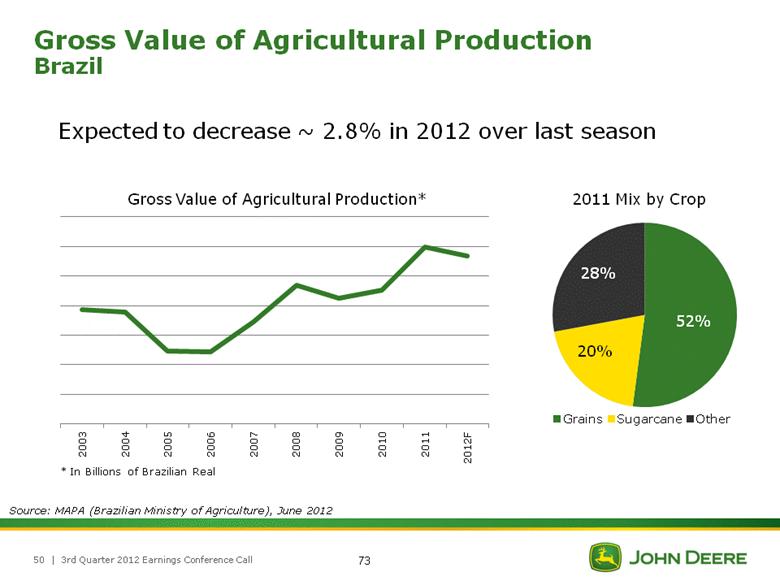
| 3rd Quarter 2012 Earnings Conference Call 50 Gross Value of Agricultural Production Brazil Source: MAPA (Brazilian Ministry of Agriculture), June 2012 Gross Value of Agricultural Production* * In Billions of Brazilian Real Expected to decrease ~ 2.8% in 2012 over last season 2011 Mix by Crop 73 |
|
|
Deere’s fourth quarter 2012 conference call is scheduled for 9:00 a.m. central time on Wednesday, November 21, 2012 74 |