Attached files
| file | filename |
|---|---|
| 8-K - TECHPRECISION CORPORATION FORM 8-K - TECHPRECISION CORP | tpcs8k.htm |
| EX-99.1 - EXHIBIT 99.1 - TECHPRECISION CORP | ex99-1.htm |
Exhibit 99.2
Q1 FY13 Shareholder Conference Call August 2012 © 2012. All rights reserved.
© 2012. All rights reserved. * Safe Harbor Statement Safe Harbor Statement Under the Private Securities Litigation Reform Act of 1995: Any statements set forth in this presentation that are not historical facts are forward-looking statements that involve risks and uncertainties that could cause actual results to differ materially from those in the forward-looking statements, which may include, but are not limited to, such factors as unanticipated changes in product demand, increased competition, downturns in the economy, failure to comply with specific regulations pertaining to government projects, fluctuation of revenue due to the nature of project lifecycles, and other information detailed from time to time in the Company filings and future filings with the United States Securities and Exchange Commission. The forward-looking statements contained in this presentation are made only of this date, and the Company is under no obligation to revise or update these forward-looking statements.
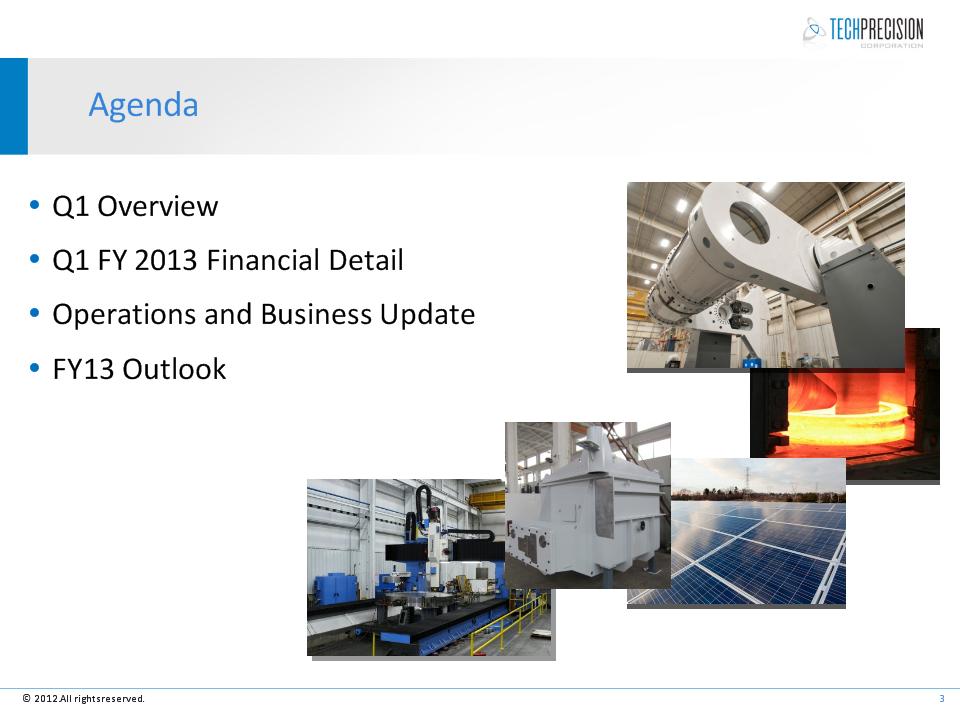
Agenda © 2012. All rights reserved. * Q1 Overview Q1 FY 2013 Financial Detail Operations and Business Update FY13 Outlook
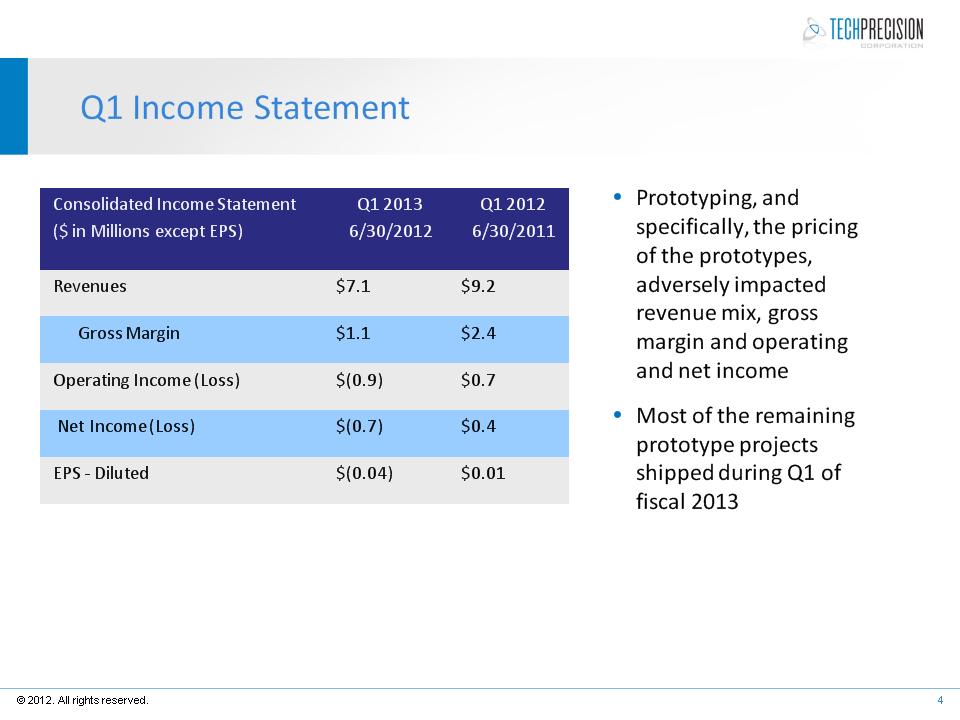
Q1 Income Statement Consolidated Income Statement ($ in Millions except EPS) Q1 2013 6/30/2012 Q1 2012 6/30/2011 Revenues $7.1 $9.2 Gross Margin $1.1 $2.4 Operating Income (Loss) $(0.9) $0.7 Net Income (Loss) $(0.7) $0.4 EPS - Diluted $(0.04) $0.01 * © 2012. All rights reserved. * Prototyping, and specifically, the pricing of the prototypes, adversely impacted revenue mix, gross margin and operating and net income Most of the remaining prototype projects shipped during Q1 of fiscal 2013
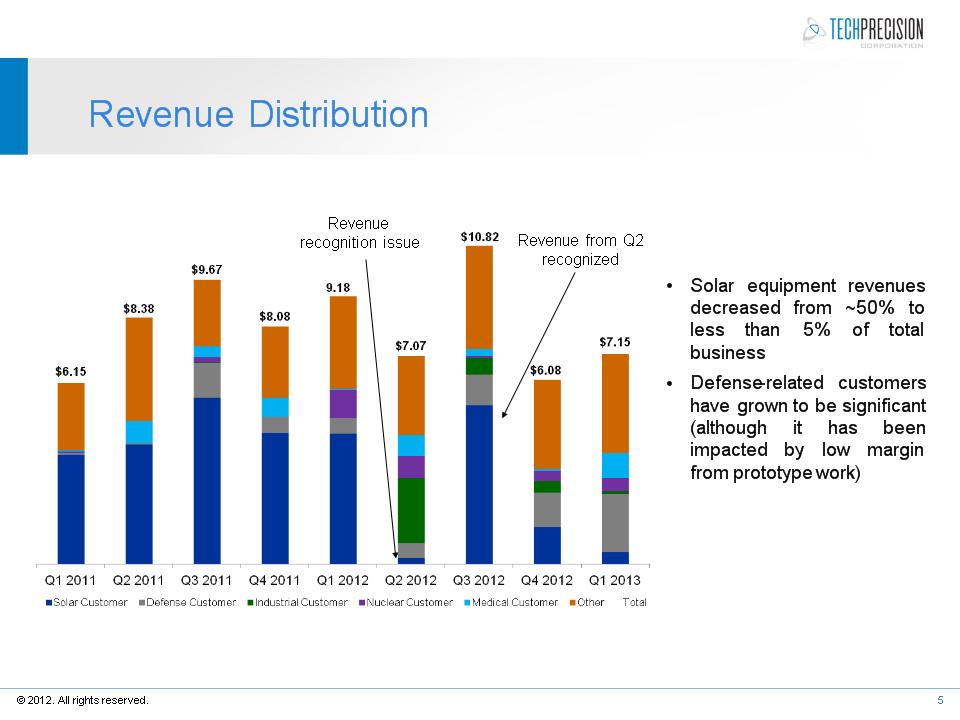
Revenue Distribution © 2012. All rights reserved. * Revenue recognition issue Revenue from Q2 recognized Solar equipment revenues decreased from ~50% to less than 5% of total business Defense-related customers have grown to be significant (although it has been impacted by low margin from prototype work)
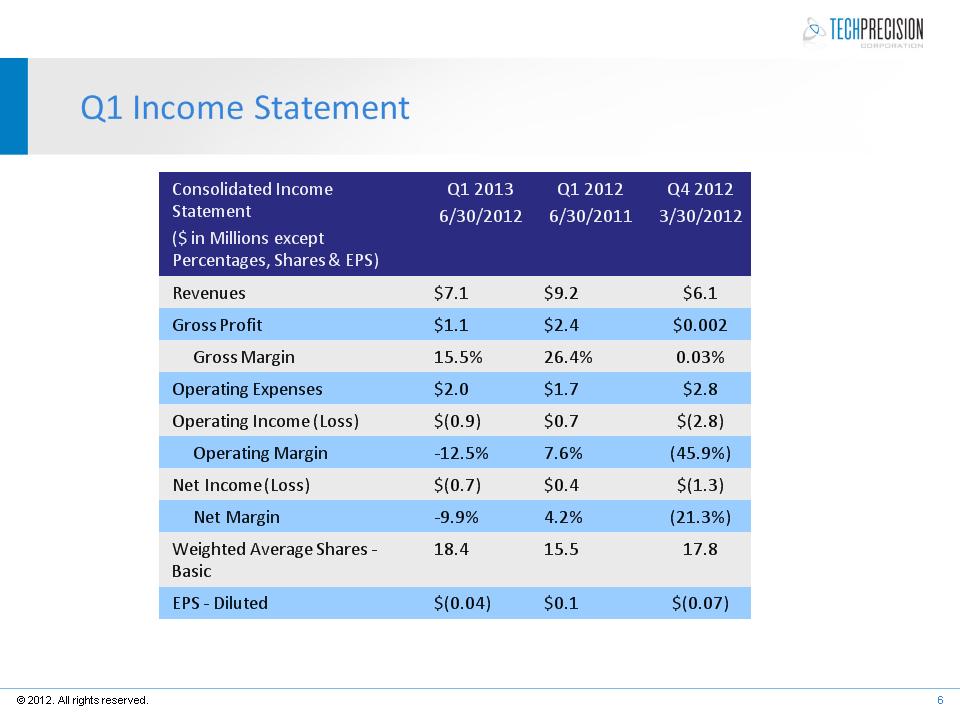
Q1 Income Statement Consolidated Income Statement ($ in Millions except Percentages, Shares & EPS) Q1 2013 6/30/2012 Q1 2012 6/30/2011 Q4 2012 3/30/2012 Revenues $7.1 $9.2 $6.1 Gross Profit $1.1 $2.4 $0.002 Gross Margin 15.5% 26.4% 0.03% Operating Expenses $2.0 $1.7 $2.8 Operating Income (Loss) $(0.9) $0.7 $(2.8) Operating Margin -12.5% 7.6% (45.9%) Net Income (Loss) $(0.7) $0.4 $(1.3) Net Margin -9.9% 4.2% (21.3%) Weighted Average Shares - Basic 18.4 15.5 17.8 EPS - Diluted $(0.04) $0.1 $(0.07) * © 2012. All rights reserved. *
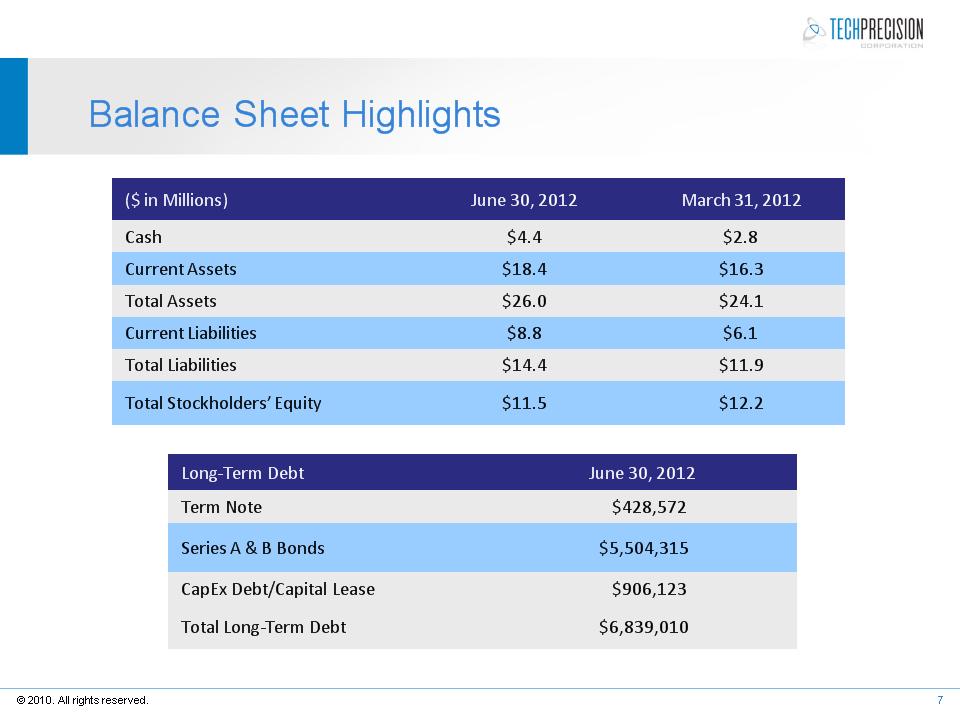
Balance Sheet Highlights © 2010. All rights reserved. 7 ($ in Millions) June 30, 2012 March 31, 2012 Cash $4.4 $2.8 Current Assets $18.4 $16.3 Total Assets $26.0 $24.1 Current Liabilities $8.8 $6.1 Total Liabilities $14.4 $11.9 Total Stockholders’ Equity $11.5 $12.2 Long-Term Debt June 30, 2012 Term Note $428,572 Series A & B Bonds $5,504,315 CapEx Debt/Capital Lease $906,123 Total Long-Term Debt $6,839,010
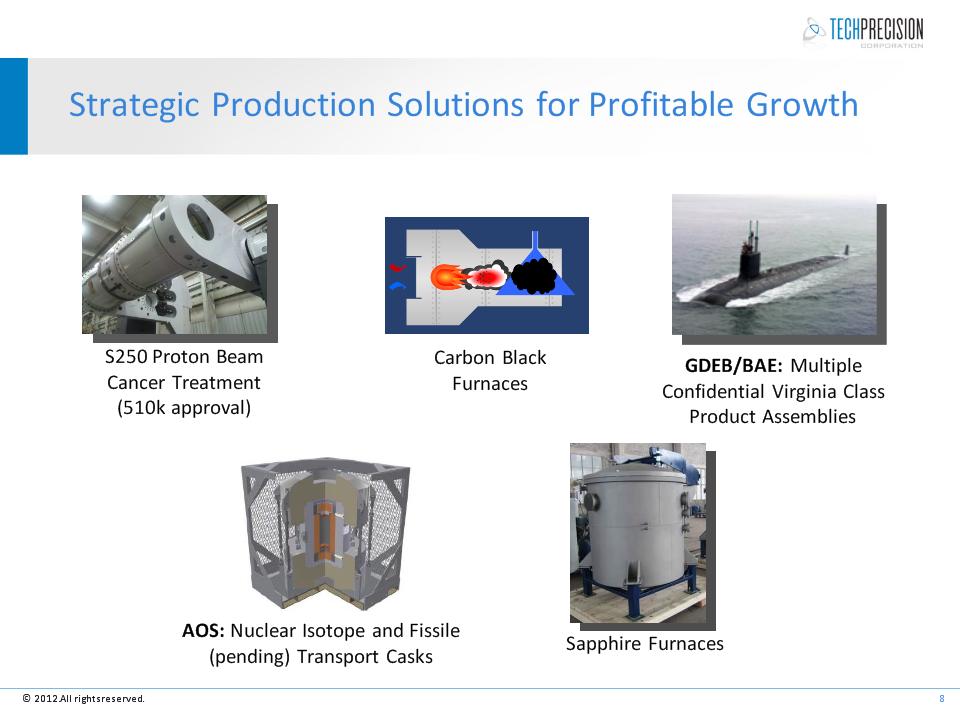
Strategic Production Solutions for Profitable Growth © 2012. All rights reserved. * AOS: Nuclear Isotope and Fissile (pending) Transport Casks S250 Proton Beam Cancer Treatment (510k approval) Carbon Black Furnaces GDEB/BAE: Multiple Confidential Virginia Class Product Assemblies Sapphire Furnaces
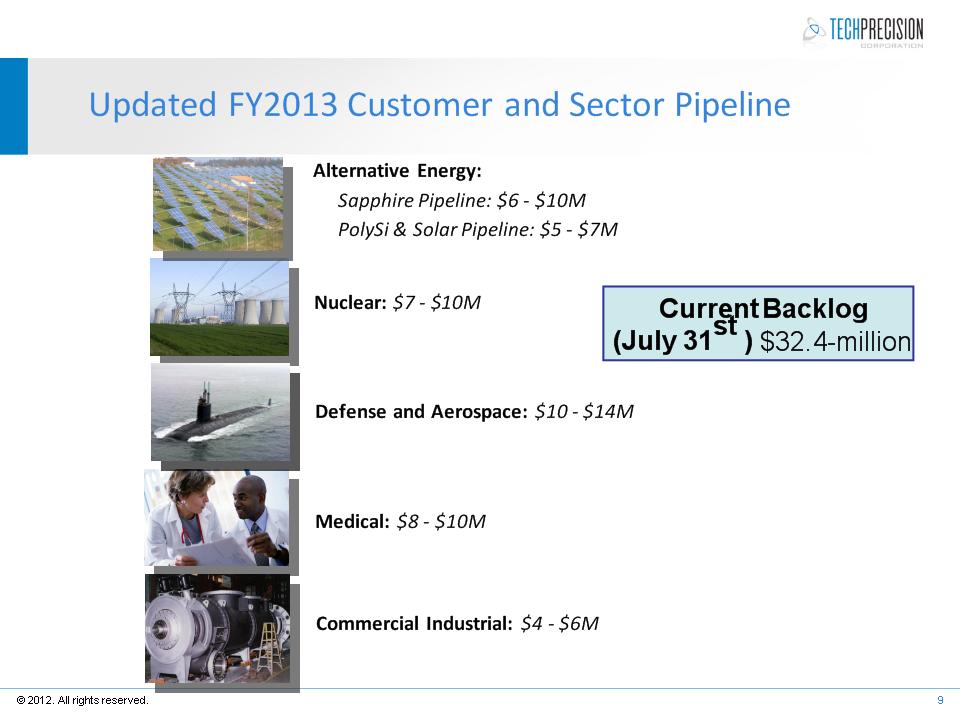
Updated FY2013 Customer and Sector Pipeline © 2012. All rights reserved. * Alternative Energy: Sapphire Pipeline: $6 - $10M PolySi & Solar Pipeline: $5 - $7M Nuclear: $7 - $10M Defense and Aerospace: $10 - $14M Medical: $8 - $10M Commercial Industrial: $4 - $6M Current Backlog (July 31st ) $32.4-million
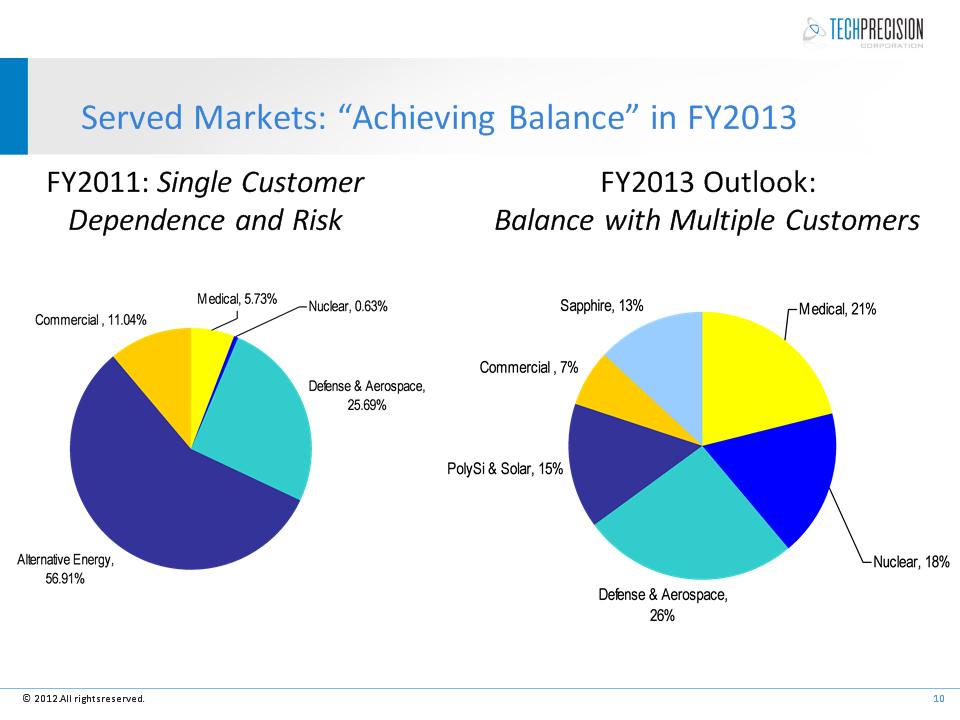
Served Markets: “Achieving Balance” in FY2013 * © 2012. All rights reserved. FY2011: Single Customer Dependence and Risk FY2013 Outlook: Balance with Multiple Customers
© 2012. All rights reserved. * www.TechPrecision.com www.ranor.com www.wcmcsolutions.com