Attached files
| file | filename |
|---|---|
| 8-K - Federal Home Loan Bank of Indianapolis | a8-k0812regionalmembermeet.htm |

1

FHLBI Update 2012 Regional Member Meeting Milton J. Miller President - CEO presented by

FHLBI Performance Results FHLB System Performance Regulatory Reform Update Agenda 3

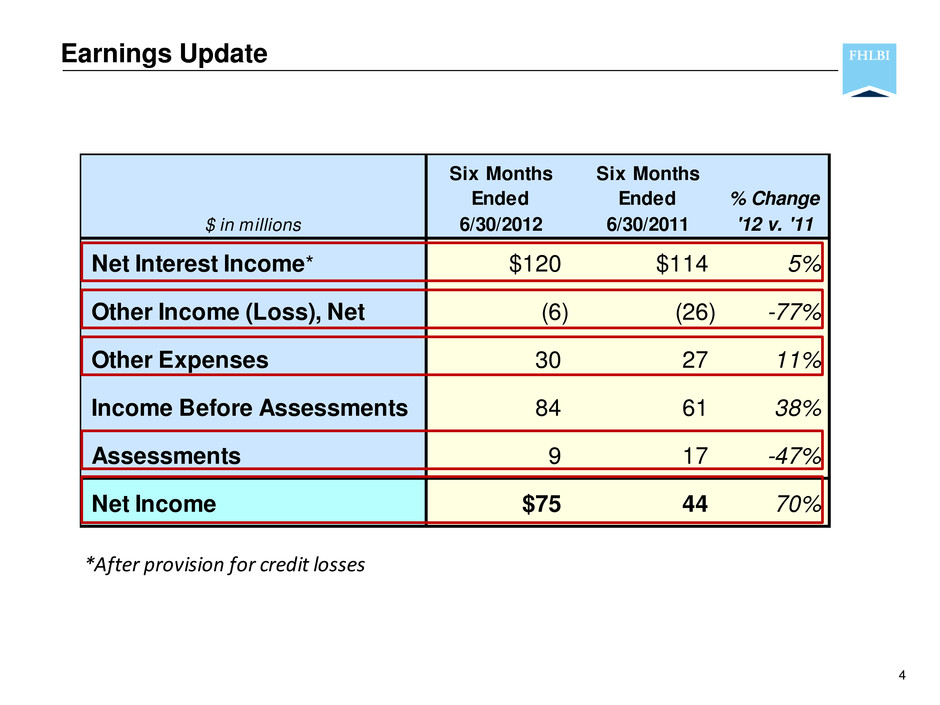
Six Months Six Months Ended Ended % Change $ in millions 6/30/2012 6/30/2011 '12 v. '11 Net Interest Income* $120 $114 5% Other Income (Loss), Net (6) (26) -77% Other Expenses 30 27 11% Income Before Assessments 84 61 38% Assessments 9 17 -47% Net Income $75 44 70% *After provision for credit losses Earnings Update 4

0% 1% 2% 3% 4% 5% 6% 1Q 2Q 3Q 4Q 1Q 2Q 3Q 4Q 1Q 2Q 3Q 4Q 1Q 2Q 3Q 4Q 1Q 2Q FHLBI Dividend 3-Month LIBOR 5 FHLBI Dividend vs. LIBOR 2011 2012 2008 2009 2010 2011 20122008 2009 2010 0.0% 0.5% 1.0% 1.5% 2.0% 2.5% 3.0% 1Q 2Q 3Q 4Q 1Q 2Q 3Q 4Q 1Q 2Q 3Q 4Q 1Q 2Q 3Q 4Q 1Q 2Q FHLBI Dividend minus 3-month LIBOR

Retained Earnings 6 2010 2011 2012 $373 $351 $396 $427 $437 $451 $472 $498 $527 $549 $0 $100 $200 $300 $400 $500 $600 Q1 Q2 Q3 Q4 Q1 Q2 Q3 Q4 Q1 Q2 $ in millions Current retained earnings is 26% of GAAP capital. 47% Growth

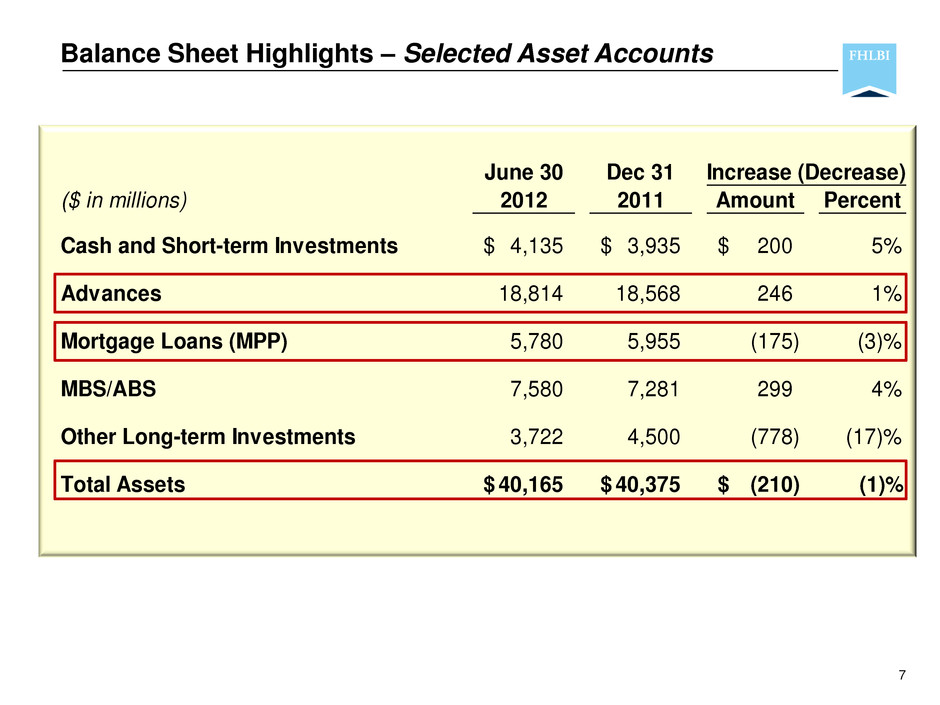
Balance Sheet Highlights – Selected Asset Accounts 7 June 30 Dec 31 ($ in millions) 2012 2011 Amount Percent Cash and Short-term Investments 4,135$ 3,935$ 200$ 5% Advances 18,814 18,568 246 1% Mortgage Loans (MPP) 5,780 5,955 (175) (3)% MBS/ABS 7,580 7,281 299 4% Other Long-term Investments 3,722 4,500 (778) (17)% Total Assets 40,165$ 40,375$ (210)$ (1)% Increase (Decrease)

Balance Sheet Highlights – Selected Capital Accounts 8 June 30 Dec 31 ($ in millions) 2012 2011 Amount Percent Capital Stock 1,608$ 1,563$ 45$ 3% Mandatorily Redeemable Capital Stock 451 454 (3) (1)% Total Regulatory Capital Stock 2,059$ 2,017$ 42 2% Regulatory Capital 2,608$ 2,515$ 93$ 4% Regulatory Capital Ratio 6.5% 6.2% Increase (Decrease)

9 Total FHLBI Member Advances (at par) $10 $15 $20 $25 $30 2Q 20122011201020092008200720062005 $ in billions Insurance Companies 48% Depositories 52% By Sector Data per FHFA’s FHLB System membership files.

10 Total FHLBI Member Advances by Member Type (at par) $0 $5 $10 $15 $20 $25 $30 2Q 20122011201020092008200720062005 in billions Banks/Thrifts Credit Unions Insurance Companies Data per FHFA’s FHLB System membership files.

11 Advances Summary Significant opportunities for locking in low rate funding and/or extending duration through restructuring Continued growth prospects for insurance companies Cautious optimism for moderate loan growth from depositories

MPP Growth 12 0 10 20 30 40 50 $0 $30 $60 $90 $120 Jan Feb Mar Apr May Jun Jul Aug Sep Oct Nov Dec Jan Feb Mar Apr May Jun Ne w Se lle rs Pu rch ases ($ in m illi on s) Monthly Purchases Cumulative New Sellers 2011 2012 MPP Advantage was actively launched in late 2010.

$0 $1 $2 $3 $4 $5 $6 $7 $8 1Q 10 2Q 10 3Q 10 4Q 10 1Q 11 2Q 11 3Q 11 4Q 11 1Q 12 2Q 12 New Balances 13 MPP Balance Outstanding $ in billions 2010 2011 2012 Legacy Balances $5.8

14 MPP Summary Growing member participation MPP Advantage popularity continues Maintaining commitment to customer service Keeping guidelines & pricing consistent Selective bulk purchases

The competitive round for 2011 had a 2:1 ratio of applications to awarded projects Single AHP Round funded 23 projects with $12.5M in subsidy (596 affordable units) Grants awarded include: New construction of housing for seniors Habitat for Humanity homes Apartments for individuals with special needs Transitional housing for young women aging out of foster care $5.3M impacting 755 households were disbursed as part of our homeownership initiatives programs AHP 2011 Award Summary 15

Competitive AHP $9 M Homeownership Initiatives $5 M HOP NSA NIP 2012 AHP Allocation - $13.8 Million 16


18 Capital Performance 12.7% 10.5% 7.5% 7.5% 6.3% 6.1% 6.1% 5.6% 5.3% 4.6% 4.0% 2.6% 6.6% 0.0% 2.0% 4.0% 6.0% 8.0% 10.0% 12.0% 14.0% CHI SF IN NY CIN TOP BOS DAL SEA DSM ATL PIT SYS Return on Average Equity June 30 YTD Annualized

19 Well Capitalized as of 6.30.12 11.4% 8.3% 8.2% 6.8% 6.5% 5.9% 5.8% 5.7% 5.6% 5.4% 5.1% 5.0% 6.8% 0.0% 2.0% 4.0% 6.0% 8.0% 10.0% 12.0% SF BOS SEA PIT IN CIN CHI DSM NY ATL TOP DAL SYS Regulatory Capital Ratios

Growth in Advances 20 23.5% 9.8% 9.5% 5.0% 3.3% 2.2% 1.9% 1.3% -0.1% -5.9% -15.3% -17.7% 0.1% -30% -20% -10% 0% 10% 20% 30% CIN PIT NY BOS CHI DAL TOP IN DSM ATL SEA SF SYS June 2011 June 2012

Increased Regulatory and OF Expense 21 $ in millions FHFA & OF expenses per the FHLB Call Report System. $0 $1 $2 $3 $4 $5 $6 $7 $0 $20 $40 $60 $80 $100 $120 $140 2006 2007 2008 2009 2010 2011 System IN

Regulatory Reform - Fannie & Freddie 22 Losses have moderated Recognized need for mortgage liquidity Not a crisis Competing interests No clear path FHLB Position…

FHLB System Summary 23 Advance demand is returning Capital is strong and growing OTTI charges on PLMBS are down significantly having less impact on earnings vs. prior 3 years While earnings remain strong, FHLBs are challenged by growing operating expenses to meet business and regulatory needs System earned $1.3B in first half of 2012

Strong core earnings Solid regulatory capital position Growing retained earnings Dividends well above LIBOR Successful MPP Advantage Fulfilling mission in support of housing and economic development Maintaining high level of customer service to support your business needs FHLBI Performance Highlights 24

Questions? Safe Harbor Statement This presentation contains forward-looking statements concerning plans, objectives, goals, strategies, future events or performance, which are not statements of historical fact. The forward-looking statements contained in this release reflect our current beliefs and expectations. Actual results or performance may differ materially from what is expressed in the forward-looking statements. You are referred to the documents filed by us with the SEC, specifically reports on Form 10-K and Form 10-Q including risk factors that could cause actual results to differ from forward-looking statements. These reports are available at www.sec.gov. The financial information contained within this presentation is unaudited.
