Attached files
| file | filename |
|---|---|
| EX-31.2 - EX-31.2 - ACL I Corp | d393580dex312.htm |
| EX-32.1 - EX-32.1 - ACL I Corp | d393580dex321.htm |
| EX-32.2 - EX-32.2 - ACL I Corp | d393580dex322.htm |
| EX-31.1 - EX-31.1 - ACL I Corp | d393580dex311.htm |
Table of Contents
UNITED STATES
SECURITIES AND EXCHANGE COMMISSION
WASHINGTON, D.C. 20549
Form 10-Q
| x | QUARTERLY REPORT PURSUANT TO SECTION 13 OR 15(d) OF THE SECURITIES EXCHANGE ACT OF 1934 |
For the quarterly period ended June 30, 2012
OR
| ¨ | TRANSITION REPORT PURSUANT TO SECTION 13 OR 15(d) OF THE SECURITIES EXCHANGE ACT OF 1934 |
For the transition period from to
Commission File Number: 333-178345
ACL I CORPORATION
(Exact name of registrant as specified in its charter)
| Delaware | 27-4241534 | |
| (State or other jurisdiction of incorporation or organization) |
(I.R.S. Employer Identification No.) | |
| 1701 E. Market Street, Jeffersonville, Indiana |
47130 | |
| (Address of principal executive offices) | (Zip Code) | |
(812) 288-0100
(Registrant’s telephone number, including area code)
Former name, former address and former fiscal year, if changed since last report:
N/A
Indicate by check mark whether the registrant (1) has filed all reports required to be filed by Section 13 or 15(d) of the Securities Exchange Act of 1934 during the preceding 12 months (or for such shorter period that the registrant was required to file such reports), and (2) has been subject to such filing requirements for the past 90 days. Yes ¨ No x.
Indicate by check mark whether the registrant has submitted electronically and posted on its corporate Website, if any, every Interactive Data File required to be submitted and posted pursuant to Rule 405 of Regulation S-T (§232.405 of this chapter) during the preceding 12 months (or for such shorter period that the registrant was required to submit and post such files). Yes x No ¨
Indicate by check mark whether the registrant is a large accelerated filer, an accelerated filer, a non-accelerated filer, or a smaller reporting company. See definitions of “large accelerated filer,” “accelerated filer” and “smaller reporting company” in Rule 12b-2 of the Exchange Act.
| Large accelerated filer | ¨ | Accelerated filer | ¨ | |||
| Non-accelerated filer | x (Do not check if a smaller reporting company) | Smaller reporting company | ¨ | |||
Indicate by check mark whether the registrant is a shell company (as defined in Rule 12b-2 of the Exchange Act). Yes ¨ No x
Indicate the number of shares outstanding of each of the issuer’s classes of common stock, as of the latest practicable date. Not applicable.
Table of Contents
ACL I CORPORATION
QUARTERLY REPORT ON FORM 10-Q
FOR THE QUARTERLY PERIOD ENDED JUNE 30, 2012
| Page | ||||
| 3 | ||||
| 3 | ||||
| 3 | ||||
| 4 | ||||
| 5 | ||||
| 6 | ||||
| 7 | ||||
| 8 | ||||
| Item 2: Management’s Discussion and Analysis of Financial Condition and Results of Operations |
19 | |||
| Item 3: Quantitative and Qualitative Disclosures About Market Risk |
37 | |||
| 37 | ||||
| 37 | ||||
| 37 | ||||
| 37 | ||||
| Item 2: Unregistered Sales of Equity Securities and Use of Proceeds |
39 | |||
| 39 | ||||
| 39 | ||||
| 39 | ||||
| 40 | ||||
| 41 | ||||
| Certification by CEO |
||||
| Certification by CFO |
||||
| Certification by CEO |
||||
| Certification by CFO |
||||
| EX-31.1 |
||||
| EX-31.2 |
||||
| EX-32.1 |
||||
| EX-32.2 |
||||
2
Table of Contents
PART I — FINANCIAL INFORMATION
| ITEM 1. | FINANCIAL STATEMENTS |
CONDENSED CONSOLIDATED STATEMENTS OF OPERATIONS
(Unaudited — In thousands)
| Three Months Ended June 30, 2012 |
Three Months Ended June 30, 2011 |
Six Months Ended June 30, 2012 |
Six Months Ended June 30, 2011 |
|||||||||||||
| Revenues |
||||||||||||||||
| Transportation and Services |
$ | 174,196 | $ | 163,317 | $ | 356,469 | $ | 324,443 | ||||||||
| Manufacturing |
44,475 | 36,547 | 80,339 | 52,554 | ||||||||||||
|
|
|
|
|
|
|
|
|
|||||||||
| Revenues |
218,671 | 199,864 | 436,808 | 376,997 | ||||||||||||
|
|
|
|
|
|
|
|
|
|||||||||
| Cost of Sales |
||||||||||||||||
| Transportation and Services |
147,715 | 167,673 | 309,157 | 325,930 | ||||||||||||
| Manufacturing |
40,629 | 35,001 | 71,640 | 51,445 | ||||||||||||
|
|
|
|
|
|
|
|
|
|||||||||
| Cost of Sales |
188,344 | 202,674 | 380,797 | 377,375 | ||||||||||||
|
|
|
|
|
|
|
|
|
|||||||||
| Gross Profit (Loss) |
30,327 | (2,810 | ) | 56,011 | (378 | ) | ||||||||||
| Selling, General and Administrative Expenses |
12,507 | 13,017 | 22,728 | 31,093 | ||||||||||||
|
|
|
|
|
|
|
|
|
|||||||||
| Operating Income (Loss) |
17,820 | (15,827 | ) | 33,283 | (31,471 | ) | ||||||||||
|
|
|
|
|
|
|
|
|
|||||||||
| Other Expense (Income) |
||||||||||||||||
| Interest Expense |
16,487 | 15,505 | 32,767 | 26,864 | ||||||||||||
| Other, Net |
(265 | ) | (213 | ) | (303 | ) | (344 | ) | ||||||||
|
|
|
|
|
|
|
|
|
|||||||||
| Other Expense |
16,222 | 15,292 | 32,464 | 26,520 | ||||||||||||
|
|
|
|
|
|
|
|
|
|||||||||
| Income (Loss) from Continuing Operations Before Income Taxes |
1,598 | (31,119 | ) | 819 | (57,991 | ) | ||||||||||
| Income Taxes (Benefit) |
739 | (10,193 | ) | 580 | (20,652 | ) | ||||||||||
|
|
|
|
|
|
|
|
|
|||||||||
| Income (Loss) from Continuing Operation |
859 | (20,926 | ) | 239 | (37,339 | ) | ||||||||||
| Discontinued Operations, Net of Tax |
— | 134 | 26 | 37 | ||||||||||||
|
|
|
|
|
|
|
|
|
|||||||||
| Net Income (Loss) |
$ | 859 | $ | (20,792 | ) | $ | 265 | $ | (37,302 | ) | ||||||
|
|
|
|
|
|
|
|
|
|||||||||
The accompanying notes are an integral part of the condensed consolidated financial statements.
3
Table of Contents
CONDENSED CONSOLIDATED STATEMENTS OF COMPREHENSIVE INCOME
(Unaudited — In thousands)
| Three Months Ended June 30, | Six Months Ended June 30, | |||||||||||||||
| 2012 | 2011 | 2012 | 2011 | |||||||||||||
| Net Income (Loss) |
$ | 859 | $ | (20,792 | ) | $ | 265 | $ | (37,302 | ) | ||||||
| Other Comprehensive (Loss) Income |
||||||||||||||||
| Change in fair value of cash flow hedges, net of tax provisions of $2,196 and $2,879 for three months and $806 and $(1,290) for the six months ended June 30, 2012 and 2011 |
(3,594 | ) | (3,657 | ) | (1,320 | ) | 2,856 | |||||||||
| Other |
— | — | (77 | ) | — | |||||||||||
|
|
|
|
|
|
|
|
|
|||||||||
| Other Comprehensive (Loss) Income |
(3,594 | ) | (3,657 | ) | (1,397 | ) | 2,856 | |||||||||
|
|
|
|
|
|
|
|
|
|||||||||
| Total Comprehensive Loss |
$ | (2,735 | ) | $ | (24,449 | ) | $ | (1,132 | ) | $ | (34,446 | ) | ||||
|
|
|
|
|
|
|
|
|
|||||||||
The accompanying notes are an integral part of the condensed consolidated financial statements.
4
Table of Contents
CONDENSED CONSOLIDATED BALANCE SHEETS
(In thousands)
| June 30, 2012 |
December 31, 2011 |
|||||||
| ASSETS |
||||||||
| Current Assets |
||||||||
| Cash and Cash Equivalents |
$ | 1,982 | $ | 1,388 | ||||
| Accounts Receivable, Net |
78,810 | 87,368 | ||||||
| Inventory |
57,295 | 62,483 | ||||||
| Deferred Tax Asset |
1,633 | 6,390 | ||||||
| Assets Held for Sale |
1,612 | 1,612 | ||||||
| Prepaid and Other Current Assets |
21,060 | 19,328 | ||||||
|
|
|
|
|
|||||
| Total Current Assets |
162,392 | 178,569 | ||||||
| Properties, Net |
933,435 | 935,576 | ||||||
| Investment in Equity Investees |
6,631 | 6,470 | ||||||
| Accounts Receivable, Related Parties, Net |
11,623 | 11,725 | ||||||
| Goodwill |
17,692 | 17,692 | ||||||
| Other Assets |
48,464 | 54,759 | ||||||
|
|
|
|
|
|||||
| Total Assets |
$ | 1,180,237 | $ | 1,204,791 | ||||
|
|
|
|
|
|||||
| LIABILITIES |
||||||||
| Current Liabilities |
||||||||
| Accounts Payable |
$ | 41,694 | $ | 48,653 | ||||
| Accrued Payroll and Fringe Benefits |
12,870 | 20,035 | ||||||
| Deferred Revenue |
14,967 | 15,251 | ||||||
| Accrued Claims and Insurance Premiums |
11,604 | 13,823 | ||||||
| Accrued Interest |
24,522 | 22,978 | ||||||
| Customer Deposits |
590 | 1,165 | ||||||
| Other Current Liabilities |
29,536 | 29,104 | ||||||
|
|
|
|
|
|||||
| Total Current Liabilities |
135,783 | 151,009 | ||||||
| Long Term Debt |
650,770 | 644,829 | ||||||
| Pension and Post Retirement Liabilities |
65,839 | 67,531 | ||||||
| Deferred Tax Liability |
163,457 | 168,365 | ||||||
| Other Long Term Liabilities |
39,276 | 46,335 | ||||||
|
|
|
|
|
|||||
| Total Liabilities |
1,055,125 | 1,078,069 | ||||||
|
|
|
|
|
|||||
| SHAREHOLDER’S EQUITY |
||||||||
| Other Capital |
190,174 | 190,651 | ||||||
| Retained Deficit |
(38,506 | ) | (38,770 | ) | ||||
| Accumulated Other Comprehensive Income |
(26,556 | ) | (25,159 | ) | ||||
|
|
|
|
|
|||||
| Total Shareholder’s Equity |
125,112 | 126,722 | ||||||
|
|
|
|
|
|||||
| Total Liabilities and Shareholder’s Equity |
$ | 1,180,237 | $ | 1,204,791 | ||||
|
|
|
|
|
|||||
The accompanying notes are an integral part of the condensed consolidated financial statements.
5
Table of Contents
CONDENSED CONSOLIDATED STATEMENTS OF CASH FLOWS
(Unaudited — In thousands)
| Six Months Ended June 30, 2012 |
Six Months Ended June 30, 2011 |
|||||||
| OPERATING ACTIVITIES |
||||||||
| Net Income (Loss) |
$ | 265 | $ | (37,302 | ) | |||
| Adjustments to Reconcile Net Income (Loss) to Net Cash |
||||||||
| Provided by (Used in) Operating Activities: |
||||||||
| Depreciation and Amortization |
54,206 | 55,432 | ||||||
| Debt Issuance Cost and Debt Discount Amortization |
343 | (228 | ) | |||||
| Deferred Taxes |
(5,600 | ) | (25,861 | ) | ||||
| Gain on Property Dispositions |
(7,896 | ) | (1,328 | ) | ||||
| Contribution to Defined Benefit Plan |
(3,258 | ) | — | |||||
| Share-Based Compensation |
84 | 1,815 | ||||||
| Other Operating Activities |
(2,117 | ) | (5,285 | ) | ||||
| Changes in Operating Assets and Liabilities: |
||||||||
| Accounts Receivable |
8,558 | 8,919 | ||||||
| Inventory |
5,188 | (30,427 | ) | |||||
| Other Current Assets |
1,360 | 10,731 | ||||||
| Accounts Payable |
(7,737 | ) | 1,359 | |||||
| Accrued Interest |
16,571 | 10,794 | ||||||
| Other Current Liabilities |
(8,799 | ) | (4,595 | ) | ||||
|
|
|
|
|
|||||
| Net Cash Provided by (Used in) Operating Activities |
51,168 | (15,976 | ) | |||||
| INVESTING ACTIVITIES |
||||||||
| Property Additions |
(84,047 | ) | (16,109 | ) | ||||
| Proceeds from Property Dispositions |
15,446 | 3,307 | ||||||
| Impact of Barge Scrapping Operations |
26,565 | 1,771 | ||||||
| Other Investing Activities |
(1,778 | ) | (5,642 | ) | ||||
|
|
|
|
|
|||||
| Net Cash Used in Investing Activities |
(43,814 | ) | (16,673 | ) | ||||
| FINANCING ACTIVITIES |
||||||||
| 2016 PIK Toggle Notes Issued |
— | 250,000 | ||||||
| Discount on 2016 PIK Toggle Notes |
— | (4,375 | ) | |||||
| Revolving Credit Facility Borrowings (Repayments) |
(6,726 | ) | 35,736 | |||||
| Bank Overdrafts on Operating Accounts |
779 | 1,452 | ||||||
| Debt Issuance/Refinancing Costs |
(335 | ) | (11,184 | ) | ||||
| Dividends Paid |
(478 | ) | (240,812 | ) | ||||
| Tax Benefit of Share-Based Compensation |
— | 213 | ||||||
|
|
|
|
|
|||||
| Net Cash (Used in) Provided by Financing Activities |
(6,760 | ) | 31,030 | |||||
| Net Increase (Decrease) in Cash and Cash Equivalents |
594 | (1,619 | ) | |||||
| Cash and Cash Equivalents at Beginning of Period |
1,388 | 3,707 | ||||||
|
|
|
|
|
|||||
| Cash and Cash Equivalents at End of Period |
$ | 1,982 | $ | 2,088 | ||||
|
|
|
|
|
|||||
The accompanying notes are an integral part of the condensed consolidated financial statements.
6
Table of Contents
CONDENSED CONSOLIDATED STATEMENT OF SHAREHOLDER’S EQUITY
(Unaudited — In thousands)
| Other Capital |
Retained Deficit |
Accumulated Other Comprehensive Loss |
Total | |||||||||||||
| Balance at December 31, 2011 |
$ | 190,651 | $ | (38,770 | ) | $ | (25,159 | ) | $ | 126,722 | ||||||
| Dividends Paid |
(478 | ) | — | — | (478 | ) | ||||||||||
| Comprehensive Loss: |
||||||||||||||||
| Net Income |
— | 265 | — | 265 | ||||||||||||
| Net Loss on Fuel Swaps Designated as Cash Flow Hedging Instrument, Net of Tax Benefit of $806 |
— | — | (1,320 | ) | (1,320 | ) | ||||||||||
| Other |
1 | (1 | ) | (77 | ) | (77 | ) | |||||||||
|
|
|
|
|
|
|
|
|
|||||||||
| Total Comprehensive Loss |
(1,132 | ) | ||||||||||||||
|
|
|
|
|
|
|
|
|
|||||||||
| Balance at June 30, 2012 |
$ | 190,174 | $ | (38,506 | ) | $ | (26,556 | ) | $ | 125,112 | ||||||
|
|
|
|
|
|
|
|
|
|||||||||
The accompanying notes are an integral part of the condensed consolidated financial statements.
7
Table of Contents
NOTES TO CONDENSED CONSOLIDATED FINANCIAL STATEMENTS
(Unaudited)
(Dollars in thousands, except per share data)
Note 1. Reporting Entity and Accounting Policies
ACL I Corporation (“ACL I”) is a Delaware corporation. ACL I is a wholly owned subsidiary of Finn Holding Corporation (“Finn”). Finn is primarily owned by certain affiliates of Platinum Equity, LLC (certain affiliates of Platinum Equity, LLC are referred to as “Platinum”). On December 21, 2010, the acquisition of American Commercial Lines Inc. (“ACL”) by Platinum (the “Acquisition”) was consummated. The assets of ACL I consist principally of its ownership of all of the stock of ACL which owns all of the stock of Commercial Barge Line Company (“CBL”). CBL does not conduct any operations independent of its ownership of all of the equity interests in American Commercial Lines LLC (“ACL LLC”), ACL Transportation Services LLC (“ACLTS”), and Jeffboat LLC (“Jeffboat”), Delaware limited liability companies, and ACL Professional Services, Inc., a Delaware corporation, and their subsidiaries.
The Acquisition was accomplished through the merger of Finn Merger Corporation (“Finn Merger”), a Delaware corporation and a wholly owned subsidiary of ACL I with and into ACL. Following the Acquisition, ACL I files as part of the consolidated federal tax return of its direct parent, Finn. In these condensed consolidated financial statements, unless the context indicates otherwise, the “Company” refers to ACL I and its subsidiaries, on a consolidated basis.
The operations of the Company include barge transportation together with related port services along the United States Inland Waterways consisting of the Mississippi River System, the Ohio River and the Illinois River and their tributaries and the Gulf Intracoastal Waterway (collectively the “Inland Waterways”) and marine equipment manufacturing. Barge transportation accounts for the majority of the Company’s revenues and includes the movement of bulk products, grain, coal, steel and liquids in the United States. The Company has long-term contracts with many of its customers. Manufacturing of marine equipment is provided to customers in marine transportation and other related industries in the United States. Until its sale in December 2011, the Company also owned Elliott Bay Design Group (“EBDG”), an operation engaged in naval architecture and engineering which was significantly smaller than the transportation or manufacturing segments. The results of operations of EBDG have been reclassified into discontinued operations for all periods presented.
The accompanying unaudited condensed consolidated financial statements have been prepared in accordance with generally accepted accounting principles for interim financial information and in accordance with the instructions to Form 10-Q and Article 10 of Regulation S-X. As such, they do not include all of the information and footnotes required by generally accepted accounting principles for complete financial statements. The condensed consolidated balance sheet as of December 31, 2011 has been derived from the audited consolidated balance sheet at that date. The preparation of financial statements in conformity with accounting principles generally accepted in the United States requires management to make estimates and assumptions that affect the reported amounts of assets and liabilities and disclosure of contingent assets and liabilities at the date of the financial statements and the reported amounts of revenues and expenses during the reporting period. Actual results could differ from those estimates. Some of the significant estimates underlying these financial statements include reserves for doubtful accounts, reserves for obsolete and slow moving inventories, pension and post-retirement liabilities, incurred but not reported medical claims, insurance claims and related receivable amounts, deferred tax liabilities, assets held for sale, environmental liabilities, revenues and expenses on special vessels using the percentage-of-completion method, environmental liabilities, valuation allowances related to deferred tax assets, expected forfeitures of share-based compensation, estimates of future cash flows used in impairment evaluations, liabilities for unbilled barge and boat maintenance, liabilities for unbilled harbor and towing services, estimated sub-lease recoveries and depreciable lives of long-lived assets.
In the opinion of management, for all periods presented, all adjustments (consisting of normal recurring accruals) considered necessary for a fair presentation have been included. Operating results for the interim periods presented herein are not necessarily indicative of the results that may be expected for the year ending December 31, 2012. Our quarterly revenues and profits historically have been lower during the first six months of the year and higher in the last six months of the year due primarily to the timing of the North American grain harvest and seasonal weather patterns.
Periodically the Financial Accounting Standards Board (“FASB”) issues additional Accounting Standards Updates (“ASUs”). ASUs considered to have a potential impact on the Company where the impact is not yet determined are discussed as follows.
ASU Number 2011-5 was issued in June 2011, amending Topic 220 — Comprehensive Income. The ASU modifies alternative presentation standards, eliminating the option for disclosure of the elements of other comprehensive income within the statement of stockholder’s equity. Adoption of this ASU by the Company changed our previous presentation, but will not impact the components of other comprehensive income. The ASU is effective for fiscal periods beginning after December 15, 2011. ASU Number 2011-12 subsequently modified the effective date of certain provisions of the ASU concerning whether it is necessary to require entities to present reclassification adjustments by component in both the statement where net income is presented and the statement where other comprehensive income is presented for both interim and annual financial statements, reverting to earlier guidance until the Board completes its deliberations on the requested changes. The ASU, as modified, is effective for fiscal periods beginning after December 15, 2011.
8
Table of Contents
ACL I CORPORATION
NOTES TO CONDENSED CONSOLIDATED FINANCIAL STATEMENTS (Continued)
ASU Number 2011-8 was issued in September 2011, amending Topic 350 Intangibles — Goodwill and Other. The ASU allows entities to first assess qualitative factors to determine whether the existence of events or circumstances lead to a determination that it is more likely than not that the fair value of a reporting unit is less than its carrying value, whereas previous guidance required as the first step in an at least annual evaluation a computation of the fair value of a reporting entity. The Company has not yet determined if it will use the qualitative assessment in 2012. The ASU is effective for fiscal periods beginning after December 15, 2011.
Certain prior year amounts have been reclassified in these condensed consolidated financial statements to conform to the current year presentation. These reclassifications had no impact on previously reported net income.
Note 2. Debt
| June 30, 2012 | December 31, 2011 | |||||||
| Credit Facility |
$ | 148,352 | $ | 155,078 | ||||
| 2017 Notes |
200,000 | 200,000 | ||||||
| Plus Unamortized Purchase Premium |
26,351 | 29,147 | ||||||
| PIK Notes |
279,246 | 264,219 | ||||||
| Less Discount |
(3,179 | ) | (3,615 | ) | ||||
|
|
|
|
|
|||||
| Long Term Debt |
$ | 650,770 | $ | 644,829 | ||||
|
|
|
|
|
|||||
Concurrent with the Acquisition, on December 21, 2010, ACL, CBL, ACL LLC, ACLTS and Jeffboat (the “Borrowers”) entered into a senior secured asset-based revolving credit facility (“Credit Facility”) which provides for borrowing capacity of up to an aggregate principal amount of $475,000 with a final maturity date of December 21, 2015. Proceeds of the Credit Facility are available for use by the Borrowers and, subject to certain limitations, their subsidiaries for working capital and general corporate purposes. At the Acquisition, proceeds of the Credit Facility were used, in part, to fund the liquidation of ACL’s previous facility and certain expenses associated with the Acquisition.
The Borrowers may also use the Credit Facility to issue letters of credit up to a total of $50,000. Availability under the Credit Facility is capped at a borrowing base, calculated based on certain percentages of the value of the Company’s vessels, inventory and receivables and subject to certain blocks and reserves, all as further set forth in the Credit Facility agreement. The Borrowers are currently prohibited from incurring more than $390,000 of indebtedness under the Credit Facility regardless of the size of the borrowing base until (a) all of the obligations (other than unasserted contingent obligations) under the indenture governing the 2017 Notes (defined below) are repaid, defeased, discharged or otherwise satisfied or (b) the indenture governing the 2017 Notes is replaced or amended or otherwise modified in a manner such that additional borrowings would be permitted. At the Borrowers’ option, the Credit Facility may be increased by $75,000, subject to certain requirements set forth in the Credit Facility agreement (“Credit Agreement”).
In accordance with the Credit Agreement, the Borrowers’ obligations under the Credit Facility are secured by, among other things, a lien on substantially all of their tangible and intangible personal property (including but not limited to vessels, accounts receivable, inventory, equipment, general intangibles, investment property, deposit and securities accounts, certain owned real property and intellectual property) and a pledge of the capital stock of each of ACL’s wholly owned restricted domestic subsidiaries, subject to certain exceptions and thresholds.
On February 15, 2011, ACL I completed a private placement of $250,000 in aggregate principal amount of 10.625%/11.375% Senior Payment in Kind (“PIK”) Toggle Notes due 2016 (the “PIK Notes”). Interest on the PIK Notes will accrue at a rate of 10.625% with respect to interest paid in cash and a rate of 11.375% with respect to interest paid by issuing additional PIK Notes. Selection of the interest payment method is solely a decision of ACL I. At the first interest payment date ACL I elected PIK interest, increasing the amount of PIK Notes outstanding by $14,219 to $264,219. On the second payment date ACL I also elected PIK interest which increased the PIK Notes by $15,027 to $279,246. The net of original issue discount proceeds of the PIK Notes offering were used primarily to pay a special dividend to ACL I’s stockholder to redeem equity advanced in connection with the acquisition of ACL by an affiliate of Platinum Equity, LLC and to pay certain costs and expenses related to the PIK Notes offering. The PIK Notes were registered effective May 10, 2012 and the exchange offer was completed on June 11, 2012. The PIK Notes are unsecured and are not guaranteed by ACL I’s subsidiaries.
On July 7, 2009, CBL issued $200,000 aggregate principal amount of senior secured second lien 12.5 % notes due July 15, 2017 (the “2017 Notes”). The issue price was 95.181% of the principal amount of the 2017 Notes. The 2017 Notes are guaranteed by ACL and by all material existing and future domestic subsidiaries of CBL. At the Acquisition date the fair value of the 2017 Notes was $35,000 higher than the face amount. This amount is being amortized to interest expense using the effective interest method over the remaining life of the 2017 Notes.
9
Table of Contents
ACL I CORPORATION
NOTES TO CONDENSED CONSOLIDATED FINANCIAL STATEMENTS (Continued)
The Credit Facility has no financial covenants unless borrowing availability is generally less than a certain defined level set forth in the Credit Agreement. The $240,403 in borrowing availability at June 30, 2012, exceeds the specified level by approximately $191,603. Should the springing covenants be triggered, the leverage calculation would include only first lien senior debt, excluding debt under the 2017 Notes. The 2017 Notes and Credit Facility also provide flexibility to execute sale leasebacks, sell assets and issue additional debt to raise additional funds. In addition, the Credit Facility places no direct restrictions on capital spending, but, subject to certain exceptions for redeemable capital interests, management benefit plans and stock dividends, as well as a $20,000 allowance for such payments, does limit the payment of cash dividends to a level equal to half of cumulative consolidated net income since July 1, 2009 plus the aggregate amount of any new capital contributions or equity offering proceeds. Outstanding redeemable capital interests and management benefit plans are not significant in amount at June 30, 2012, and, since July 1, 2009, there has been no available cumulative consolidated net income through June 30, 2012. No new capital contributions or equity offerings were made since the Acquisition. Borrowings under the Credit Agreement bear interest, at the Borrowers’ option, at either (i) an alternate base rate or an adjusted LIBOR rate plus, in each case, an applicable margin. Such applicable margin will, depending on average availability under the Credit Facility, range from 2.00% to 2.50% in the case of base rate loans and 2.75% to 3.25% in the case of LIBOR rate loans. Interest is payable (a) in the case of base rate loans, monthly in arrears, and (b) in the case of LIBOR rate loans, at the end of each interest period, but in no event less often than every three months. A commitment fee is payable monthly in arrears at a rate per annum equal to 0.50% of the daily unused amount of the commitments in respect of the Credit Facility. The Borrowers, at their option, may prepay borrowings under the Credit Facility and re-borrow such amounts, at any time (subject to applicable borrowing conditions) without penalty, in whole or in part, in minimum amounts and subject to other conditions set forth in the Credit Facility. For any period that availability is less than a certain defined level set forth in the Credit Agreement and until no longer less than such level for a 30-day period, the Credit Agreement imposes several financial covenants on CBL and its subsidiaries, including (a) a minimum fixed charge coverage ratio (as defined in the Credit Agreement) of at least 1.1 to 1; and (b) a maximum first lien leverage ratio of 4.25 to 1.0. The Credit Agreement requires that CBL and its subsidiaries comply with covenants relating to customary matters (in addition to those financial covenants described above), including with respect to incurring indebtedness and liens, using the proceeds received under the Credit Agreement, transactions with affiliates, making investments and acquisitions, effecting mergers and asset sales, prepaying indebtedness, and paying dividends.
During all periods presented the Company has been in compliance with the respective covenants contained in the Credit Facility.
Note 3. Inventory
Inventory is carried at the lower of cost (based on a weighted average method) or market and consists of the following.
| June 30, 2012 |
December 31, 2011 |
|||||||
| Raw Materials |
$ | 31,251 | $ | 26,865 | ||||
| Work in Process |
2,630 | 8,232 | ||||||
| Parts and Supplies |
23,414 | 27,386 | ||||||
|
|
|
|
|
|||||
| $ | 57,295 | $ | 62,483 | |||||
|
|
|
|
|
|||||
Note 4. Income Taxes
ACL I’s operating entities are primarily single member limited liability companies that are owned by a corporate parent and are subject to U.S. federal and state income taxes on a combined basis. The effective tax rates in the three month periods ended June 30, 2012 and 2011 were 46.3% and 32.8%, respectively. The effective tax rates in the six-month periods ended June 30, 2012 and 2011 were 70.8% and 35.6%, respectively. The effective income tax rates are impacted by the significance of consistent levels of permanent book and tax differences on expected full year income in the respective periods. There is no tax-sharing agreement with the other companies included in the Finn consolidated return filing and therefore the tax attributes of the Company are stated on a stand-alone basis.
10
Table of Contents
ACL I CORPORATION
NOTES TO CONDENSED CONSOLIDATED FINANCIAL STATEMENTS (Continued)
Note 5. Employee Benefit Plans
A summary of the components of the Company’s pension and post-retirement plans follows.
| Three Months Ended June 30, |
Six Months Ended June 30, |
|||||||||||||||
| 2012 | 2011 | 2012 | 2011 | |||||||||||||
| Pension Components: |
||||||||||||||||
| Service cost |
$ | 1,140 | $ | 1,120 | $ | 2,280 | $ | 2,240 | ||||||||
| Interest cost |
2,645 | 2,634 | 5,290 | 5,268 | ||||||||||||
| Expected return on plan assets |
(3,460 | ) | (3,250 | ) | (6,920 | ) | (6,500 | ) | ||||||||
| Amortization of unrecognized losses |
443 | — | 886 | — | ||||||||||||
|
|
|
|
|
|
|
|
|
|||||||||
| Net periodic benefit cost |
$ | 768 | $ | 504 | $ | 1,536 | $ | 1,008 | ||||||||
|
|
|
|
|
|
|
|
|
|||||||||
| Post-retirement Components: |
||||||||||||||||
| Service cost |
$ | 3 | $ | 3 | $ | 6 | $ | 6 | ||||||||
| Interest cost |
45 | 55 | 90 | 110 | ||||||||||||
|
|
|
|
|
|
|
|
|
|||||||||
| Net periodic benefit cost |
$ | 48 | $ | 58 | $ | 96 | $ | 116 | ||||||||
|
|
|
|
|
|
|
|
|
|||||||||
Note 6. Related Party Transactions
There were no related party freight revenues in the three and six month periods ended June 30, 2012 and 2011 and there were no related party receivables included in accounts receivable on the condensed consolidated balance sheets at June 30, 2012 and December 31, 2011, except those contained in the caption Accounts Receivable, Related Parties, Net related to the receivable from Finn in connection with the Acquisition and certain subsequent payments associated with the wind-down of the pre-Acquisition share-based compensation plan. Since the Acquisition, additional vesting of certain pre-Acquisition share-based awards has occurred and, per the terms of the Omnibus Plan, all awards previously granted to executives separating without cause from the Company within one year after the Acquisition date became fully vested. Finn redeemed certain of these shares. Dividends from the Company were declared and paid to Finn in amounts sufficient to fund these redemptions. These dividends reduced the Accounts Receivable, Related Parties, Net balance.
During the first quarter of 2012 and in the second quarter of 2011 the Company paid an annual management fee of $5,000 to Platinum. The management fee is amortized to selling, general and administrative expense over the course of the respective fiscal year.
Note 7. Business Segments
The Company has two reportable business segments: transportation and manufacturing. The Company’s transportation segment includes barge transportation operations and fleeting facilities that provide fleeting, shifting, cleaning and repair services at various locations along the Inland Waterways. The manufacturing segment constructs marine equipment for external customers as well as for the Company’s transportation segment.
Management evaluates performance based on a variety of measures including segment earnings, which is defined as operating income. The accounting policies of the reportable segments are consistent with those described in the summary of significant accounting policies described in ACL I’s filing on Form S-4/A filed May 8, 2012.
Intercompany sales are transferred at the lower of cost or fair market value and intersegment profit is eliminated upon consolidation.
Reportable segments are business units that offer different products or services. The reportable segments are managed separately because they provide distinct products and services to internal and external customers.
11
Table of Contents
ACL I CORPORATION
NOTES TO CONDENSED CONSOLIDATED FINANCIAL STATEMENTS (Continued)
| Reportable Segments | All
Other Segments |
Intersegment Eliminations |
Total | |||||||||||||||||
| Transportation | Manufacturing | |||||||||||||||||||
| Three Months ended June 30, 2012 |
||||||||||||||||||||
| Total revenue |
$ | 174,387 | $ | 54,627 | $ | — | $ | (10,343 | ) | $ | 218,671 | |||||||||
| Intersegment revenues |
191 | 10,152 | — | (10,343 | ) | — | ||||||||||||||
|
|
|
|
|
|
|
|
|
|
|
|||||||||||
| Revenue from external customers |
174,196 | 44,475 | — | — | 218,671 | |||||||||||||||
| Operating expense |
||||||||||||||||||||
| Materials, supplies and other |
46,800 | — | — | — | 46,800 | |||||||||||||||
| Rent |
6,699 | — | — | — | 6,699 | |||||||||||||||
| Labor and fringe benefits |
28,123 | — | — | — | 28,123 | |||||||||||||||
| Fuel |
39,518 | — | — | — | 39,518 | |||||||||||||||
| Depreciation and amortization |
25,235 | — | — | — | 25,235 | |||||||||||||||
| Taxes, other than income taxes |
2,843 | — | — | — | 2,843 | |||||||||||||||
| Gain on disposition of equipment |
(1,503 | ) | — | — | — | (1,503 | ) | |||||||||||||
| Cost of goods sold |
— | 40,629 | — | — | 40,629 | |||||||||||||||
|
|
|
|
|
|
|
|
|
|
|
|||||||||||
| Total cost of sales |
147,715 | 40,629 | — | — | 188,344 | |||||||||||||||
| Selling, general & administrative |
11,358 | 1,149 | — | 12,507 | ||||||||||||||||
|
|
|
|
|
|
|
|
|
|
|
|||||||||||
| Total operating expenses |
159,073 | 41,778 | — | — | 200,851 | |||||||||||||||
|
|
|
|
|
|
|
|
|
|
|
|||||||||||
| Operating income |
$ | 15,123 | $ | 2,697 | $ | — | $ | — | $ | 17,820 | ||||||||||
|
|
|
|
|
|
|
|
|
|
|
|||||||||||
| Reportable Segments | All
Other Segments |
Intersegment Eliminations |
Total | |||||||||||||||||
| Transportation | Manufacturing | |||||||||||||||||||
| Three Months ended June 30, 2011 |
||||||||||||||||||||
| Total revenue |
$ | 163,652 | $ | 36,600 | $ | — | $ | (388 | ) | $ | 199,864 | |||||||||
| Intersegment revenues |
335 | 53 | — | (388 | ) | — | ||||||||||||||
|
|
|
|
|
|
|
|
|
|
|
|||||||||||
| Revenue from external customers |
163,317 | 36,547 | — | — | 199,864 | |||||||||||||||
| Operating expense |
||||||||||||||||||||
| Materials, supplies and other |
61,413 | — | — | — | 61,413 | |||||||||||||||
| Rent |
6,977 | — | — | — | 6,977 | |||||||||||||||
| Labor and fringe benefits |
25,683 | — | — | — | 25,683 | |||||||||||||||
| Fuel |
45,749 | — | — | — | 45,749 | |||||||||||||||
| Depreciation and amortization |
25,908 | — | — | — | 25,908 | |||||||||||||||
| Taxes, other than income taxes |
3,246 | — | — | — | 3,246 | |||||||||||||||
| Gain on disposition of equipment |
(1,303 | ) | — | — | — | (1,303 | ) | |||||||||||||
| Cost of goods sold |
— | 35,001 | — | — | 35,001 | |||||||||||||||
|
|
|
|
|
|
|
|
|
|
|
|||||||||||
| Total cost of sales |
167,673 | 35,001 | — | — | 202,674 | |||||||||||||||
| Selling, general & administrative |
12,616 | 400 | 1 | — | 13,017 | |||||||||||||||
|
|
|
|
|
|
|
|
|
|
|
|||||||||||
| Total operating expenses |
180,289 | 35,401 | 1 | — | 215,691 | |||||||||||||||
|
|
|
|
|
|
|
|
|
|
|
|||||||||||
| Operating (loss) income |
$ | (16,972 | ) | $ | 1,146 | $ | (1 | ) | $ | — | $ | (15,827 | ) | |||||||
|
|
|
|
|
|
|
|
|
|
|
|||||||||||
12
Table of Contents
ACL I CORPORATION
NOTES TO CONDENSED CONSOLIDATED FINANCIAL STATEMENTS (Continued)
| Reportable Segments | All
Other Segments |
Intersegment Eliminations |
Total | |||||||||||||||||
| Transportation | Manufacturing | |||||||||||||||||||
| Six Months ended June 30, 2012 |
||||||||||||||||||||
| Total revenue |
$ | 356,762 | $ | 106,051 | $ | — | $ | (26,005 | ) | $ | 436,808 | |||||||||
| Intersegment revenues |
293 | 25,712 | — | (26,005 | ) | — | ||||||||||||||
|
|
|
|
|
|
|
|
|
|
|
|||||||||||
| Revenue from external customers |
356,469 | 80,339 | — | — | 436,808 | |||||||||||||||
| Operating expense |
||||||||||||||||||||
| Materials, supplies and other |
107,835 | — | — | — | 107,835 | |||||||||||||||
| Rent |
13,427 | — | — | — | 13,427 | |||||||||||||||
| Labor and fringe benefits |
56,822 | — | — | — | 56,822 | |||||||||||||||
| Fuel |
82,799 | — | — | — | 82,799 | |||||||||||||||
| Depreciation and amortization |
50,300 | — | — | — | 50,300 | |||||||||||||||
| Taxes, other than income taxes |
5,861 | — | — | — | 5,861 | |||||||||||||||
| Gain on disposition of equipment |
(7,887 | ) | — | — | — | (7,887 | ) | |||||||||||||
| Cost of goods sold |
— | 71,640 | — | — | 71,640 | |||||||||||||||
|
|
|
|
|
|
|
|
|
|
|
|||||||||||
| Total cost of sales |
309,157 | 71,640 | — | — | 380,797 | |||||||||||||||
| Selling, general & administrative |
20,560 | 2,168 | — | — | 22,728 | |||||||||||||||
|
|
|
|
|
|
|
|
|
|
|
|||||||||||
| Total operating expenses |
329,717 | 73,808 | — | — | 403,525 | |||||||||||||||
|
|
|
|
|
|
|
|
|
|
|
|||||||||||
| Operating income |
$ | 26,752 | $ | 6,531 | $ | — | $ | — | $ | 33,283 | ||||||||||
|
|
|
|
|
|
|
|
|
|
|
|||||||||||
| Reportable Segments | All
Other Segments |
Intersegment Eliminations |
Total | |||||||||||||||||
| Transportation | Manufacturing | |||||||||||||||||||
| Six Months ended June 30, 2011 |
||||||||||||||||||||
| Total revenue |
$ | 324,980 | $ | 64,581 | $ | — | $ | (12,564 | ) | $ | 376,997 | |||||||||
| Intersegment revenues |
537 | 12,027 | — | (12,564 | ) | — | ||||||||||||||
|
|
|
|
|
|
|
|
|
|
|
|||||||||||
| Revenue from external customers |
324,443 | 52,554 | — | — | 376,997 | |||||||||||||||
| Operating expense |
||||||||||||||||||||
| Materials, supplies and other |
118,256 | — | — | — | 118,256 | |||||||||||||||
| Rent |
13,964 | — | — | — | 13,964 | |||||||||||||||
| Labor and fringe benefits |
55,926 | — | — | — | 55,926 | |||||||||||||||
| Fuel |
81,572 | — | — | — | 81,572 | |||||||||||||||
| Depreciation and amortization |
51,427 | — | — | — | 51,427 | |||||||||||||||
| Taxes, other than income taxes |
6,113 | — | — | — | 6,113 | |||||||||||||||
| Gain on disposition of equipment |
(1,328 | ) | — | — | — | (1,328 | ) | |||||||||||||
| Cost of goods sold |
— | 51,445 | — | — | 51,445 | |||||||||||||||
|
|
|
|
|
|
|
|
|
|
|
|||||||||||
| Total cost of sales |
325,930 | 51,445 | — | — | 377,375 | |||||||||||||||
| Selling, general & administrative |
30,083 | 1,008 | 2 | — | 31,093 | |||||||||||||||
|
|
|
|
|
|
|
|
|
|
|
|||||||||||
| Total operating expenses |
356,013 | 52,453 | 2 | — | 408,468 | |||||||||||||||
|
|
|
|
|
|
|
|
|
|
|
|||||||||||
| Operating (loss) income |
$ | (31,570 | ) | $ | 101 | $ | (2 | ) | $ | — | $ | (31,471 | ) | |||||||
|
|
|
|
|
|
|
|
|
|
|
|||||||||||
13
Table of Contents
ACL I CORPORATION
NOTES TO CONDENSED CONSOLIDATED FINANCIAL STATEMENTS (Continued)
Note 8. Financial Instruments and Risk Management
The Company has price risk for fuel not covered by contract escalation clauses and in time periods from the date of price changes until the next monthly or quarterly contract price adjustment. From time to time the Company has utilized derivative instruments to manage volatility in addition to contracted rate adjustment clauses. For several years the Company has been entering into fuel price swaps with commercial banks. The number of gallons settled and related net gains, as well as additional gallons hedged and unrealized changes in market value are contained in the table below. At June 30, 2012, the Company has fuel price swaps with a maximum maturity of December 2012. As hedged fuel is used, any gains or losses incurred are recorded as a decrease or increase to fuel expense, a component of cost of sales.
The fair value of unsettled fuel price swaps is listed in the following table. These derivative instruments have been designated and accounted for as cash flow hedges. To the extent of their effectiveness, changes in fair value of the hedged instrument will be accounted for through other comprehensive income until the hedged fuel is used, at which time the gain or loss on the hedge instruments will be recorded as fuel expense (cost of sales). Accumulated other comprehensive loss at June 30, 2012 and December 31, 2011 of $26,556 and $25,159, respectively, consisted of gains (losses) on fuel hedging and pension and post-retirement losses, net of the related tax benefits of $16,146 and $15,417 respectively. Hedge ineffectiveness is recorded in income as a component of fuel expense as incurred.
The carrying amount and fair values of the Company’s financial instruments, which are recorded in Other Current Liabilities, are as follows.
| Description |
6/30/2012 | Fair Value of Measurements at Reporting Date Using Markets for Identical Assets (Level 1) |
||||||
| Fuel Price Swaps |
$ | (3,166 | ) | $ | (3,166 | ) | ||
At June 30, 2012, the decrease in the fair value of the financial instruments is recorded as a net payable of $3,166 in the consolidated balance sheet and as a net of tax deferred gain in other comprehensive income in the consolidated balance sheet. Hedge ineffectiveness resulted in an increase to fuel expense of $73 and $28 in the three and six months ended June 30, 2012, respectively. The fair value of the fuel price swaps is based on quoted market prices for identical instruments, or Level 1 inputs as to fair value. The Company may increase the quantity hedged or add additional months based upon active monitoring of fuel pricing outlooks by the management team.
| Gallons | Dollars | |||||||
| Fuel Price Swaps at December 31, 2011 |
19,400 | $ | (1,012 | ) | ||||
| 1st Quarter 2012 Fuel Hedge Income |
(5,900 | ) | (1,679 | ) | ||||
| 1st Quarter 2012 Changes |
— | 5,388 | ||||||
| 2nd Quarter 2012 Fuel Hedge Income |
(5,700 | ) | (603 | ) | ||||
| 2nd Quarter 2012 Changes |
1,800 | (5,260 | ) | |||||
|
|
|
|
|
|||||
| Fuel Price Swaps at June 30, 2012 |
9,600 | $ | (3,166 | ) | ||||
|
|
|
|
|
|||||
Note 9. Contingencies
The nature of our business exposes us to the potential for legal proceedings, including those relating to labor and employment, personal injury, property damage and environmental matters. Although the ultimate outcome of any legal matter cannot be predicted with certainty, based on present information, including our assessment of the merits of each particular claim, as well as our current reserves and insurance coverage, we do not expect that any known legal proceeding will in the foreseeable future have a material adverse impact on our financial condition or the results of our operations.
At June 30, 2012, approximately 760 employees of our manufacturing segment were represented by a labor union under a contract that expires on April 1, 2013. These employees are represented by General Drivers, Warehousemen and Helpers, Local Union No. 89, affiliated with the International Brotherhood of Teamsters, Chauffeurs, Warehousemen and Helpers of America, at our shipyard facility.
14
Table of Contents
ACL I CORPORATION
NOTES TO CONDENSED CONSOLIDATED FINANCIAL STATEMENTS (Continued)
Our remaining unionized employees at June 30, 2012 (approximately 20 positions) are represented by the International Union of United Mine Workers of America, District 12 — Local 2452 at ACLTS in St. Louis, Missouri under a collective bargaining agreement that expires December 31, 2013.
Although we believe that our relations with our employees and with the recognized labor unions are generally good, we cannot assure that we will be able to reach agreement on renewal terms of these contracts or that we will not be subject to work stoppages, other labor disruption or that we will be able to pass on increased costs to our customers in the future.
Shareholder Appraisal Action
On April 12, 2011, IQ Holdings, Inc. (“IQ”) filed a Verified Petition for Appraisal of Stock against ACL in the Court of Chancery in the State of Delaware (the “Delaware Court”). Among other things, the appraisal petition seeks a judicial determination of the fair value of its 250,000 shares of common stock pursuant to 8 Del. C. § 262, and an order by the Delaware Court directing ACL to pay IQ the fair value of its shares as of the effective date of the Acquisition, taxes, attorney’s fees, and costs. Trial is scheduled in October 2012. While it is not possible at this time to determine the potential outcome of this action, we do not believe the action will result in a payment by ACL that would materially affect our financial condition, operations or cash flows.
Environmental Litigation
We have been involved in the following environmental matters relating to the investigation or remediation of locations where hazardous materials have or might have been released or where we or our vendors have arranged for the disposal of wastes. These matters include situations in which we have been named or are believed to be a potentially responsible party (“PRP”) under applicable federal and state laws.
Collision Incident, Mile Marker 97 of the Mississippi River
ACL and ACL LLC, an indirect wholly owned subsidiary of ACL, have been named as defendants in the following putative class action lawsuits, filed in the United States District Court for the Eastern District of Louisiana (collectively the “Class Action Lawsuits”): Austin Sicard et al on behalf of themselves and others similarly situated vs. Laurin Maritime (America) Inc., Whitefin Shipping Co. Limited, D.R.D. Towing Company, LLC, American Commercial Lines, Inc. and the New Orleans-Baton Rouge Steamship Pilots Association, Case No. 08-4012, filed on July 24, 2008; Stephen Marshall Gabarick and Bernard Attridge, on behalf of themselves and others similarly situated vs. Laurin Maritime (America) Inc., Whitefin Shipping Co. Limited, D.R.D. Towing Company, LLC, American Commercial Lines, Inc. and the New Orleans-Baton Rouge Steamship Pilots Association, Case No. 08-4007, filed on July 24, 2008; and Alvin McBride, on behalf of himself and all others similarly situated v. Laurin Maritime (America) Inc.; Whitefin Shipping Co. Ltd.; D.R.D. Towing Co. LLC; American Commercial Lines Inc.; The New Orleans-Baton Rouge Steamship Pilots Association, Case No. 09-cv-04494 B, filed on July 24, 2009. The McBride v. Laurin Maritime, et al. action has been dismissed with prejudice because it was not filed prior to the deadline set by the United States District Court for the Eastern District of Louisiana (the “Court”). The claims in the Class Action Lawsuits stem from the incident on July 23, 2008, involving one of ACL LLC’s tank barges that was being towed by DRD Towing Company L.L.C. (“DRD”), an independent towing contractor. The tank barge was involved in a collision with the motor vessel Tintomara, operated by Laurin Maritime, at Mile Marker 97 of the Mississippi River in the New Orleans area. The tank barge was carrying approximately 9,900 barrels of #6 oil, of which approximately two-thirds was released. The tank barge was damaged in the collision and partially sunk. There was no damage to the towboat. The Tintomara incurred minor damage. The Class Action Lawsuits include various allegations of adverse health and psychological damages, disruption of business operations, destruction and loss of use of natural resources, and seek unspecified economic, compensatory and punitive damages for claims of negligence, trespass and nuisance. The Class Action Lawsuits were stayed pending the outcome of the two actions filed in the United States District Court for the Eastern District of Louisiana seeking exoneration from, or limitation of, liability related to the incident as discussed in more detail below. All claims in the Class Action Lawsuits have been settled with payment to be made from funds on deposit with the Court in the IINA and IINA and Houston Casualty Company interpleader, mentioned below. IINA is DRD’s primary insurer and IINA and Houston Casualty Company are DRD’s excess insurers. The settlement has final approval from the court. Settlement funds were provided to claimants’ counsel and we expect final dismissal of all lawsuits against all parties will be entered with prejudice once all the releases are signed. Claims under the Oil Pollution Act of 1990 (“OPA 90”) were dismissed without prejudice. There is a separate administrative process for making a claim under OPA 90 that must be followed prior to litigation. We are processing OPA 90 claims properly presented, documented and recoverable. We have also received numerous claims for personal injury, property damage and various economic damages loss related to the oil spill, including notification by the National Pollution Funds Center of claims it has received. Additional lawsuits may be filed and claims submitted, however OPA 90 has a three year prescriptive period and any new claim filed after three years would be subject to dismissal. We are in early discussions with the Natural Resource Damage Assessment Group, consisting of various State and Federal agencies, regarding the scope of environmental damage that may have been caused by the incident. A suit was filed on July 22, 2009 in the Eastern District of Louisiana entitled Lloyd Balliviero, d/b/a Buras Marina v. American Commercial Lines LLC, Summit Environmental Services LLC, and Clean Harbors Environmental Services, Inc, in Case No. 09-4464 seeking payment for “rental
15
Table of Contents
ACL I CORPORATION
NOTES TO CONDENSED CONSOLIDATED FINANCIAL STATEMENTS (Continued)
cost” of its marina for cleanup operations. ACL and ACL LLC have also been named as defendants in the following interpleader action brought by DRD’s primary insurer IINA seeking court approval as to the disbursement of the funds: Indemnity Insurance Company of North America v.
DRD Towing Company, LLC; DRD Towing Group, LLC; American Commercial Lines, LLC; American Commercial Lines, Inc.; Waits Emmet & Popp, LLC, Daigle, Fisse & Kessenich; Stephen Marshall Gabarick; Bernard Attridge; Austin Sicard; Lamont L. Murphy, individually and on behalf of Murphy Dredging; Deep Delta Distributors, Inc.; David Cvitanovich; Kelly Clark; Timothy Clark, individually and on behalf of Taylor Clark, Bradley Barrosse; Tricia Barrosse; Lynn M. Alfonso, Sr.; George C. McGee; Sherral Irvin; Jefferson Magee; and Acy J. Cooper, Jr., United States District Court, Eastern District of Louisiana, Civil Action 08-4156, Section “I-5,” filed on August 11, 2008. DRD’s excess insurers, IINA and Houston Casualty Company intervened into this action and deposited $9,000 into the Court’s registry. ACL LLC has filed two actions in the United States District Court for the Eastern District of Louisiana seeking exoneration from or limitation of liability relating to the foregoing incident as provided for in Rule F of the Supplemental Rules for Certain Admiralty and Maritime Claims and in 46 U.S.C. sections 30501, 30505 and 30511. Tintomara interests and DRD also filed limitation actions. ACL made a claim for its damages against Tintomara interests and DRD in their respective limitation actions. We have also filed a declaratory judgment action against DRD seeking to have the contracts between them declared “void ab initio”. This action has been consolidated with the limitation actions and stayed pending the outcome of the limitation actions. A trial on the ACL, Tintomara interests and DRD limitation actions has been concluded and we are awaiting the judge’s decision on liability of the parties and apportionment of ACL and Tintomara’s damages. On August 22, 2011 an action was filed in the U.S. District Court for the Eastern District of Louisiana captioned United States of America v. American Commercial Lines LLC and D.R.D. Towing, LLC, Civil Action No. 2:11-cv-2076. The action seeks damages of approximately $25 million, including certain repayment to the Oil Spill Liability Trust Fund for sums it paid related to the cleanup of the oil spill and to certain claimants for damages cognizable under OPA 90, a civil penalty under the Clean Water Act in an amount to be determined at trial as well as a claim for natural resources damages. On July 25, 2011 an action was filed in the 25th Judicial District for the Parish of Plaquemines State of Louisiana captioned Chuc Nguyen, et al. v. American Commercial Lines, Inc. and its Insurers, ABC Insurance Company and Indemnity Insurance Company of North America, No. 58936. The action filed by numerous commercial fishermen seeks damages for real or personal property, loss of subsistence use of natural resources associated with loss of profits or impairment of earning capacity. We participated in the U.S. Coast Guard investigation of the matter and participated in the hearings which have concluded. A finding has not yet been announced. Although we have made demand on DRD (including its insurers) and Tintomara interests for reimbursement of cleanup costs, indemnification and other damages sustained by the Company there is no assurance that any other party that may be found responsible for the accident will have the insurance or financial resources available to provide such defense and indemnification. We have various insurance policies covering pollution, property, marine and general liability. While the cost of cleanup operations and other potential liabilities are significant, we believe the Company has satisfactory insurance coverage and other legal remedies to cover substantially all of the cost.
Note 10. Share-Based Compensation
On April 12, 2011, Finn adopted the Finn Holding Corporation 2011 Participation Plan (the “Participation Plan”) to provide incentive to key employees of Finn and its subsidiaries by granting performance units to key stakeholders, including ACL I’s named executive officers, to maximize Finn’s performance and to provide maximum returns to Finn’s stockholders. The Participation Plan may be altered, amended or terminated by Finn at any time.
Under the Participation Plan, the value of the performance units is related to the appreciation in the value of Finn from and after the date of grant. The performance units vest over a period specified in the applicable award agreements. Participants in the Participation Plan may be entitled to receive compensation for their vested units if certain performance-based “qualifying events” occur during the participant’s employment with the Company. These qualifying events are described below. The Compensation Committee for the Participation Plan (the “Plan Committee”) determines who is eligible to receive an award, the size and timing of the award and the value of the award at the time of grant. The performance units generally mature according to the terms approved by the Plan Committee and as set forth in a grant agreement. Payment on the performance units is contingent upon the occurrence of either (i) a sale of some or all of Finn common stock by its stockholders, or (ii) Finn’s payment of a cash dividend. The Participation Plan will expire April 1, 2016 and all performance units will terminate upon the expiration of the Participation Plan, unless sooner terminated pursuant to the terms of the Participation Plan.
The maximum number of performance units that may be awarded under the Participation Plan is 36,800,000. During the year ended December 31, 2011, a total of 31,165,000 performance units were granted and 19,780,000 performance units were forfeited by executives that left employment in 2011. At no time during the year did the outstanding grants exceed the maximum authorized units. At December 31, 2011, the Company had committed to issue 17,595,000 performance units to executives that joined the Company during 2011. These units were granted during the quarter ended March 31, 2012 and no units were granted in the quarter ended June 30, 2012. The fair value of the performance units on their grant date was zero.
16
Table of Contents
ACL I CORPORATION
NOTES TO CONDENSED CONSOLIDATED FINANCIAL STATEMENTS (Continued)
Upon the occurrence of a qualifying event, participants with vested units may receive an amount equal to the difference between: (i) the value (as defined by the Participation Plan) of the units on the date of the qualifying event, and (ii) the value of the units assigned on the date of grant. No amounts are due to participants until the total cash dividends and net proceeds from the sale of common stock exceed values pre-determined by the Participation Plan. The Company accounts for grants made pursuant to this Participation Plan in accordance with FASB ASC 718, “Compensation — Stock Compensation” (“ASC 718”). It is anticipated that since the occurrence of future “qualifying events” is not determinable or estimable, no liability or expense will be recognized until the qualifying event(s) becomes probable and can be estimated.
Prior to the Acquisition, ACL had reserved the equivalent of approximately 54,000 shares of Finn for grants to employees and directors under the Omnibus Plan. According to the terms of the Omnibus Plan, forfeited share awards and expired stock options become available for future grants. No share-based awards were granted under this Omnibus Plan during the six months ended June 30, 2012 or 2011.
For all share-based compensation under the Omnibus Plan, as participants render service over the vesting periods, expense has been recorded to the same line items used for cash compensation. Generally, this expense is for the straight-line amortization of the grant date fair market value adjusted for expected forfeitures. Other capital is correspondingly increased as the compensation is recorded. Grant date fair market value for all non-option share-based compensation was the closing market value on the date of grant. Adjustments to estimated forfeiture rates have been made when actual results were known, generally when awards are fully earned. Adjustments to estimated forfeitures for awards not fully vested occur when significant changes in turnover rates became evident.
Effective as of the date of the Acquisition on December 21, 2010, all awards that had been granted to non-executive employees and to the former ACL board members vested and were paid out consistent with certain provisions in the Omnibus Plan. The payment of the intrinsic value of these awards totaling $14,284 was a part of the consideration paid for the Acquisition and included certain previously vested executive shares. This payment by the Company is recorded as an element of the intercompany receivable balance on the condensed consolidated balance sheet. Unvested awards previously granted to Company executives under the Omnibus Plan were assumed by Finn. There were no changes in the terms and conditions of the awards, except for adjustment to denomination in Finn shares for all award types and conversion to time-based vesting as to the performance units. At June 30, 2012, 8,799 shares were available under the Omnibus Plan for future awards, but there is no intention that any further awards will be granted under the Omnibus Plan.
No vesting events occurred in the three months ended June 30, 2012. During the six months ended June 30, 2012, a total of 1,468 restricted stock units and 1,114 stock options, held by Company executives vested. These vesting events will result in an increase in additional paid in capital and a tax benefit for the excess of the intrinsic value of the restricted units at the vesting date over the fair value at the date of grant of $206. These tax benefits will be recognized through paid in capital as it becomes more likely than not that the tax benefit will be realized. As of June 30, 2012, there were 2,857 options outstanding with a weighted average exercise price of $55.62 and 54 vested and 808 unvested restricted stock units outstanding.
In the three months and six months ended June 30, 2012, the Company recorded total stock-based compensation expense of $35 and $84 respectively, and related income tax benefit of $13 and $32, respectively. In the three and six months ended June 30, 2011, the Company recorded total stock-based employee compensation expense of $322 and $1,815 respectively, and related tax benefit of $121 and $680. During the three and six months ended June 30, 2011, 1,700 and 5,323 restricted stock units respectively, held by separating Company executives, vested. This vesting event resulted in an increase in additional paid in capital and a tax benefit for the excess of the intrinsic value of the restricted units at the vesting date over the fair value at the date of grant of $190 and $1,280, respectively. Compensation expense included $196 and $815, respectively, related to certain executive outstanding awards which accelerated in accordance with the terms of the Plan at the date of their separation from service. The intrinsic value of awards held by separating executives was paid by the Company to the participants upon their separation from the Company, increasing the Company’s intercompany receivable from Finn Holdings.
During the three months ended March 31, 2011, after the issuance of $250,000 of unsecured PIK Notes by ACL I, ACL’s parent company, Finn declared a dividend of $258.50 per share for each outstanding share. The dividend was paid to Finn shareholders during the first quarter of 2011. This reduced Finn’s initial capitalization from $460,000 to $201,500.
Per the terms of the Plan, in the event of such dividend, holders of outstanding share-based equity awards were entitled to receive either dividend rights, participation in the dividend or adjustment of awards to maintain the then-current intrinsic value of the existing awards. Finn elected to pay the dividend per share to holders of vested restricted stock units and performance units and to adjust the strike prices and number of options issued to maintain the intrinsic value at date of dividend, or some combination of such actions. The dividend resulted in payments of $3,659 to Company executives at the date of the dividend, with all remaining share-based awards’ new intrinsic value based on shares of Finn valued at $201.50 per share. The $3,659 payment was made by the Company and increased the Company’s related receivable from Finn.
17
Table of Contents
ACL I CORPORATION
NOTES TO CONDENSED CONSOLIDATED FINANCIAL STATEMENTS (Continued)
After the payouts to the executives, during the six months ended June 30, 2011, the Company declared and paid dividends to Finn in an amount equal to the gross payments. Finn, in turn, used the proceeds to reimburse the Company for payments made on its behalf to separating executives and to holders of vested restricted units under the Plan.
Note 11. Dispositions
Dispositions and Impairments —
In December 2011 the Company disposed of its interest in EBDG. Due to the sale all results of EBDG operations are reflected in discontinued operations.
During the first quarter of 2011 one of the three boats held for sale was returned to service, one boat was sold in the third quarter of 2011 and two additional boats were placed into held for sale status in the fourth quarter. These three boats are being actively marketed. During the first quarter of 2012 eight surplus boats were sold at a small loss. Additionally, during the six months ended June 30, 2012, 335 retired barges were sold for scrap generating proceeds of $26,565 and gains on disposition of $9,261.
18
Table of Contents
| ITEM 2. | MANAGEMENT’S DISCUSSION AND ANALYSIS OF FINANCIAL CONDITION AND RESULTS OF OPERATIONS |
This Management’s Discussion and Analysis of Financial Condition and Results of Operations (“MD&A”) includes certain “forward-looking statements” that involve many risks and uncertainties. When used, words such as “anticipate,” “expect,” “believe,” “intend,” “may be,” “will be” and similar words or phrases, or the negative thereof, unless the context requires otherwise, are intended to identify forward-looking statements. These forward-looking statements are based on management’s present expectations and beliefs about future events. As with any projection or forecast, these statements are inherently susceptible to uncertainty and changes in circumstances. ACL I Corporation is under no obligation to, and expressly disclaims any obligation to, update or alter its forward-looking statements whether as a result of such changes, new information, subsequent events or otherwise. The potential for actual results to differ materially from such forward-looking statements should be considered in evaluating our outlook.
The readers of this document are cautioned that any forward-looking statements are not guarantees of future performance and involve risks and uncertainties. See the risk factors enumerated in “Part II — Other Information — Item 1A. Risk Factors” of this Quarterly Report on Form 10-Q (this “Report”) for a detailed discussion of important factors that could cause actual results to differ materially from those reflected in such forward-looking statements.
INTRODUCTION
This MD&A is provided as a supplement to the accompanying condensed consolidated financial statements and footnotes to help provide an understanding of the financial condition, changes in financial condition and results of operations of ACL I Corporation (“ACL I”) and its subsidiaries. Unless the context indicates otherwise, the “Company” refers to ACL I and its subsidiaries, on a consolidated basis. This MD&A should be read in conjunction with, and is qualified in its entirety by reference to, the accompanying condensed consolidated financial statements and footnotes. This MD&A is organized as follows.
Overview. This section provides a general description of the Company and its business, as well as developments the Company believes are important in understanding the results of operations and financial condition or in understanding anticipated future trends.
Results of Operations. This section provides an analysis of the Company’s results of operations for the three and six months ended June 30, 2012 compared to the results of operations for the three and six months ended June 30, 2011.
Liquidity and Capital Resources. This section provides an overview of the Company’s sources of liquidity, a discussion of the Company’s debt that existed as of June 30, 2012, and an analysis of the Company’s cash flows for the six months ended June 30, 2012, and June 30, 2011.
Changes in Accounting Standards. This section describes certain changes in accounting and reporting standards applicable to the Company.
Critical Accounting Policies. This section describes any significant changes in accounting policies that are considered important to the Company’s financial condition and results of operations, require significant judgment and require estimates on the part of management in application from those previously described in our filing on Form S-4/A, filed May 8, 2012. The Company’s significant accounting policies include those considered to be critical accounting policies.
Quantitative and Qualitative Disclosures about Market Risk. This section discusses our analysis of significant changes in exposure to potential losses arising from adverse changes in fuel prices and interest rates at June 30, 2012.
OVERVIEW
Our Business
The Company
The Company is one of the largest and most diversified inland marine transportation and service companies in the United States. The Company provides barge transportation and related services under the provisions of the Jones Act (the “Jones Act”) and manufactures barges, primarily for use in the inland rivers, commonly referred to as brown-water use. The Jones Act is a federal cabotage law that restricts domestic non-proprietary cargo marine transportation in the United States to vessels built and registered in the United States, manned by U.S. citizens and 75% owned by U.S. citizens.
We currently operate in two business segments, transportation and manufacturing. We are the third largest provider of dry cargo barge transportation and second largest provider of liquid tank barge transportation on the United States Inland Waterways, which consists of the Mississippi River, the Ohio River, the Illinois River and their tributaries and the Gulf Intracoastal Waterway (the “Inland Waterways”), accounting for 10.9% of the total inland dry cargo barge fleet and 10.2% of the total inland liquid cargo barge fleet as of December 31, 2011, according to InformaEconomics, Inc., a private forecasting service (“Informa”).
Our operations are tailored to service a wide variety of shippers and freight types. We provide additional value-added services to our customers, including warehousing and third-party logistics through our BargeLink LLC joint venture. Our operations incorporate advanced fleet management practices and information technology systems which allows us to effectively manage our fleet.
19
Table of Contents
Our manufacturing segment was the second largest manufacturer of brown-water barges in the United States in 2011 according to Criton Corporation (“Criton”), publisher of River Transport News.
The Industry
Transportation Industry. Barge market behavior is driven by the fundamental forces of supply and demand, influenced by a variety of factors including the size of the Inland Waterways barge fleet, local weather patterns, navigation circumstances, domestic and international consumption of agricultural and industrial products, crop production, trade policies and the price of steel. According to Informa, the Inland Waterways fleet peaked at 23,092 barges at the end of 1998. By the end of 2009, the industry fleet had, decreased to 17,498 dry and 3,009 liquid barges, for a total fleet size of 20,507, 11.2% below the 1998 level, with 113 more liquid tank barges and 2,698 fewer dry cargo barges than were in service at the end of 1998. Retirements of dry and liquid barges of 1,131 and 144, respectively, during the two-year period including 2010 and 2011, were more than offset by new construction with additions in excess of retirements of 498 dry cargo barges and 75 liquid tank barges, resulting in an industry fleet of 21,080 at the end of 2011. This was 8.7% below the 1998 peak levels in the industry, with the number of dry cargo barges down 10.9% and liquid tank barges up almost 6.5%. Competition is intense for barge freight transportation. The top five carriers (by fleet size) of dry and liquid barges comprise over 55% of the industry fleet in each sector as of December 31, 2011. The average economic useful life of a dry cargo barge is generally estimated to be up to 35 years and up to 40 years for liquid tank barges, with the age of retirement depending on physical condition of a barge and the amount of reinvestment and repair.
For purposes of industry analysis, the commodities transported on the Inland Waterways can be broadly divided into four categories: grain, bulk, coal and liquids. Using these broad cargo categories, the following graph depicts the total millions of tons shipped through the Inland Waterways for the quarter and six months ended June 30, 2012 and June 30, 2011 by all carriers according to data from the US Army Corps of Engineers Waterborne Commerce Statistics Center (the “Corps”). The Corps does not estimate ton-miles, which we believe is a more accurate volume metric. Note that the most recent periods are typically estimated for the Corps’ purposes by lockmasters and retroactively adjusted as shipper data is received.
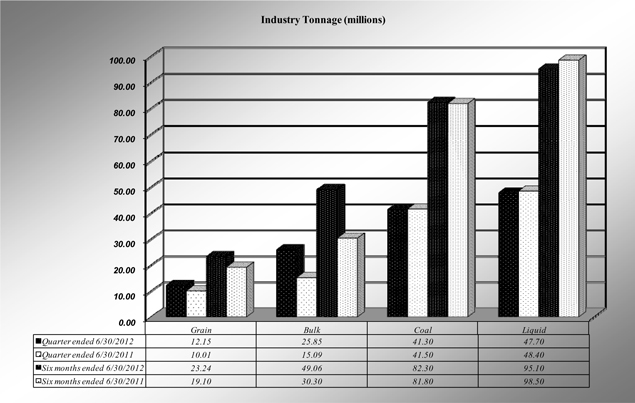
Source: U.S. Army Corps of Engineers Waterborne Commerce Statistics Center
Manufacturing Industry. The inland barge manufacturing industry competes primarily on quality of manufacture, delivery schedule, design capabilities and price. We consider Trinity Industries, Inc. to be our manufacturing segment’s most significant competitor for the large-scale manufacture of inland barges, although other firms have barge building capability on a smaller scale. We believe there are a number of shipyards located on the Gulf Coast that compete with our manufacturing segment for the manufacturing of liquid tank barges. In addition, certain other shipyards may be able to reconfigure to manufacture inland barges and related equipment. We believe, based on data
20
Table of Contents
reported by River Transport News (published by Criton), that Jeffboat and one other competitor together comprise the significant majority of barge manufacturing capacity in the U.S. We also believe that the new dry barge builds required to replace retiring barges may strain the capacity of barge manufacturing during the next five years. According to industry data provided by Informa, from 2005 through 2011, Jeffboat’s brown water liquid and dry cargo barge production accounted for between 24% and 43% of the overall market.
Consolidated Financial Overview
For the quarter and six month period ended June 30, 2012 the Company had net income of $0.9 million and $0.3 million respectively. This represented an improvement of $21.7 million for the quarter and $37.6 million for the first six months compared to the same periods of the prior year.
The following table displays certain individually significant drivers of after-tax non-comparability in the respective second quarters and first six month periods of 2012 and 2011. Though all periods contain the impact of purchase accounting due to the significant difference in the level of asset sales and barge scrapping, we have separated the former basis and the impact of the purchase accounting revaluation of the assets disposed.
| Significant Non-Comparable Items | ||||||||||||||||
| (in thousands) | ||||||||||||||||
| After Tax Impact on Net Income (Decrease) Increase | ||||||||||||||||
| Three months ended June 30, | Six months ended June 30, | |||||||||||||||
| 2012 | 2011 | 2012 | 2011 | |||||||||||||
| Restructuring and share-based compensation costs |
$ | (19 | ) | $ | (380 | ) | $ | (81 | ) | $ | (2,036 | ) | ||||
| Merger related and consulting expenses |
(2,017 | ) | (3,473 | ) | (3,616 | ) | (7,215 | ) | ||||||||
| Customer bankruptcy recovery |
— | 576 | — | 576 | ||||||||||||
| Total historical cost gains/losses on boat/barge sales |
2,711 | 2,056 | 20,738 | 2,784 | ||||||||||||
| Purchase accounting impact onboat/barge gains |
(1,880 | ) | (1,241 | ) | (15,911 | ) | (1,957 | ) | ||||||||
|
|
|
|
|
|
|
|
|
|||||||||
| $ | (1,205 | ) | $ | (2,462 | ) | $ | 1,130 | $ | (7,848 | ) | ||||||
|
|
|
|
|
|
|
|
|
|||||||||
In addition to the above items, approximately $6.7 million of the improvement in both the quarter and six months ended June 30, 2012, results compared to the same periods of the prior year is attributable to the absence of the flooding conditions that impacted the prior year periods. These items and changes in the operating performance of our transportation and manufacturing segments drove the improvements in net income. The primary causes of changes in operating income in our transportation and manufacturing segments are generally described below under “Segment Overview” and more fully described below under “Operating Results by Business Segment.”
For the quarter and six months ended June 30, 2012, Adjusted EBITDAR from continuing operations was $53.4 million and $111.7 million respectively. This represents improvements of $13.2 million and $45.7 million compared to the same periods of the prior year. Adjusted EBITDAR from continuing operations as a percent of revenue was 24.4% and 25.6% for the quarter and six months ended June 30, 2012. This represents an increase of 4.3 points quarter-over-quarter and an increase of 8.1 points six month period-over-six month period. See the table below under “Consolidated Financial Overview — Non-GAAP Financial Measure Reconciliation” for a definition of Adjusted EBITDAR and a reconciliation of Adjusted EBITDAR to consolidated net income or loss.
During the six months ended June 30, 2012, $84.0 million of capital expenditures was primarily attributable to completion of 10 new covered, dry cargo barges and eight new liquid tank barges for the transportation segment, acquisition of eight liquid tank barges early in the second quarter, boat repower spending, other boat and barge capital improvements and facilities improvements. During the six months ended June 30, 2012, proceeds from the scrapping of 335 retired barges generated $26.6 million and the sale of eight surplus boats generated $15.3 million.
During the six months ended June 30, 2012, average face amount of outstanding debt increased approximately $15.2 million from the year end 2011 level, primarily driven by the payment of PIK interest on the PIK Notes as well as capital expenditures in the period which were largely offset by the proceeds from barge scrapping and boat sales and the improvement in operating cash flow. Total interest expense for the six months ended June 30, 2012, was $32.8 million or $5.9 million higher than those expenses in the same period of 2011. The
21
Table of Contents
increase in interest expense is due to higher interest on the larger outstanding balance of the PIK Notes as well lower net amortization of the Acquisition date premium on the 2017 Notes and debt issuance costs as well as higher interest expense in the current year on obligations other than debt.
At June 30, 2012, we had total indebtedness of $650.8 million, including the $26.4 million premium recorded at the Acquisition date to recognize the fair value of the 2017 Notes and the $3.2 million discount on the PIK Notes, net of amortization through June 30, 2012. At this level of debt we had $240.4 million in remaining current availability under our Credit Facility. The Credit Facility has no maintenance financial covenants unless borrowing availability is generally less than $48.8 million. At June 30, 2012, borrowing levels, the Company had availability that was $191.6 million above this threshold.
As of June 30, 2012, the present value of the lease payments associated with revenue generating equipment was approximately $46.9 million. Including the present value of these lease payments, the Company’s total funded indebtedness would be $674.5 million as of June 30, 2012. The ratio of funded debt to Adjusted EBITDAR for the trailing twelve months ended June 30, 2012 was 3.2 times.
Segment Overview
We operate in two predominant business segments: transportation and manufacturing.
Transportation
The transportation segment produces several significant revenue streams. Our customers engage us to move cargo, generally for a per ton rate, from an origin point to a destination point along the Inland Waterways in the Company’s barges, pushed primarily by the Company’s towboats under affreightment contracts. Affreightment contracts include both term and spot market arrangements.
Non-affreightment revenue is generated either by demurrage charges related to affreightment contracts or by one of three other contractual arrangements with customers: charter/day rate contracts, outside towing contracts, or other marine services contracts.
Under charter/day rate contracts the Company’s boats and barges are leased to third parties who control the use (loading, movement, unloading) of the vessels. The ton-miles for charter/day rate contracts are not included in the Company’s tracking of affreightment ton-miles, but are captured and reported as part of ton-miles non-affreightment.
Outside towing revenue is earned by moving barges for other affreightment carriers at a specific rate per barge move.
Marine services revenue is earned for fleeting, shifting and cleaning services provided to third parties.
Transportation revenue for each contract type for the quarter and six months ended June 30, 2012 is summarized in the key operating statistics table.
Total affreightment volume measured in ton-miles increased in the second quarter of 2012 to 7.4 billion compared to 7.1 billion in the same period of the prior year driven by increased coal and grain ton-mile volume partially offset by decreases in bulk affreightment volume. Total affreightment volume measured in ton-miles increased for the six months ended June 30, 2012, to 15.6 billion compared to 14.5 billion in the same period of the prior year driven by increased coal and grain ton-mile volume partially offset by decreases in bulk affreightment volume.
For the second quarter of 2012 and six months ended June 30, 2012, non-affreightment revenues, compared to the same periods of the prior year, increased by $10.5 million, or 22.1%, and by $19.4 million, or 21.0%, primarily due to higher charter/day rate revenue, higher liquid towing revenue, higher liquid demurrage and higher fleet revenue partially offset by lower demurrage and towing revenues from our fleet of dry barges. Our transportation segment’s revenue stream within any year reflects the variance in seasonal demand, with revenues earned in the first half of the year lower than those earned in the second half of the year. Historically, grain has experienced the greatest degree of seasonality among all the commodity segments, with demand generally following the timing of the annual harvest. Demand for grain movement generally begins around the Gulf Coast and Texas regions and the southern portions of the Lower Mississippi River, or the Delta area, in late summer of each year. The demand for freight spreads north and east as the grain matures and harvest progresses through the Ohio Valley, the Mid-Mississippi River area, and the Illinois River and Upper Mississippi River areas. System-wide demand generally peaks in the mid-fourth quarter. Demand normally tapers off through the mid-first quarter, when traffic is generally limited to the Ohio River as the Upper Mississippi River normally closes from approximately mid-December to mid-March, and ice conditions can hamper navigation on the upper reaches of the Illinois River. On average, for the last five-year period, the peak grain tariff rates have been almost double the trough rates. Our achieved grain pricing, across all river segments, was down 25.3% and 15.5% in the quarter and six months ended June 30, 2012 compared to the same periods of the prior year.
Overall transportation revenues increased approximately 4.2% in the quarter and 5.6% for the six months ended June 30, 2012 on a fuel neutral basis compared to the same periods of the prior year. The increase in the quarter was driven by volume increases in petroleum, chemicals, fertilizer, other bulk products, liquid charter and coal, offset by declines in grain, steel, cement, dry demurrage and salt, as overall fuel-neutral rates per ton-mile declined by approximately 5.6% in the quarter compared to prior year. The increase in the six-month period was driven by volume increases in petroleum, coal, chemicals, fertilizer, other bulk products, liquid charter, liquid towing and coal, offset by declines in grain and steel, as overall fuel-neutral rates per ton-mile declined by approximately 6.2% in the six-month period compared to prior year.
22
Table of Contents
Revenues per average barge operated increased 29.2% in the second quarter of 2012 and 25.1% for the six months ended June 30, 2012, compared to the same periods of the prior year. The increase in the quarter was driven equally by increased affreightment revenue and the increase in non-affreightment revenue due largely to liquid charter and day rate revenue increases. Approximately 60% of the increase in the six-month period was driven by increased affreightment revenue and the remainder of the increase attributable to increases in non-affreightment revenue driven largely by higher liquid charter and day rate revenue.
For the second quarter of 2012, the Company generated operating income of $17.8 million compared to an operating loss of $15.8 million in the prior year period. This increase in operating income of $33.6 million was the result of the absence of the estimated $10.4 million margin impact of the flooding that occurred in the prior year second quarter, lower boat and barge repairs related to both the boat repower program and lower repairs associated with the significant retirement of older barge assets; the margin impact of higher charter/day rate volume and higher tons per barge; lower fuel pricing; higher boat productivity; the margin impact of higher fleeting service revenue; higher gains on sale of assets and higher manufacturing segment income. These positive factors were partially offset by the margin impact of lower pricing and higher selling, general and administrative expenses.
For the six months ended June 30, 2012, the Company generated operating income of $33.3 million compared to an operating loss of $31.5 million in the prior year period. This increase in operating income of $64.8 million was the result of higher gains on sales of retired barges and surplus boats; the absence of the estimated $10.4 million margin impact of the flooding that occurred in the prior year second quarter; higher boat productivity; lower boat and barge repairs related to both the boat repower program and lower repairs associated with the significant retirement of older barge assets; the margin impact of higher charter/day rate volume and higher tons per barge; higher manufacturing segment income; lower fuel pricing; lower selling, general and administrative expenses and the margin impact of higher fleeting service revenue. These positive factors were partially offset by the margin impact of lower pricing.
Fuel as a percent of segment revenues decreased in the quarter by 5.3 points to 22.7% of segment revenues or $39.5 million. Fuel consumption decreased approximately 16.9% for the quarter compared to the same period of the prior year despite the increase in ton-miles due to better river conditions, higher boat productivity and barge draft efficiency. The average net-of-hedge-impact price per gallon increased 3.9% to $3.16 per gallon in the quarter.
Fuel as a percent of segment revenue decreased in the six months ended June 30, 2012 by 1.9 points to 23.2% of segment revenues or $82.8 million. Fuel consumption decreased approximately 7.5% for the quarter compared to the same period of the prior year despite the increase in ton-miles due to higher boat productivity and barge draft efficiency. The average net-of-hedge-impact price per gallon increased 9.7% to $3.11 per gallon in the quarter.
23
Table of Contents
Key operating statistics regarding our transportation segment for the quarter and six months ended June 30, 2012 are summarized in the following table.
Key Operating Statistics
| Three Months Ended June 30, 2012 |
% Change to Prior Year Quarter Increase (Decrease) |
Six Months Ended June 30, 2012 |
% Change to Prior Year YTD Increase (Decrease) | |||||||||
| Ton-miles (in thousands): |
||||||||||||
| Total dry |
6,903,535 | 3.3% | 14,572,953 | 8.1% | ||||||||
| Total liquid |
479,162 | 4.9% | 977,646 | (4.3)% | ||||||||
|
|
|
|
|
|||||||||
| Total affreightment ton-miles |
7,382,696 | 3.4% | 15,550,598 | 7.2% | ||||||||
| Total non-affreightment ton-miles |
964,956 | 11.5% | 1,839,752 | 6.2% | ||||||||
|
|
|
|
|
|||||||||
| Total ton-miles |
8,347,653 | 4.3% | 17,390,351 | 7.1% | ||||||||
|
|
|
|
|
|||||||||
| Average ton-miles per affreightment barge |
4,111 | 29.4% | 8,226 | 28.0% | ||||||||
| Rates per ton mile: |
||||||||||||
| Dry rate per ton-mile |
(6.4)% | (3.7)% | ||||||||||
| Fuel neutral dry rate per ton-mile |
(8.7)% | (7.7)% | ||||||||||
| Liquid rate per ton-mile |
16.6% | 17.1% | ||||||||||
| Fuel neutral liquid rate per-ton mile |
12.2% | 10.1% | ||||||||||
| Overall rate per ton-mile |
$ | 15.77 | (3.0)% | $ | 15.76 | (1.8)% | ||||||
| Overall fuel neutral rate per ton-mile |
$ | 15.35 | (5.6)% | $ | 15.06 | (6.2)% | ||||||
| Revenue per average barge operated (in thousands) |
$ | 88,201 | 29.2% | $ | 169,103 | 25.1% | ||||||
| Fuel price and volume data: |
||||||||||||
| Fuel price |
$ | 3.16 | 3.9% | $ | 3.11 | 9.7% | ||||||
| Fuel gallons (in thousands) |
12,504 | (16.9)% | 26,630 | (7.5)% | ||||||||
| Revenue data (in thousands): |
||||||||||||
| Affreightment revenue |
$ | 116,219 | 0.3% | $ | 244,904 | 5.5% | ||||||
| Non-affreightment revenue |
||||||||||||
| Towing |
12,428 | 10.0% | 24,099 | 8.4% | ||||||||
| Charter and day rate |
29,390 | 38.7% | 55,050 | 44.1% | ||||||||
| Demurrage |
8,738 | 0.8% | 17,241 | (15.9)% | ||||||||
| Other |
7,421 | 17.7% | 15,175 | 34.7% | ||||||||
|
|
|
|
|
|||||||||
| Total non-affreightment revenue |
57,977 | 22.1% | 111,565 | 21.0% | ||||||||
|
|
|
|
|
|||||||||
| Total transportation segment revenue |
$ | 174,196 | 6.7% | $ | 356,469 | 9.9% | ||||||
|
|
|
|
|
|||||||||
24
Table of Contents
Data regarding changes in our barge fleet for the quarter ended June 30, 2012 is summarized in the following table.
Barge Fleet Changes
| Barges — Current Quarter |
Dry | Tankers | Total | |||||||||
| Barges operated as of March 31, 2012 |
1,697 | 315 | 2,012 | |||||||||
| Retired (includes reactivations) |
(76 | ) | (6 | ) | (82 | ) | ||||||
| New builds |
— | 4 | 4 | |||||||||
| Purchased |
— | 8 | 8 | |||||||||
| Change in number of barges leased |
(4 | ) | — | (4 | ) | |||||||
|
|
|
|
|
|
|
|||||||
| Barges operated as of June 30, 2012 |
1,617 | 321 | 1,938 | |||||||||
|
|
|
|
|
|
|
|||||||
| Barges — Current Year |
Dry | Tankers | Total | |||||||||
| Barges operated as of December 31, 2011 |
1,961 | 316 | 2,277 | |||||||||
| Retired (includes reactivations) |
(333 | ) | (11 | ) | (344 | ) | ||||||
| New builds |
10 | 8 | 18 | |||||||||
| Purchased |
— | 8 | 8 | |||||||||
| Change in number of barges leased |
(21 | ) | — | (21 | ) | |||||||
|
|
|
|
|
|
|
|||||||
| Barges operated as of June 30, 2012 |
1,617 | 321 | 1,938 | |||||||||
|
|
|
|
|
|
|
|||||||
Data regarding our boat fleet at June 30, 2012 is contained in the following table.
Owned Boat Counts and Average Age by Horsepower Class
| Horsepower Class |
Number | Average Age |
||||||
| 1950 or less |
33 | 34.0 | ||||||
| Less than 4650 |
23 | 36.5 | ||||||
| Less than 6250 |
33 | 35.2 | ||||||
| 6800 and over |
12 | 33.5 | ||||||
|
|
|
|
|
|||||
| Total/overall age |
101 | 34.9 | ||||||
|
|
|
|
|
|||||
In addition, the Company had 12 chartered boats in service at June 30, 2012. Average life of a boat (with refurbishment) exceeds 50 years. At June 30, 2012, three boats were classified as assets held for sale and the Company continues to finalize a marketing plan for up to three additional boats which it believes may be sold in the near term.
We had almost 11,000 and 13,000 less weather-related lost barge days in the quarter and six months ended June 30, 2012 than in the prior year same periods, respectively, which contributed to the boat productivity improvement in the respective periods.
Manufacturing
The manufacturing segment had operating income of $2.7 million in the quarter ended June 30, 2012 compared to an operating income of $1.1 million in the comparable period of 2011. The increase in operating income was driven by higher external sales volume and improved labor and materials efficiency in the shipyard. The manufacturing segment sold nine more total barges than in the second quarter of 2011, with 15 more dry hoppers and six fewer deck barges than in the prior year period. The number of barges produced for the quarter and six months ended June 30, 2012, are included in the table below.
Manufacturing had approximately eleven fewer weather-related lost production days in the second quarter and nineteen fewer weather-related lost production days in the six months ended June 30, 2012 compared to the same periods of the prior year which contributed to the increased productivity in the current year quarter.
The manufacturing segment’s external revenue backlog at the period end was $41.6 million, approximately $64 million lower than the June 30, 2011 backlog and approximately $60 million lower than the December 31, 2011 backlog. We currently have no additional 2012 capacity for external barges as we continue to revitalize the transportation segment fleet.
25
Table of Contents
Manufacturing Segment Units Produced for External Sales or Internal Use
| Three months ended June 30, | Six months ended June 30, | |||||||||||||||
| 2012 | 2011 | 2012 | 2011 | |||||||||||||
| External sales: |
||||||||||||||||
| Deck barges |
— | 6 | — | 12 | ||||||||||||
| Dry cargo barges |
79 | 64 | 144 | 87 | ||||||||||||
|
|
|
|
|
|
|
|
|
|||||||||
| Total external units sold |
79 | 70 | 144 | 99 | ||||||||||||
|
|
|
|
|
|
|
|
|
|||||||||
| Internal sales: |
||||||||||||||||
| Liquid tank barges |
4 | — | 8 | — | ||||||||||||
| Dry cargo barges |
— | — | 10 | 25 | ||||||||||||
|
|
|
|
|
|
|
|
|
|||||||||
| Total units into production |
4 | — | 18 | 25 | ||||||||||||
|
|
|
|
|
|
|
|
|
|||||||||
| Total units produced |
83 | 70 | 162 | 124 | ||||||||||||
|
|
|
|
|
|
|
|
|
|||||||||
26
Table of Contents
Consolidated Financial Overview — Non-GAAP Financial Measure Reconciliation
ACL I CORPORATION
NET INCOME (LOSS) TO ADJUSTED EBITDA AND EBITDAR RECONCILIATION
(Dollars in thousands)
| For the Three Months Ended June 30, |
For the Six Months Ended June 30, |
|||||||||||||||
| 2012 | 2011 | 2012 | 2011 | |||||||||||||
| Net Income (Loss) from Continuing Operations |
$ | 859 | $ | (20,926 | ) | $ | 239 | $ | (37,339 | ) | ||||||
| Discontinued Operations, Net of Income Taxes |
— | 134 | 26 | 37 | ||||||||||||
|
|
|
|
|
|
|
|
|
|||||||||
| Consolidated Net Income (Loss) |
859 | (20,792 | ) | 265 | (37,302 | ) | ||||||||||
| Adjustments from Continuing Operations: |
||||||||||||||||
| Interest Income |
— | (103 | ) | (5 | ) | (158 | ) | |||||||||
| Interest Expense |
16,487 | 15,505 | 32,767 | 26,864 | ||||||||||||
| Debt Retirement Expenses |
— | — | — | — | ||||||||||||
| Depreciation and Amortization |
27,195 | 27,888 | 54,205 | 55,394 | ||||||||||||
| Taxes |
739 | (10,193 | ) | 580 | (20,652 | ) | ||||||||||
| Adjustments from Discontinued Operations: |
||||||||||||||||
| Interest Income |
— | (18 | ) | — | (18 | ) | ||||||||||
| Depreciation and Amortization |
— | 19 | — | 38 | ||||||||||||
| EBITDA from Continuing Operations |
45,280 | 12,171 | 87,786 | 24,109 | ||||||||||||
| EBITDA from Discontinued Operations |
— | 135 | 26 | 57 | ||||||||||||
|
|
|
|
|
|
|
|
|
|||||||||
| Consolidated EBITDA |
45,280 | 12,306 | 87,812 | 24,166 | ||||||||||||
| Long-term Boat and Barge Rents |
3,878 | 3,849 | 7,770 | 7,677 | ||||||||||||
|
|
|
|
|
|
|
|
|
|||||||||
| EBITDAR from Continuing Operations |
49,158 | 16,020 | 95,556 | 31,786 | ||||||||||||
| EBITDAR from Discontinued Operations |
— | 135 | 26 | 57 | ||||||||||||
|
|
|
|
|
|
|
|
|
|||||||||
| Consolidated EBITDAR |
49,158 | 16,155 | 95,582 | 31,843 | ||||||||||||
| Other Non-cash or Non-comparable charges included in net income: |
||||||||||||||||
| Continuing Ops |
||||||||||||||||
| Share Based Compensation |
35 | 322 | 84 | 1,815 | ||||||||||||
| Merger Related and Consulting Expenses and additional non-cash purchase accounting impacts |
4,201 | 6,874 | 27,173 | 13,846 | ||||||||||||
| (Gain) Loss on Excess Boat Sales |
— | — | (11,278 | ) | — | |||||||||||
| Restructuring Costs |
30 | 411 | 129 | 1,828 | ||||||||||||
|
|
|
|
|
|
|
|
|
|||||||||
| Total Continuing Ops |
4,266 | 7,607 | 16,108 | 17,489 | ||||||||||||
|
|
|
|
|
|
|
|
|
|||||||||
| Discontinuing Ops |
||||||||||||||||
| Merger Related and Consulting Expenses |
— | 20 | — | 20 | ||||||||||||
|
|
|
|
|
|
|
|
|
|||||||||
| Total Discontinuing |
— | 20 | — | 20 | ||||||||||||
|
|
|
|
|
|
|
|
|
|||||||||
| Flood Costs |
— | 16,618 | — | 16,618 | ||||||||||||
| Adjusted EBITDA form Continuing Ops |
49,546 | 36,396 | 103,894 | 58,216 | ||||||||||||
| Adjusted EBITDA form Discontinued Ops |
— | 155 | 26 | 77 | ||||||||||||
|
|
|
|
|
|
|
|
|
|||||||||
| Adjusted Consolidated EBITDA |
$ | 49,546 | $ | 36,551 | $ | 103,920 | $ | 58,293 | ||||||||
|
|
|
|
|
|
|
|
|
|||||||||
| Adjusted EBITDAR form Continuing Ops |
53,424 | 40,245 | 111,664 | 65,893 | ||||||||||||
| Adjusted EBITDAR form Discontinued Ops |
— | 155 | 26 | 77 | ||||||||||||
|
|
|
|
|
|
|
|
|
|||||||||
| Adjusted Consolidated EBITDAR |
$ | 53,424 | $ | 40,400 | $ | 111,690 | $ | 65,970 | ||||||||
|
|
|
|
|
|
|
|
|
|||||||||
27
Table of Contents
EBITDAR consists of earnings before interest, taxes, depreciation, amortization, long-term boat and barge rents and debt retirement expenses. Adjusted EBITDAR includes adjustments to historical EBITDAR that we do not consider indicative of our core operating functions or ongoing operating performance after the Acquisition. EBITDAR and Adjusted EBITDAR are not calculated or presented in accordance with U.S. GAAP and other companies in our industry may calculate EBITDAR and Adjusted EBITDAR differently than we do. As a result, these financial measures have limitations as analytical and comparative tools and you should not consider these items in isolation, or as a substitute for analysis of our results as reported under U.S. GAAP. However, we believe that EBITDAR and Adjusted EBITDAR provide relevant and useful information, which is often reported and widely used by analysts, investors and other interested parties in our industry. We consider EBITDAR and Adjusted EBITDAR to be meaningful indicators of core operating performance and we use it as a means to assess the operating performance of our business segments. EBITDAR and Adjusted EBITDAR should not be considered as measures of discretionary cash available to us to invest in the growth of our business as both measures exclude certain items that are relevant in understanding and assessing our results of operations and cash flows. EBITDAR and Adjusted EBITDAR provide management with an understanding of one aspect of earnings before the impact of investing and financing transactions and income taxes. We believe that our use of long-term leases to fund the construction and acquisition of revenue-producing assets is a financing decision and therefore we exclude rents related to such arrangements from this measure for its internal analyses. In calculating these financial measures, we make certain adjustments that are based on assumptions and estimates that may prove to have been inaccurate. In addition, in evaluating these financial measures, you should be aware that in the future we may incur expenses similar to those eliminated in this presentation. Our presentation of EBITDAR and Adjusted EBITDAR should not be construed as an inference that our future results will be unaffected by unusual or non-recurring items.
Outlook
Last year our second quarter profitability was severely impacted by extreme flooding of the Inland Waterways. As the Company moves into the third quarter of the year, during which the Company has historically experienced a tightening of barge capacity, higher rates and increased volumes, we are experiencing severe drought conditions. Not only is this drought impacting navigating conditions by negatively impacting load drafts and system speed, the drought is now predicted to have decreased agricultural yields for the current crop year. Expectations for the crop year as we entered the second quarter were that corn exports would be strong based on the USDA’s estimate that planted corn acreage was at 95.5 million acres, and that the USDA also expected the second largest planting in ten years for the eight major field crops. In the most recent USDA report the corn yield per harvested acre has been reduced by 12% and projected exports have also been reduced by almost 16%, or 300 million bushels. We believe that there are numerous factors that will determine the impact of the harvest on our business, including domestic demand for US grain (for livestock feed and ethanol production), the competitiveness, from a pricing perspective, of US produced grain versus that of other global producers, and the cost to deliver US grain to global markets. US demand for grain, particularly for ethanol production, is currently in a state of flux as ethanol producers are evaluating the impact of the elimination of subsidies for their products and the resulting impact on future demand. This demand projection is further complicated by the impact of future gasoline demand in general, which will ultimately drive ethanol requirements. Global market competitiveness will be determined not only by the success of the US grain harvest, but also by the harvests in other producing countries. We believe there remains an oversupply of ocean freight vessels which will keep ocean-going rates low, which should support export demand in the near term. In light of these uncertainties, it is difficult to predict the ultimate impact of the drought on our export grain business.
Continuation of the navigational draft restrictions will reduce our volumes and boat efficiency and increase costs. Each additional one inch reduction in load draft represents the loss of 17 tons of cargo, extrapolating to a 25 barge tow that represents a 425 ton loss of efficiency and a 510 ton loss for a 30 barge tow. In response to these conditions, we are implementing additional controls to manage our operating productivity during this period and are deferring discretionary spending where practical. We expect our boat and load efficiency to return as river levels normalize.
Until the harvest begins, we anticipate that we will continue to experience market conditions similar to those of the first half, with continuing strong liquid markets and export coal volumes. We expect that increased industry barge availability due to lower domestic coal shipments will continue to impact the pricing of export coal shipments. Lower demand for domestic coal shipments, which is driving this pricing weakness, continues as a result of the warm conditions in the past winter, low natural gas prices and looming regulation of coal-fired energy plants. We have also seen a decline in steel production from early 2012 levels.
Over the long term, we remain cautiously optimistic that there will be a tightening of capacity and increased demand in the dry barge market, which we believe will improve the market’s pricing dynamics. We expect to see continuing strong liquid demand and to increase the Company’s liquid capacity driven by strength in the petroleum market. Favorable oil price spreads between less mature crude oil sources, such as the Western Canadian crude and Eagle Ford shale regions, and the WTI and Brent crude markets will support pricing and demand dynamics that will be favorable to our business, particularly for dedicated service contracts. We also believe that demand for liquids transportation services may be increased by activities such as the reopening of certain gulf ethylene cracker plants and the production of natural gas liquids at much higher quantities than in 2011. The Company took delivery of eight new oversized liquid tank barges in the first half of 2012 and eight liquid tank barges were acquired early in the second quarter increasing the net barrel capacity of our fleet by 6.4% from the end of last year.
28
Table of Contents
In our manufacturing segment, Criton reported that in 2011 there was a net expansion in the dry cargo fleet. Given the age of many barges in the industry’s dry fleet, we expect a further reduction in the industry fleet of dry cargo barges over the next three to five years. This should lead to consistent demand and stable pricing for barge building by our manufacturing segment. Our shipyard experienced good weather and made positive strides in productivity in the first half of 2012. The manufacturing segment’s external revenue backlog at the period end was $41.6 million, approximately $64 million lower than the June 30, 2011 backlog and approximately $60 million lower than the December 31, 2011 backlog. This decline in external backlog is attributable to the Company’s current plans to place a significant number of the barges built by the manufacturing segment into service in the transportation segment. We have ramped up an additional production line to support the transportation segment’s liquid tank barge demand and have adjusted our other production lines to further emphasize the production of liquid tank barges. , Based on current projections, we believe that available production capacity is sold out through the first quarter of 2013. We continue to evaluate our longer-term strategy for the shipyard.
Overall, we are monitoring market conditions closely and are maintaining a disciplined approach to our operations that will allow us to continue to realize and build upon the gains we achieved in operating efficiency in 2011.
29
Table of Contents
OPERATING RESULTS by BUSINESS SEGMENT
Quarter Ended June 30, 2012 as compared with June 30, 2011
ACL 1 CORPORATION OPERATING RESULTS by BUSINESS SEGMENT
(Dollars in thousands except where noted)
(Unaudited)
| Quarter Ended June 30, | % of Consolidated Revenue |
|||||||||||||||||||
| 2nd Quarter | ||||||||||||||||||||
| 2012 | 2011 | Variance | 2012 | 2011 | ||||||||||||||||
| REVENUE |
||||||||||||||||||||
| Transportation and Services |
$ | 174,196 | $ | 163,317 | $ | 10,879 | 79.6 | % | 81.7 | % | ||||||||||
| Manufacturing (external and internal) |
54,627 | 36,600 | 18,027 | 25.0 | % | 18.3 | % | |||||||||||||
| Intersegment manufacturing elimination |
(10,152 | ) | (53 | ) | (10,099 | ) | (4.6 | )% | 0.0 | % | ||||||||||
|
|
|
|
|
|
|
|
|
|
|
|||||||||||
| Consolidated Revenue |
218,671 | 199,864 | 18,807 | 100.0 | % | 100.0 | % | |||||||||||||
| OPERATING EXPENSE |
||||||||||||||||||||
| Transportation and Services |
159,073 | 180,290 | (21,217 | ) | ||||||||||||||||
| Manufacturing (external and internal) |
51,930 | 35,454 | 16,476 | |||||||||||||||||
| Intersegment manufacturing elimination |
(10,152 | ) | (53 | ) | (10,099 | ) | ||||||||||||||
|
|
|
|
|
|
|
|
|
|
|
|||||||||||
| Consolidated Operating Expense |
200,851 | 215,691 | (14,840 | ) | 91.9 | % | 107.9 | % | ||||||||||||
| OPERATING INCOME |
||||||||||||||||||||
| Transportation and Services |
15,123 | (16,973 | ) | 32,096 | ||||||||||||||||
| Manufacturing (external and internal) |
2,697 | 1,146 | 1,551 | |||||||||||||||||
| Intersegment manufacturing elimination |
— | — | — | |||||||||||||||||
|
|
|
|
|
|
|
|
|
|
|
|||||||||||
| Consolidated Operating Income (Loss) |
17,820 | (15,827 | ) | 33,647 | 8.1 | % | (7.9 | )% | ||||||||||||
| Interest Expense |
16,487 | 15,505 | 982 | |||||||||||||||||
| Other Expense (Income) |
(265 | ) | (213 | ) | (52 | ) | ||||||||||||||
|
|
|
|
|
|
|
|||||||||||||||
| Income (Loss) Before Income Taxes |
1,598 | (31,119 | ) | 32,717 | ||||||||||||||||
| Income Taxes |
739 | (10,193 | ) | 10,932 | ||||||||||||||||
| Discontinued Operations |
— | 134 | (134 | ) | ||||||||||||||||
|
|
|
|
|
|
|
|||||||||||||||
| Net Income (Loss) |
$ | 859 | $ | (20,792 | ) | $ | 21,651 | |||||||||||||
|
|
|
|
|
|
|
|||||||||||||||
| Domestic Barges Operated (average of period beginning and end) |
1,975 | 2,393 | (418 | ) | ||||||||||||||||
| Revenue per Barge Operated (Actual) |
$ | 88,201 | $ | 68,248 | $ | 19,953 | ||||||||||||||
30
Table of Contents
Revenue. Consolidated revenue increased by $18.8 million to $218.7 million, a 9.4% increase compared with $199.9 million for the quarter ended June 30, 2011.
Transportation and services revenues increased by $10.9 million, or 6.7% in the second quarter, compared to the same period of 2011. The increase was driven by a 3.4% increase in affreightment ton-mile volume to 7.4 billion ton-miles, with the increase in coal and grain ton-mile volumes partially offset by decreases in bulk affreightment volume. For the second quarter 2012, non-affreightment revenues increased by $10.5 million, or 22.1%, primarily due to higher charter/day rate revenue, higher liquid towing revenue, higher liquid demurrage and higher fleet revenue partially offset by lower demurrage and towing revenues from our fleet of dry barges. Overall transportation revenues increased approximately 4.2% in the quarter ended June 30, 2012 on a fuel neutral basis compared to the same period of the prior year. The increase in the quarter was driven by volume increases in petroleum, chemicals, fertilizer, other bulk products, liquid charter and coal, offset by declines in grain, steel, cement, dry demurrage and salt, as overall fuel-neutral rates per ton-mile declined by approximately 5.6% in the quarter compared to prior year, primarily due to an increase in dry barge availability due to declines in domestic coal demand. Our achieved grain pricing, across all river segments, was down 25.3% in the second quarter of 2012 compared to the same period of the prior year.
Revenues per average barge operated increased 29.2% in the second quarter of 2012, compared to the same period of the prior year. The increase in the quarter was driven equally by increased affreightment revenue and the increase in non-affreightment revenue due largely to liquid charter and day rate revenue increases.
The increase in transportation segment revenues was achieved operating an average barge fleet that was 17.5% smaller and a boat fleet that was 8.9% smaller than the prior year.
Manufacturing segment revenues increased 21.7% in the second quarter of 2012 over the same period of the prior year to $44.5 million, with 79 total external barges sold compared to 70 in the prior year period.
Operating Expense. Consolidated operating expense decreased by $14.8 million, or 6.9%, to $200.9 million in the second quarter of 2012 compared to the same quarter of 2011.
Transportation segment expenses were $21.2 million lower in the second quarter of 2012 than in the comparable quarter of 2011. The decrease in transportation segment operating expenses was attributable to the absence of the estimated $10.4 million margin impact of the flooding that occurred in the prior year second quarter, $7.2 million lower boat and barge repairs related to both the boat repower program and lower repairs associated with the significant retirement of older barge assets; $2.8 million benefit of lower fuel pricing and improved fuel efficiency; $1.3 million lower selling, general and administrative expenses (“SG&A”) and $0.2 million higher gains on sale of assets. These factors were partially offset by higher labor and fringe benefits. The decrease in SG&A resulted primarily from lower consulting expenses, lower severance-related expenses and lower wage-related costs.
Manufacturing operating expenses increased by $6.4 million due primarily to a higher number of external barges produced in the second quarter of 2012 compared to the second quarter of 2011.
Operating Income. Consolidated operating income increased by $33.6 million to $17.8 million in the second quarter of 2012 compared to the second quarter of 2011. Operating income in the transportation segment increased by $32.1 million over the same period of 2011 driven by higher revenues and the improved cost efficiencies discussed above. The increase in revenues were achieved through higher ton-mile volume moved with a smaller fleet of boats and barges, despite overall mainline rates per ton-mile declining by approximately 3.0% quarter-over-quarter.
Operating income in the manufacturing segment increased by $1.6 million driven by improved efficiency in labor and materials, higher production volume and favorable weather in the current year quarter.
Interest Expense. Interest expense increased approximately $1.0 million from the prior year quarter with higher average outstanding debt balances in the 2012 quarter offset by to lower net amortization of the Acquisition date premium on the 2017 Notes and debt issuance costs as well as higher interest expense in the current year on obligations other than debt.
Income Tax Expense. The effective tax rates for the second quarters of 2012 and 2011 were 46.3% and 32.8%, respectively. Both rates represent the application of statutory rates to taxable income impacted by consistent levels of permanent book tax differences on differing expected full year income in 2012 compared to 2011.
Net Income (Loss). The net income was higher in the current year quarter due to the reasons noted above.
31
Table of Contents
Six Months Ended June 30, 2012 as compared with Six Months Ended June 30, 2011
ACL 1 CORPORATION OPERATING RESULTS by BUSINESS SEGMENT
(Dollars in thousands except where noted)
(Unaudited)
| % of Consolidated Revenue |
||||||||||||||||||||
| Six Months Ended June 30, | Six Months | |||||||||||||||||||
| 2012 | 2011 | Variance | 2012 | 2011 | ||||||||||||||||
| REVENUE |
||||||||||||||||||||
| Transportation and Services |
$ | 356,469 | $ | 324,443 | $ | 32,026 | 81.6 | % | 86.1 | % | ||||||||||
| Manufacturing (external and internal) |
106,051 | 64,581 | 41,470 | 24.3 | % | 17.1 | % | |||||||||||||
| Intersegment manufacturing elimination |
(25,712 | ) | (12,027 | ) | (13,685 | ) | (5.9 | )% | (3.2 | )% | ||||||||||
|
|
|
|
|
|
|
|
|
|
|
|||||||||||
| Consolidated Revenue |
436,808 | 376,997 | 59,811 | 100.0 | % | 100.0 | % | |||||||||||||
| OPERATING EXPENSE |
||||||||||||||||||||
| Transportation and Services |
329,717 | 356,015 | (26,298 | ) | ||||||||||||||||
| Manufacturing (external and internal) |
99,520 | 64,480 | 35,040 | |||||||||||||||||
| Intersegment manufacturing elimination |
(25,712 | ) | (12,027 | ) | (13,685 | ) | ||||||||||||||
|
|
|
|
|
|
|
|
|
|
|
|||||||||||
| Consolidated Operating Expense |
403,525 | 408,468 | (4,943 | ) | 92.4 | % | 108.3 | % | ||||||||||||
| OPERATING INCOME |
||||||||||||||||||||
| Transportation and Services |
26,752 | (31,572 | ) | 58,324 | ||||||||||||||||
| Manufacturing (external and internal) |
6,531 | 101 | 6,430 | |||||||||||||||||
| Intersegment manufacturing elimination |
— | — | — | |||||||||||||||||
|
|
|
|
|
|
|
|
|
|
|
|||||||||||
| Consolidated Operating Income (Loss) |
33,283 | (31,471 | ) | 64,754 | 7.6 | % | (8.3 | )% | ||||||||||||
| Interest Expense |
32,767 | 26,864 | 5,903 | |||||||||||||||||
| Other Expense (Income) |
(303 | ) | (344 | ) | 41 | |||||||||||||||
|
|
|
|
|
|
|
|||||||||||||||
| Income (Loss) before Income Taxes |
819 | (57,991 | ) | 58,810 | ||||||||||||||||
| Income Taxes |
580 | (20,652 | ) | 21,232 | ||||||||||||||||
| Discontinued Operations |
26 | 37 | (11 | ) | ||||||||||||||||
|
|
|
|
|
|
|
|||||||||||||||
| Net Income (Loss) |
$ | 265 | $ | (37,302 | ) | $ | 37,567 | |||||||||||||
|
|
|
|
|
|
|
|||||||||||||||
| Domestic Barges Operated (average of period beginning and end) |
2,108 | 2,400 | (292 | ) | ||||||||||||||||
| Revenue per Barge Operated (Actual) |
$ | 169,103 | $ | 135,185 | $ | 33,918 | ||||||||||||||
32
Table of Contents
Revenue. Consolidated revenue increased by $59.8 million to $436.8 million in the six months ended June 30, 2012, a 15.9% increase compared with $377.0 million for the six months ended June 30, 2011.
Transportation and services revenues increased by $32.0 million, or 9.9% in the six months ended June 30, 2012, compared to the same period of 2011. Total affreightment volume measured in ton-miles increased for the six months ended June 30, 2012, to 15.6 billion compared to 14.5 billion in the same period of the prior year driven by increased coal and grain ton-mile volume partially offset by decreases in bulk affreightment volume.
For the six months ended June 30, 2012, non-affreightment revenues increased by $19.4 million, or 21.0%, primarily due to higher charter/day rate revenue, higher liquid towing revenue, higher liquid demurrage and higher fleet revenue partially offset by lower demurrage and towing revenues from our fleet of dry barges. On a fuel-neutral basis, overall transportation revenues increased approximately 5.6% for the six months ended June 30, 2012 on a fuel neutral basis compared to the same period of the prior year. The increase in the six month period was driven by volume increases in petroleum, coal, chemicals, fertilizer, other bulk products, liquid charter, liquid towing and coal, offset by declines in grain and steel, as overall fuel-neutral rates per ton-mile declined by approximately 6.2% in the six month period compared to prior year. Our achieved grain pricing, across all river segments, was down 15.5% in the six months ended June 30, 2012 compared to the same periods of the prior year.
Revenues per average barge operated increased 25.1% for the six months ended June 30, 2012, compared to the same periods of the prior year. Approximately 60% of the increase in the six month period was driven by increased affreightment revenue and the remainder of the increase attributable to increases in non-affreightment revenue driven largely by higher liquid charter and day rate revenue.
The increase in transportation segment revenues were achieved operating an average barge fleet that was 12.2% smaller and a boat fleet that was 8.9% smaller than the prior year.
Manufacturing segment revenues increased 52.9% in the six months ended June 30, 2012 compared to the same period of the prior year to $80.3 million, with 144 total barges sold compared to 99 in the prior year period.
Operating Expense. Consolidated operating expense decreased by $4.9 million, or 1.2%, to $403.5 million in the six months ended June 30, 2012, compared to the same period 2011.
Transportation segment expenses were $26.3 million lower in the six months ended June 30, 2012, than in the comparable period of 2011. The decrease in transportation segment operating expenses was attributable to the absence of the estimated $10.4 million margin impact of the flooding that occurred in the prior year second quarter; $6.6 million higher gains on asset dispositions: $6.0 million lower boat and barge repairs related to both the boat repower program and lower repairs associated with the significant retirement of older barge assets; $3.4 million benefit of lower fuel pricing offset by lower fuel efficiency of $2.4 million and $0.7 million lower SG&A. The decrease in SG&A resulted primarily from lower consulting expenses, lower severance-related expenses and lower wage-related costs.
Manufacturing operating expenses increased by $21.4 million due primarily to a higher number of external barges produced in the six months ended June 30, 2012, compared to the same period of the prior year.
Operating Income. Consolidated operating income increased by $64.8 million to $33.3 million in the six months ended June 30, 2012, compared to the same period in 2011. Operating income in the transportation segment increased by $58.3 million over the same period of 2011 driven by higher revenues and the improved cost efficiencies discussed above. The increase in revenues were achieved through higher ton-mile volume moved with a smaller fleet of boats and barges, despite overall mainline rates per ton-mile declining by approximately 1.8% in the first six months of 2012.
Operating income in the manufacturing segment increased by $6.4 million driven by improved efficiency in labor and materials, higher production volume and favorable weather in the current year six months ended June 30, 2012 when compared to the prior year.
Interest Expense. Interest expense increased by $5.9 million in the six months ended June 30, 2012 compared to the same period of the prior year. The increase resulted from a higher average outstanding debt balances in the six months ended June 30, 2012 as well as higher interest expense in the current year on obligations other than debt and lower net amortization of the Acquisition date premium on the 2017 Notes.
Income Tax Expense. The effective tax rates for the six months ended June 30, 2012 and 2011 were 70.8% and 35.6%, respectively. Both rates represent the application of statutory rates to taxable income impacted by consistent levels of permanent book tax differences on differing expected full year income in 2012 compared to 2011.
Net Income (Loss). The net income was higher in the current year quarter due to the reasons noted above.
33
Table of Contents
LIQUIDITY AND CAPITAL RESOURCES
Based on past performance and current expectations we believe that cash generated from operations and the liquidity available under our capital structure, described below, will satisfy the working capital needs, capital expenditures and other liquidity requirements associated with our operations in 2012.
Our funding requirements include capital expenditures (including barge purchases), vessel and barge fleet maintenance, interest payments and other working capital requirements. Our primary sources of liquidity at June 30, 2012, were cash generated from operations and borrowings under our Credit Facility. Other potential sources of liquidity include proceeds from sale leaseback transactions for fleet assets, barge scrapping and the sale of non-core, obsolete and surplus assets. We currently expect that our gross 2012 capital expenditures may exceed $200 million, which we currently expect to fund with draws under our Credit Facility and proceeds from boat sales and barge scrapping. For information regarding capital expenditures and proceeds of boat and barge sales in the first quarter of 2012 see “Net Cash, Capital Expenditures and Cash Flow” below.
Our cash operating costs consist primarily of purchased services, materials and repairs, fuel, labor and fringe benefits and taxes (collectively presented as Cost of Sales on the consolidated statements of operations) and selling, general and administrative costs.
Concurrently with the Acquisition, on December 21, 2010, CBL, ACL LLC, ACLTS and Jeffboat (the “Borrowers”), and ACL and certain subsidiaries as guarantors, entered into a credit agreement, consisting of a senior secured asset-based credit facility in an aggregate principal amount of $475.0 million with a final maturity date of December 21, 2015 (“Credit Facility”). The proceeds of the Credit Facility are available for use for working capital and general corporate purposes, including certain amounts payable by ACL in connection with the Acquisition. Availability under the Credit Facility is capped at a borrowing base, calculated based on certain percentages of the value of the Borrower’s vessels, inventory and receivables and subject to certain blocks and reserves, all as further set forth in the Credit Agreement. We are currently prohibited from incurring more than $390.0 million of indebtedness under the Credit Facility regardless of the size of the borrowing base until (a) all of the obligations (other than unasserted contingent obligations) under the indenture governing the 2017 Notes (defined below) are repaid, defeased, discharged or otherwise satisfied or (b) the indenture governing the 2017 Notes is replaced or amended or otherwise modified in a manner such that such additional borrowings would be permitted. At the Borrower’s option, the Credit Facility may be increased by $75.0 million, subject to certain requirements set forth in the Credit Agreement. The Credit Facility is secured by, among other things, a lien on substantially all of their tangible and intangible personal property (including but not limited to vessels, accounts receivable, inventory, equipment, general intangibles, investment property, deposit and securities accounts, certain owned real property and intellectual property), a pledge of the capital stock of each of ACL’s wholly owned restricted domestic subsidiaries, subject to certain exceptions and thresholds.
For any period that availability is less than a certain defined level set forth in the Credit Agreement (currently $48.8 million until the $390.0 million borrowing cap is further expanded) and until such level is exceeded for a consecutive 30-day period, the Credit Agreement imposes several financial covenants on the Borrowers, including (a) a minimum fixed charge coverage ratio (as defined in the Credit Agreement) of at least 1.1 to 1; and (b) a maximum first lien leverage ratio of 4.25 to 1.0. In addition, the Borrowers have agreed to maintain all cash (subject to certain exceptions) in deposit or security accounts with financial institutions that have agreed to control agreements whereby the lead bank, as agent for the lenders, has been granted control under specific circumstances. The Credit Agreement requires that the Borrowers comply with covenants relating to customary matters (in addition to those financial covenants described above), including with respect to incurring indebtedness and liens, using the proceeds received under the Credit Facility, effecting transactions with affiliates, making investments and acquisitions, effecting mergers and asset sales, prepaying indebtedness and paying dividends.
Our Indebtedness
At June 30, 2012, we had total indebtedness of $650.8 million, including the $26.4 million premium recorded at the Acquisition date to recognize the fair value of the 2017 Notes and the $3.2 million discount on the PIK Notes, net of amortization through June 30, 2012. At this level of debt we had $240.4 million in remaining current availability under our Credit Facility. The Credit Facility has no maintenance financial covenants unless borrowing availability is generally less than $48.8 million. At June 30, 2012, borrowing levels, the Company had availability that was $191.6 million above this threshold.
On February 15, 2011, ACL I completed a private placement of $250,000 in aggregate principal amount of 10.625%/11.375% Senior Payment in Kind (“PIK”) Toggle Notes due 2016 (the “PIK Notes”). Interest on the PIK Notes will accrue at a rate of 10.625% with respect to interest paid in cash and a rate of 11.375% with respect to interest paid by issuing additional PIK Notes. Selection of the interest payment method is solely a decision of ACL I. At the first interest payment date ACL I elected PIK interest, increasing the amount of PIK Notes outstanding by $14,219 to $264,219. On the second payment date ACL I also elected PIK interest which increased the PIK Notes by $15,027 to $279,246. The net of original issue discount proceeds of the PIK Notes offering were used primarily to pay a special dividend to ACL I’s stockholder to redeem equity advanced in connection with the acquisition of the Company by an affiliate of Platinum Equity, LLC and to pay certain costs and expenses related to the PIK Notes offering. The PIK Notes were registered effective May 10, 2012 and the exchange offer was completed on June 11, 2012. The PIK Notes are unsecured and are not guaranteed by ACL I’s subsidiaries.
On July 7, 2009, CBL issued $200 million aggregate principal amount of 12.5% senior secured second lien notes due July 15, 2017 (the “2017 Notes”). The issue price was 95.181% of the principal amount of the 2017 Notes. The original issue discount on the 2017 Notes was revised in purchase price accounting for the Acquisition to reflect a premium of $35,000, reflecting the fair market value of the 2017 Notes on the Acquisition date. The 2017 Notes are guaranteed by ACL and by certain of CBL’s existing and future domestic subsidiaries.
34
Table of Contents
Additionally, we are allowed to sell certain assets and consummate sale leaseback transactions on other assets to enhance our liquidity position. For a discussion of the interest rate under our credit facility, see Note 2 to the unaudited condensed consolidated financial statements included elsewhere in this Report.
With the remaining 3.5 year term on the Credit Facility, the 3.6 year remaining term on the PIK notes and remaining 5.0 year term on the 2017 Notes, we believe that we have an appropriate longer term, lower cost and flexible capital structure that will provide adequate liquidity and allow us to focus on executing our tactical and strategic plans through the various economic cycles.
Net Cash, Capital Expenditures and Cash Flow
In the six months ended June 30, 2012, net cash provided by operations was $51.2 million compared to cash flow used in operations of $16.0 million for the six months ended June 30, 2011. The change in cash provided by/used in operations is primarily attributable to improved operating results in six months ended June 30, 2012 compared to the prior year. Cash provided by working capital changes in the first six months of 2012 was $15.1 million as a result of higher interest accruals related to the PIK Notes. The use of cash for working capital in the first six months of 2011 of $30.4 million related primarily to the advance purchase of steel inventories in the manufacturing segment to lock in steel prices for builds early in that year.
Cash used in investing activities increased $27.1 million in the first six months of 2012 to $43.8 million, with total property additions and other investing activities increasing to $85.8 million in 2012 from $21.8 million in the same period in 2011 and higher proceeds from surplus boat dispositions of $12.1 million in the first quarter of 2012 and higher cash provided by barge scrapping operations of $26.6 million in the six months ended June 30, 2012. The capital expenditures in the first quarters of both 2012 and 2011 included new barge construction, capital repairs and investments in our facilities. During the first six months of 2012 we also began a major initiative to repower and upgrade certain of our boat assets resulting in a higher level of investment in 2012.
Net cash used in financing activities in the six months ended June 30, 2012 was $6.8 million, compared to net cash provided by financing activities of $31.0 million in the six months ended June 30, 2011. Cash used in financing activities in 2012 primarily related to repayments on the Credit Facility. Cash provided by financing activities in 2011 primarily related to issuance of the PIK notes, the dividend of the majority of the PIK Note proceeds, borrowings on the Credit Facility and a net increase in the level of bank overdrafts on our zero balance accounts, representing checks disbursed but not yet presented for payment, net of dividends to Finn, equal to the intrinsic value share-based compensation paid on shares vested in that period.
CHANGES IN ACCOUNTING STANDARDS
Periodically the Financial Accounting Standards Board (“FASB”) issues additional Accounting Standards Updates (“ASUs”). ASUs considered to have a potential impact on CBL where the impact is not yet determined are discussed as follows.
ASU Number 2011-5 was issued in June 2011, amending Topic 220 — Comprehensive Income. The ASU modifies alternative presentation standards, eliminating the option for disclosure of the elements of other comprehensive income within the statement of stockholder’s equity. Adoption of this ASU by the Company changed our previous presentation, but will not impact the components of other comprehensive income. The ASU is effective for fiscal periods beginning after December 15, 2011. ASU Number 2011-12 subsequently modified the effective date of certain provisions of the ASU concerning whether it is necessary to require entities to present reclassification adjustments by component in both the statement where net income is presented and the statement where other comprehensive income is presented for both interim and annual financial statements, reverting to earlier guidance until the Board completes its deliberations on the requested changes. The ASU, as modified, is effective for fiscal periods beginning after December 15, 2011.
ASU Number 2011-8 was issued in September 2011, amending Topic 350 Intangibles — Goodwill and Other. The ASU allows entities to first assess qualitative factors to determine whether the existence of events or circumstances lead to a determination that it is more likely than not that the fair value of a reporting unit is less than its carrying value, whereas previous guidance required as the first step in an at least annual evaluation a computation of the fair value of a reporting entity. The Company has not yet determined if it will use the qualitative assessment in 2012. The ASU is effective for fiscal periods beginning after December 15, 2011.
CRITICAL ACCOUNTING POLICIES
The preparation of financial statements in conformity with accounting principles generally accepted in the United States requires management to make estimates and assumptions that affect the reported amounts of assets and liabilities and disclosure of contingent assets and liabilities at the date of the financial statements and the reported amounts of revenues and expenses during the reporting period. Actual results could differ from those estimates. Some of the significant estimates underlying these financial statements include amounts recorded as reserves for doubtful accounts, probable loss estimates regarding long-term construction contracts, reserves for obsolete and slow moving inventories, pension and post-retirement liabilities, incurred but not reported medical claims, insurance claims and related insurance and third-party receivables, deferred tax liabilities, assets held for sale, revenues and expenses on special vessels using the percentage-of-completion method, environmental liabilities, valuation allowances related to deferred tax assets, expected forfeitures of share-based compensation, liabilities for unbilled barge and boat maintenance, liabilities for unbilled harbor and towing services, recoverability of acquisition goodwill and depreciable lives of long-lived assets.
35
Table of Contents
No significant changes have occurred to these policies, which are more fully described in the Company’s filing on Form S-4/A filed May 8, 2012. Operating results for the interim periods presented herein are not necessarily indicative of the results that may be expected for the year ending December 31, 2012. Our quarterly revenues and profits historically have been lower during the first six months of the year and higher in the last six months of the year due primarily to the timing of the North American grain harvest.
The accompanying unaudited condensed consolidated financial statements have been prepared on a going concern basis in accordance with generally accepted accounting principles for interim financial information and in accordance with the instructions to Form 10-Q and Article 10 of Regulation S-X. As such, they do not include all of the information and footnotes required by generally accepted accounting principles for complete financial statements. The condensed consolidated balance sheet as of December 31, 2011 has been derived from the audited consolidated balance sheet at that date. In the opinion of management, all adjustments (consisting of normal recurring accruals) considered necessary for a fair presentation have been included.
QUANTITATIVE AND QUALITATIVE DISCLOSURES ABOUT MARKET RISK
Market risk is the potential loss arising from adverse changes in market rates and prices, such as fuel prices and interest rates, and changes in the market value of financial instruments. We are exposed to various market risks, including those which are inherent in our financial instruments or which arise from transactions entered into in the course of business. A discussion of our primary market risk exposures is presented below. The Company neither holds nor issues financial instruments for trading purposes.
Fuel Price Risk
For the six months ended June 30, 2012, fuel expenses for fuel purchased directly and used by our boats represented 23.2% of our transportation revenues. Each one cent per gallon rise in fuel price increases our annual operating expense by approximately $0.6 million. We partially mitigate our direct fuel price risk through contract adjustment clauses in our term contracts. Contract adjustments are deferred either one quarter or one month, depending primarily on the age of the term contract. We have been increasing the frequency of contract adjustments to monthly as contracts renew to further limit our timing exposure. Additionally, fuel costs are only one element of the potential movement in spot market pricing, which generally respond only to long-term changes in fuel pricing. All of our grain movements, which comprised 13.4% of our total transportation segment revenues in the first six months of 2012, are priced in the spot market. Spot grain contracts are normally priced at, or near, the quoted tariff rates in effect for the river segment of the move at the time they are contracted, which ranges from immediately prior to the transportation services to 90 days or more in advance. We generally manage our risk related to spot rates by contracting for business over a period of time and holding back some capacity to leverage the higher spot rates in periods of high demand. Despite these measures fuel price risk impacts us for the period of time from the date of the price increase until the date of the contract adjustment (either one month or one quarter), making us most vulnerable in periods of rapidly rising prices. We also believe that fuel is a significant element of the economic model of our vendors on the river, with increases passed through to us in the form of higher costs for external shifting and towing. From time to time we have utilized derivative instruments to manage volatility in addition to our contracted rate adjustment clauses. Since 2008 we have entered into fuel price swaps with commercial banks for a portion of our expected fuel usage. These derivative instruments have been designated and accounted for as cash flow hedges, and to the extent of their effectiveness, changes in fair value of the hedged instrument will be accounted for through Other Comprehensive Income until the fuel hedged is used, at which time the gain or loss on the hedge instruments will be recorded as fuel expense. At June 30, 2012, a net liability of approximately $3.2 million has been recorded in the condensed consolidated balance sheet and the gain on the hedge instrument recorded in Other Comprehensive Income, net of hedge ineffectiveness of $0.03 million which was recorded as a reduction of fuel expense. Ultimate gains or losses will not be determinable until the fuel swaps are settled. Realized gains from our hedging program were $2.3 million and $6.2 million in the six months ended June 30, 2012 and 2011 respectively. We believe that the hedge program can decrease the volatility of our results and protects us against fuel costs greater than our swap price. Further information regarding our hedging program is contained in Note 8 of the Notes to Condensed Consolidated Financial Statements included in Part I, Item I of this Report. We may increase the quantity hedged based upon active monitoring of fuel pricing outlooks by the management team.
Interest Rate and Other Risks
At June 30, 2012, we had $148.4 million of floating rate debt outstanding, which represented the outstanding balance of the Credit Facility. If interest rates on our floating rate debt increase significantly, our cash flows could be reduced, which could have an adverse effect on our business, financial condition and results of operations. Each 100 basis point increase in interest rates, at our existing debt level, would increase our cash interest expense by approximately $1.5 million annually. This amount would be mitigated, in part, by the tax deductibility of the increased interest payments.
Foreign Currency Exchange Rate Risks
The Company currently has no direct exposure to foreign currency exchange risk although exchange rates do impact the volume of goods imported and exported that are transported by barge.
36
Table of Contents
| ITEM 3. | QUANTITATIVE AND QUALITATIVE DISCLOSURES ABOUT MARKET RISK |
Quantitative and qualitative disclosures about market risk are incorporated herein by reference from Item 2.
| ITEM 4. | CONTROLS AND PROCEDURES |
We evaluated the effectiveness of the design and operation of our disclosure controls and procedures, as defined in Rules 13a-15(e) and 15d-15(e) of the Securities Exchange Act of 1934, as amended (the “Exchange Act”), as of the end of the period covered by this report. Our principal executive and financial officers supervised and participated in the evaluation. Based on the evaluation, our principal executive and financial officers each concluded that, as of the end of the period covered by this report, due to a material weakness in our internal control over financial reporting that existed as of June 30, 2012, our disclosure controls and procedures were not effective in providing reasonable assurance that information that we are required to disclose in the reports that we file or submit under the Exchange Act is recorded, processed, summarized and reported, within the time periods specified in the Commission’s rules and forms.
As described in the Current Report on Form 8-K filed on the date hereof, the material weakness identified resulted in an error in the classification of cash flows related to cash proceeds that were generated from barge scrapping activities during the three month period ended March 31,2012. Such cash proceeds were included in cash flows from operating activities rather than as cash proceeds from investing activities. The misclassification during the three month period ended March 31, 2012, solely affected the subtotals of cash flows from operating and investing activities presented in the affected Consolidated Statement of Cash Flows, but had no impact on the net increase in total cash and cash equivalents for the three month period ended March 31, 2012. It also had no effect on any item in any of the related condensed consolidated statements of operations, condensed consolidated statement of comprehensive income, condensed consolidated balance sheet, or Adjusted EBITDAR (as defined in the Form 10-Q for the first quarter of 2012). The change in classification also had no effect-on the Company’s compliance with regulatory requirements, loan covenants or other contractual obligations.
The misclassification described above resulted from a material weakness in internal control over the preparation and review of the Consolidated Statement of Cash Flows. The Company modified its internal controls over the preparation and review of their Consolidated Statements of Cash Flows during the third quarter of 2012, and has implemented a process to address the correct classification of cash proceeds from scrapping operations. The Company corrected the misclassification in its second quarter Form 10-Q and also plans to amend its first quarter 10-Q to reflect the correct classification.
There have been no other changes made in the registrants’ internal control over financial reporting that occurred during the Company’s second quarter of 2012 that have materially affected, or are reasonably likely to materially affect, the registrants’ internal control over financial reporting. Based on the remediation of the material weakness referenced above, the Company’s chief executive officer and chief financial officer have concluded that the Company’s disclosure controls and procedures will be effective as of the filing date of its first quarter amended Form 10-Q.
| Item 1. | LEGAL PROCEEDINGS. |
The nature of our business exposes us to the potential for legal proceedings, including those relating to labor and employment, personal injury, property damage and environmental matters. Although the ultimate outcome of any legal matter cannot be predicted with certainty, based on present information, including our assessment of the merits of each particular claim, as well as our current reserves and insurance coverage, we do not expect that any known legal proceeding will in the foreseeable future have a material adverse impact on our financial condition or the results of our operations. See “Note 9” of the Notes to Condensed Consolidated Financial Statements included in Part I, Item I of this Report, which is incorporated herein by reference, for additional detail regarding ongoing legal proceedings.
| ITEM 1A. | RISK FACTORS |
Set forth below are some of the more significant factors that could affect our industry, our business and our results of operations. In addition to the other information in this document, you should consider carefully the following risk factors. Any of these risks or the occurrence of any one or more of the uncertainties described below could have a material adverse effect on our financial condition and the performance of our business.
Risks Relating to Our Industry
| • | The aftermath of the global economic crisis, which began in 2008, may continue to have detrimental impacts on our business. |
| • | Freight transportation rates for the Inland Waterways fluctuate from time to time and may decrease. |
| • | An oversupply of barging capacity may lead to reductions in freight rates. |
| • | Yields from North American and worldwide grain harvests could materially affect demand for our barging services. |
| • | Any decrease in future demand for new barge construction may lead to a reduction in sales volume and prices for new barges. |
| • | Volatile steel prices may lead to a reduction in or delay of demand for new barge construction. |
| • | Higher fuel prices, if not recouped from our customers, could dramatically increase operating expenses and adversely affect profitability. |
| • | Our operating margins are impacted by a low margin legacy contract and by spot rate market volatility for grain volume and pricing. |
37
Table of Contents
| • | We are subject to adverse weather and river conditions, including marine accidents. |
| • | Seasonal fluctuations in industry demand could adversely affect our operating results, cash flow and working capital requirements. |
| • | The aging infrastructure on the Inland Waterways may lead to increased costs and disruptions in our operations. |
| • | The inland barge transportation industry is highly competitive; increased competition could adversely affect us. |
| • | Global trade agreements, tariffs and subsidies could decrease the demand for imported and exported goods, adversely affecting the flow of import and export tonnage through the Port of New Orleans and the demand for barging services. |
| • | Our failure to comply with government regulations affecting the barging industry, or changes in these regulations, may cause us to incur significant expenses or affect our ability to operate. |
| • | Our maritime operations expose us to numerous legal and regulatory requirements, and violation of these regulations could result in criminal liability against us or our officers. |
| • | The Jones Act restricts foreign ownership of our stock, and the repeal, suspension or substantial amendment of the Jones Act could increase competition on the Inland Waterways and have a material adverse effect on our business. |
Risks Relating to Our Business
| • | We are named as a defendant in lawsuits and we are in receipt of other claims and we cannot predict the outcome of such litigation and claims, which may result in the imposition of significant liability. |
| • | Our aging fleet of dry cargo barges may lead to a decline in revenue if we do not replace the barges or drive efficiency in our operations. |
| • | Our cash flows and borrowing facilities may not be adequate for our additional capital needs and our future cash flow and capital resources may not be sufficient for payments of interest and principal of our substantial indebtedness. |
| • | A significant portion of our borrowings are tied to floating interest rates which may expose us to higher interest payments should interest rates increase substantially. |
| • | We face the risk of breaching covenants in our Credit Facility. |
| • | Our insurance may not be adequate to cover our operational risks. |
| • | The loss of one or more key customers, or material nonpayment or nonperformance by one or more of our key customers, could cause a significant loss of revenue and may adversely affect profitability. |
| • | A major accident or casualty loss at any of our facilities or affecting free navigation of the Gulf or the Inland Waterways could significantly reduce production. |
| • | Potential future acquisitions or investments in other companies may have a negative impact on our business. |
| • | A temporary or permanent closure of the Calumet River to barge traffic in the Chicago area in response to the threat of Asian carp migrating into the Great Lakes may have an adverse effect on operations in the area. |
| • | Interruption or failure of our information technology and communications systems, or compliance with requirements related to controls over our information technology protocols, could impair our ability to effectively provide our services or the integrity of our information. |
| • | Many of our employees are covered by federal maritime laws that may subject us to job-related claims. |
| • | We have experienced work stoppages by union employees in the past, and future work stoppages may disrupt our services and adversely affect our operations. |
38
Table of Contents
| • | The loss of key personnel, including highly skilled and licensed vessel personnel, could adversely affect our business. |
| • | Failure to comply with environmental, health and safety regulations could result in substantial penalties and changes to our operations. |
| • | We are subject to, and may in the future be subject to disputes, or legal or other proceedings that could involve significant expenditures by us. |
These risks are described in more detail under “Risk Factors” in Part I, Item 1A of our Form 10-K for the year ended December 31, 2011. We encourage you to read these risk factors in their entirety.
| ITEM 2. | UNREGISTERED SALES OF EQUITY SECURITIES AND USE OF PROCEEDS |
Not applicable.
| ITEM 3. | DEFAULTS UPON SENIOR SECURITIES |
Not applicable.
| ITEM 4. | MINE SAFETY DISCLOSURES |
Not applicable.
| ITEM 5. | OTHER INFORMATION |
Not applicable.
39
Table of Contents
| ITEM 6. | EXHIBITS |
| Exhibit |
Description | |
| 3.1 | Amended and Restated Certificate of Incorporation of Finn Intermediate Holding Corporation (Incorporated by reference to Exhibit 3.1 to the Registrant’s Registration Statement on Form S-4, filed on December 6, 2011). | |
| 3.2 | Finn Intermediate Holding Corporation Bylaws (Incorporated by reference to Exhibit 3.2 to the Registrant’s Registration Statement on Form S-4, filed on December 6, 2011). | |
| 4.1 | Indenture, dated as of February 15, 2011, by and between ACL I Corporation and The Bank of New York Mellon Trust Company, N.A., as trustee, governing the 10.625% / 11.375% Senior PIK Toggle Notes due 2016 (Incorporated by reference to Exhibit 4.1 to the Registrant’s Registration Statement on Form S-4, filed on December 6, 2011). | |
| 4.2 | Registration Rights Agreement, dated February 15, 2011, by and between ACL I Corporation and Merrill Lynch, Pierce, Fenner & Smith Incorporated (Incorporated by reference to Exhibit 4.2 to the Registrant’s Registration Statement on Form S-4, filed on December 6, 2011). | |
| 4.3 | Form of 10.625% / 11.375% Senior PIK Toggle Notes due 2016 (included as Exhibit A to Exhibit 4.1 and incorporated by reference to Exhibit 4.1 to the Registrant’s Registration Statement on Form S-4, filed on December 6, 2011). | |
| 10.1 | 2012 Annual Incentive Plan for Salaried Employees (Incorporated by reference to Exhibit 10.1 to Commercial Barge Line Company’s Current Report on Form 8-K, filed on April 3, 2012). | |
| 10.2 | Letter amendment, dated May 9, 2012, by and between American Commercial Lines Inc. and David Huls (Incorporated by reference to Exhibit 10.2 to Commercial Barge Line Company’s Quarterly Report on Form 10-Q, filed on May 11, 2012). | |
| 31.1* | Certification by Mark K. Knoy, Chief Executive Officer, required by Rule 13a-14(a) of the Securities Exchange Act of 1934. | |
| 31.2* | Certification by David J. Huls, Chief Financial Officer, required by Rule 13a-14(a) of the Securities Exchange Act of 1934. | |
| 32.1* | Certification by Mark K. Knoy, Chief Executive Officer, pursuant to 18 U.S.C. Section 1350. | |
| 32.2* | Certification by David J. Huls, Chief Financial Officer, pursuant to 18 U.S.C. Section 1350. | |
| * | Filed herein |
40
Table of Contents
Pursuant to the requirements of the Securities Exchange Act of 1934, the registrant has duly caused this report to be signed on its behalf by the undersigned thereunto duly authorized.
| ACL I Corporation | ||
| By: | /S/ MARK K. KNOY | |
| Mark K. Knoy | ||
| President and Chief Executive Officer | ||
| By: | /S/ DAVID J. HULS | |
| David J. Huls | ||
| Chief Financial Officer | ||
| (Principal Financial Officer) | ||
Date: August 14, 2012
41
Table of Contents
INDEX TO EXHIBITS
| Exhibit |
Description | |
| 3.1 | Amended and Restated Certificate of Incorporation of Finn Intermediate Holding Corporation (Incorporated by reference to Exhibit 3.1 to the Registrant’s Registration Statement on Form S-4, filed on December 6, 2011). | |
| 3.2 | Finn Intermediate Holding Corporation Bylaws (Incorporated by reference to Exhibit 3.2 to the Registrant’s Registration Statement on Form S-4, filed on December 6, 2011). | |
| 4.1 | Indenture, dated as of February 15, 2011, by and between ACL I Corporation and The Bank of New York Mellon Trust Company, N.A., as trustee, governing the 10.625% / 11.375% Senior PIK Toggle Notes due 2016 (Incorporated by reference to Exhibit 4.1 to the Registrant’s Registration Statement on Form S-4, filed on December 6, 2011). | |
| 4.2 | Registration Rights Agreement, dated February 15, 2011, by and between ACL I Corporation and Merrill Lynch, Pierce, Fenner & Smith Incorporated (Incorporated by reference to Exhibit 4.2 to the Registrant’s Registration Statement on Form S-4, filed on December 6, 2011). | |
| 4.3 | Form of 10.625% / 11.375% Senior PIK Toggle Notes due 2016 (included as Exhibit A to Exhibit 4.1 and incorporated by reference to Exhibit 4.1 to the Registrant’s Registration Statement on Form S-4, filed on December 6, 2011). | |
| 10.1 | 2012 Annual Incentive Plan for Salaried Employees (Incorporated by reference to Exhibit 10.1 to Commercial Barge Line Company’s Current Report on Form 8-K, filed on April 3, 2012). | |
| 10.2 | Letter amendment, dated May 9, 2012, by and between American Commercial Lines Inc. and David Huls (Incorporated by reference to Exhibit 10.2 to Commercial Barge Line Company’s Quarterly Report on Form 10-Q, filed on May 11, 2012). | |
| 31.1* | Certification by Mark K. Knoy, Chief Executive Officer, required by Rule 13a-14(a) of the Securities Exchange Act of 1934. | |
| 31.2* | Certification by David J. Huls, Chief Financial Officer, required by Rule 13a-14(a) of the Securities Exchange Act of 1934. | |
| 32.1* | Certification by Mark K. Knoy, Chief Executive Officer, pursuant to 18 U.S.C. Section 1350. | |
| 32.2* | Certification by David J. Huls, Chief Financial Officer, pursuant to 18 U.S.C. Section 1350. | |
| * | Filed herein |