Attached files
| file | filename |
|---|---|
| 8-K - REPUBLIC BANCORP, INC. 8-K - REPUBLIC BANCORP INC /KY/ | a50374876.htm |
EXHIBIT 99.1
2012 Raymond James Bank Conference August 14, 2012
Safe Harbor During the course of this presentation, we will be providing you with a discussion of some of the factors we currently anticipate may influence the future results of Republic Bancorp, Inc. (“Republic” or the “Company”), as well as certain financial projections. We want to emphasize that these forward‐looking statements involve judgment, and that individual judgments may vary. Moreover, these statements are based on limited information available to us now, which is subject to change. Actual results may differ substantially from what we say today and no one should assume later that the comments we provide today are still valid. They speak only as of today. Specific risk factors that could change causing our projections not to be achieved are discussed in the “Risk Factors” section of our Form 10‐K filed with the Securities and Exchange Commission (“SEC”) on March 7, 2012, and other reports filed with the SEC from time to time.

Steve Trager Chairman and Chief Executive Officer
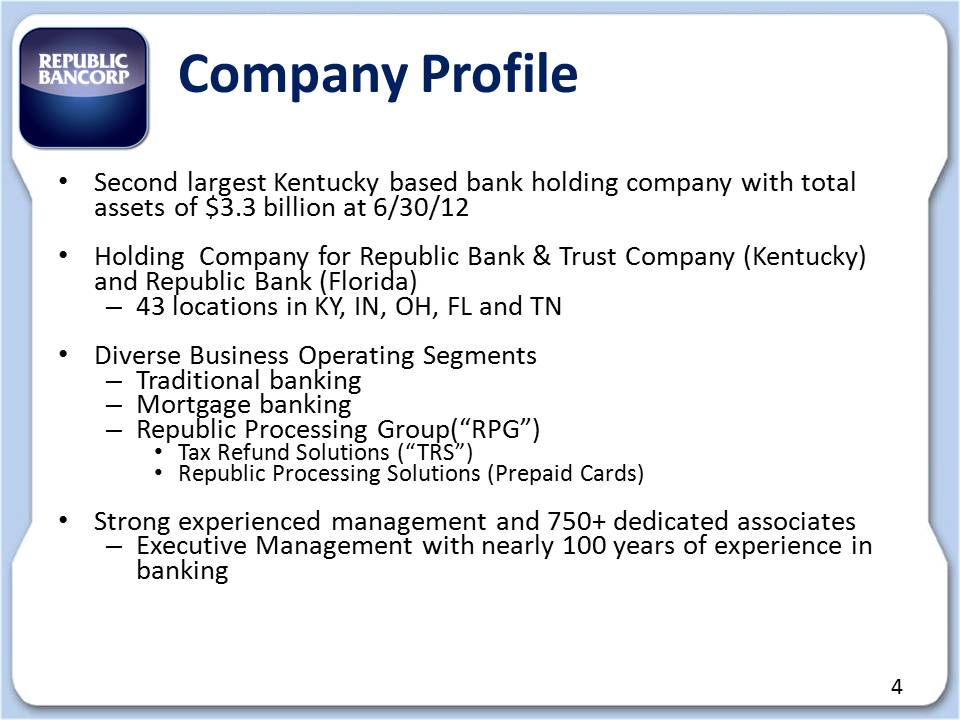
Company Profile 4 • Second largest Kentucky based bank holding company with total assets of $3.3 billion at 6/30/12 • Holding Company for Republic Bank & Trust Company (Kentucky) and Republic Bank (Florida) – 43 locations in KY, IN, OH, FL and TN • Diverse Business Operating Segments – Traditional banking – Mortgage banking – Republic Processing Group(“RPG”) • Tax Refund Solutions (“TRS”) • Republic Processing Solutions (Prepaid Cards) • Strong experienced management and 750+ dedicated associates – Executive Management with nearly 100 years of experience in banking
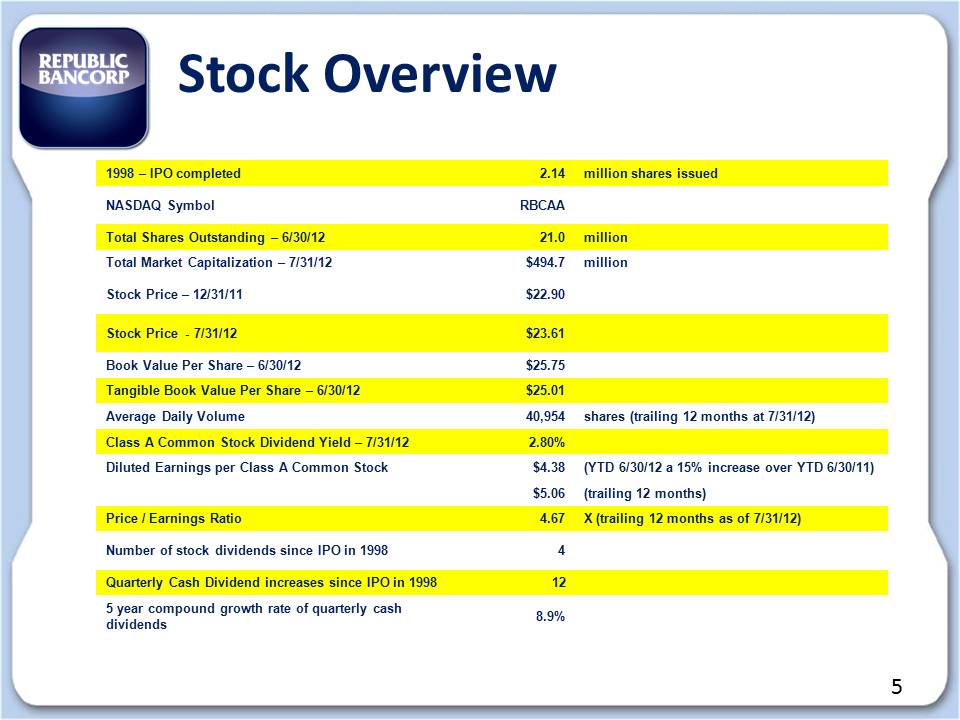
Stock Overview 1998 – IPO completed 2.14 million shares issued NASDAQ Symbol RBCAA Total Shares Outstanding – 6/30/12 21.0 million Total Market Capitalization – 7/31/12 $494.7 million Stock Price – 12/31/11 $22.90 Stock Price - 7/31/12 $23.61 Book Value Per Share – 6/30/12 $25.75 Tangible Book Value Per Share – 6/30/12 $25.01 Average Daily Volume 40,954 shares (trailing 12 months at 7/31/12) Class A Common Stock Dividend Yield – 7/31/12 2.80% Diluted Earnings per Class A Common Stock $4.38 (YTD 6/30/12 a 15% increase over YTD 6/30/11) $5.06 (trailing 12 months) Price / Earnings Ratio 4.67 X (trailing 12 months as of 7/31/12) Number of stock dividends since IPO in 1998 4 Quarterly Cash Dividend increases since IPO in 1998 12 5 year compound growth rate of quarterly cash dividends 8.9%
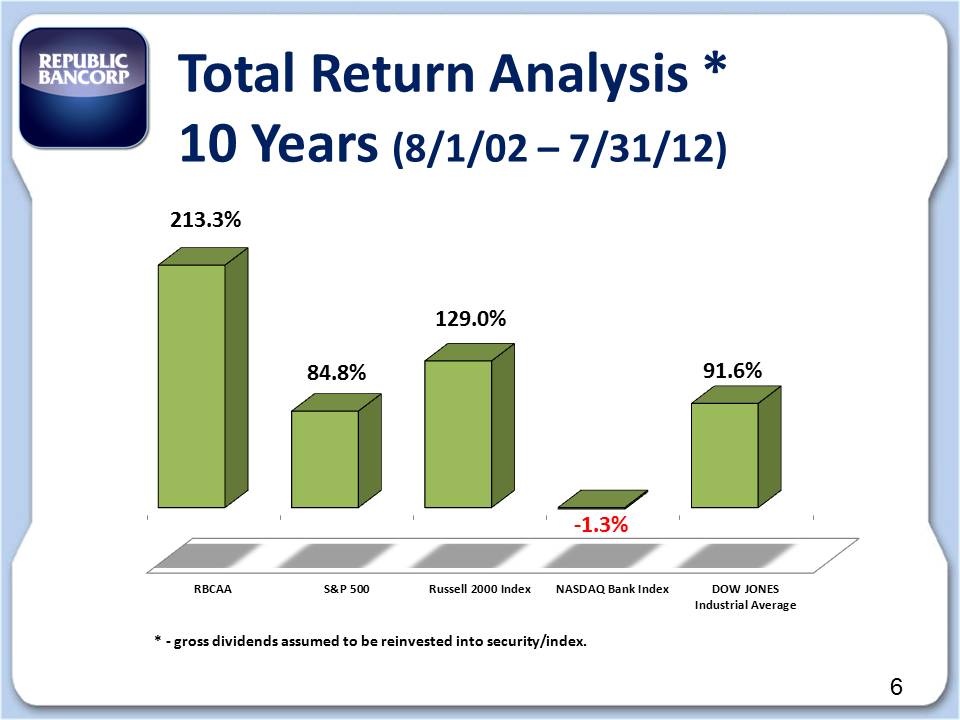
Total Return Analysis * 10 Years (8/1/02 – 7/31/12) * ‐ gross dividends assumed to be reinvested into security/index. RBCAA S&P 500 Russell 2000 Index NASDAQ Bank Index DOW JONES Industrial Average 213.3% 84.8% 129.0% ‐1.3% 91.6%
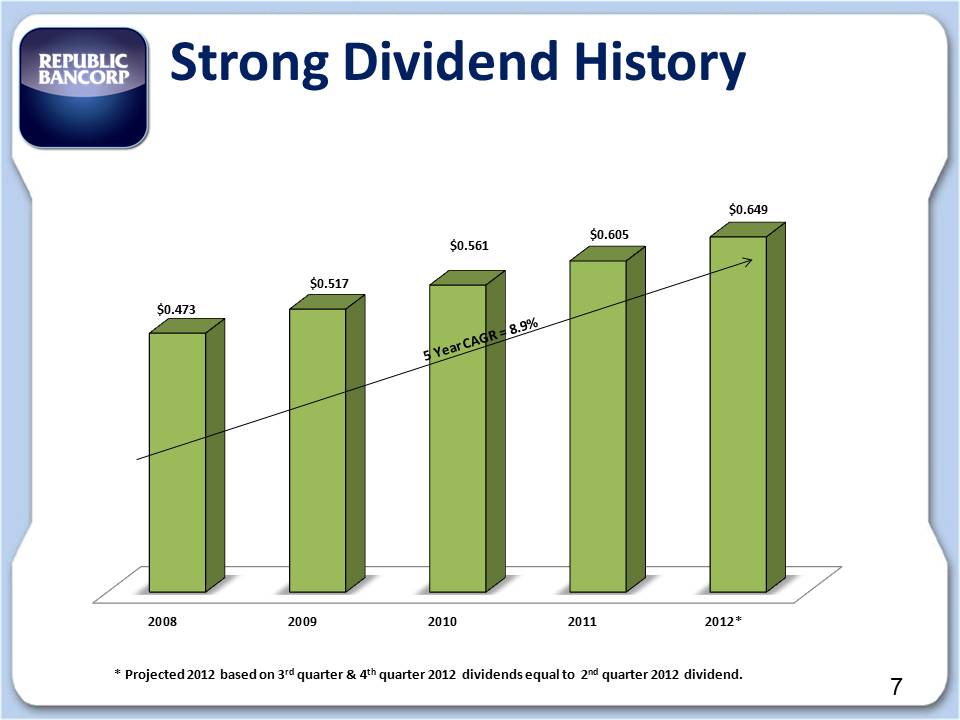
Strong Dividend History $0.473 $0.517 $0.561 $0.605 $0.649 * Projected 2012 based on 3rd quarter & 4th quarter 2012 dividends equal to 2nd quarter 2012 dividend. 2008 2009 2010 2011 2012*
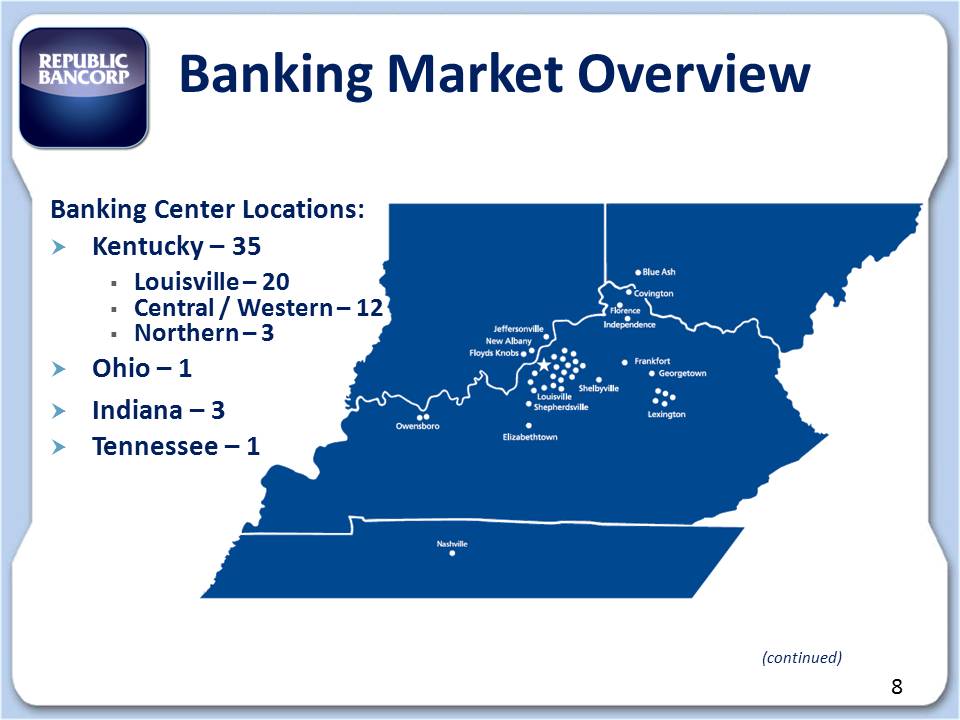
Banking Market Overview Banking Center Locations: Kentucky – 35 Louisville – 20 Central / Western – 12 Northern – 3 Ohio – 1 Indiana – 3 Tennessee – 1
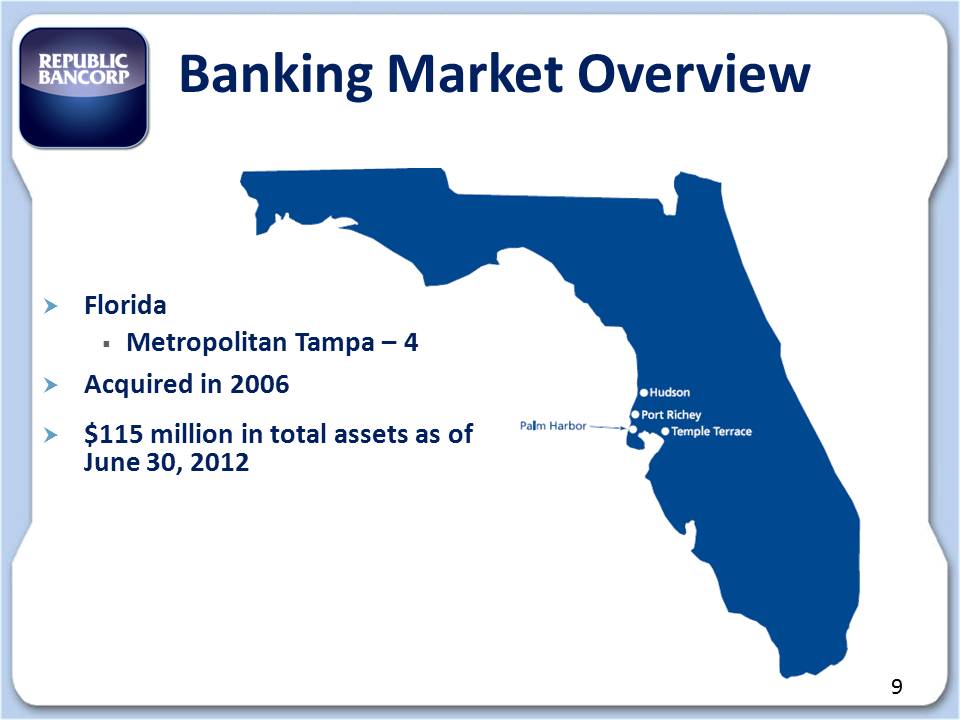
Banking Market Overview Florida Metropolitan Tampa – 4 Acquired in 2006 $115 million in total assets as of June 30, 2012
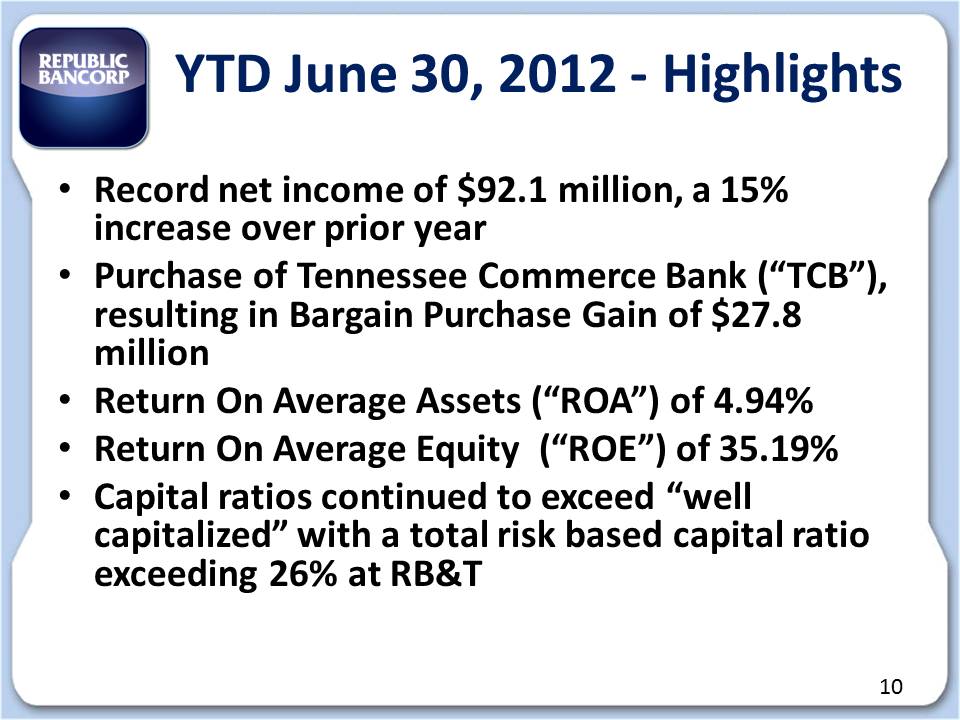
YTD June 30, 2012 ‐ Highlights • Record net income of $92.1 million, a 15% increase over prior year • Purchase of Tennessee Commerce Bank (“TCB”), resulting in Bargain Purchase Gain of $27.8 million • Return On Average Assets (“ROA”) of 4.94% • Return On Average Equity (“ROE”) of 35.19% • Capital ratios continued to exceed “well capitalized” with a total risk based capital ratio exceeding 26% at RB&T
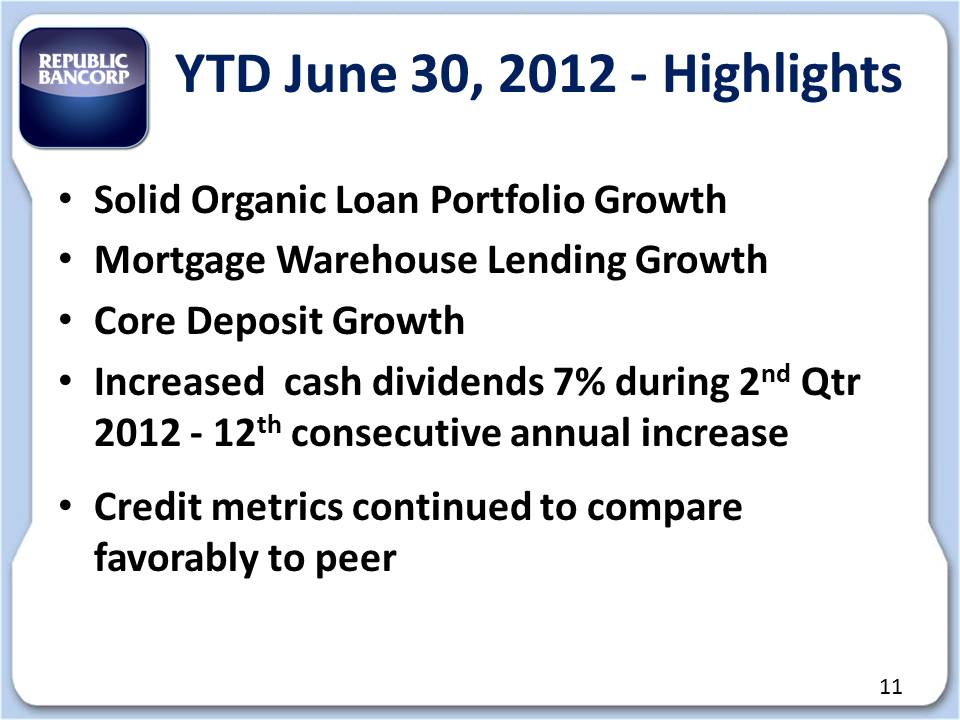
YTD June 30, 2012 ‐ Highlights • Solid Organic Loan Portfolio Growth • Mortgage Warehouse Lending Growth • Core Deposit Growth • Increased cash dividends 7% during 2nd Qtr 2012 ‐ 12th consecutive annual increase • Credit metrics continued to compare favorably to peer
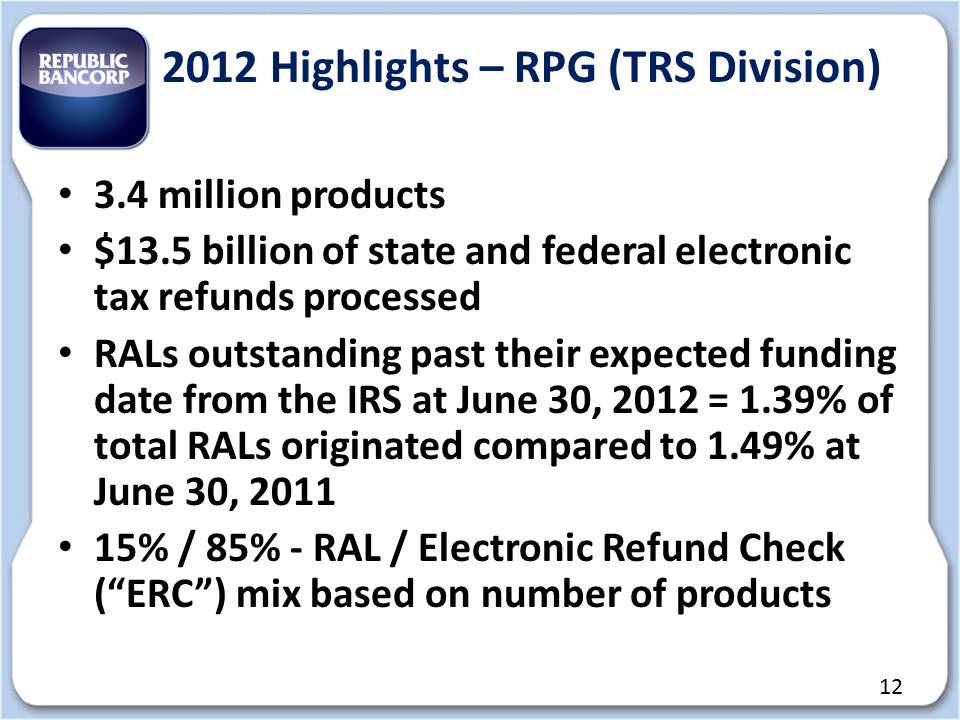
2012 Highlights – RPG (TRS Division) • 3.4 million products • $13.5 billion of state and federal electronic tax refunds processed • RALs outstanding past their expected funding date from the IRS at June 30, 2012 = 1.39% of total RALs originated compared to 1.49% at June 30, 2011 • 15% / 85% ‐ RAL / Electronic Refund Check (“ERC”) mix based on number of products
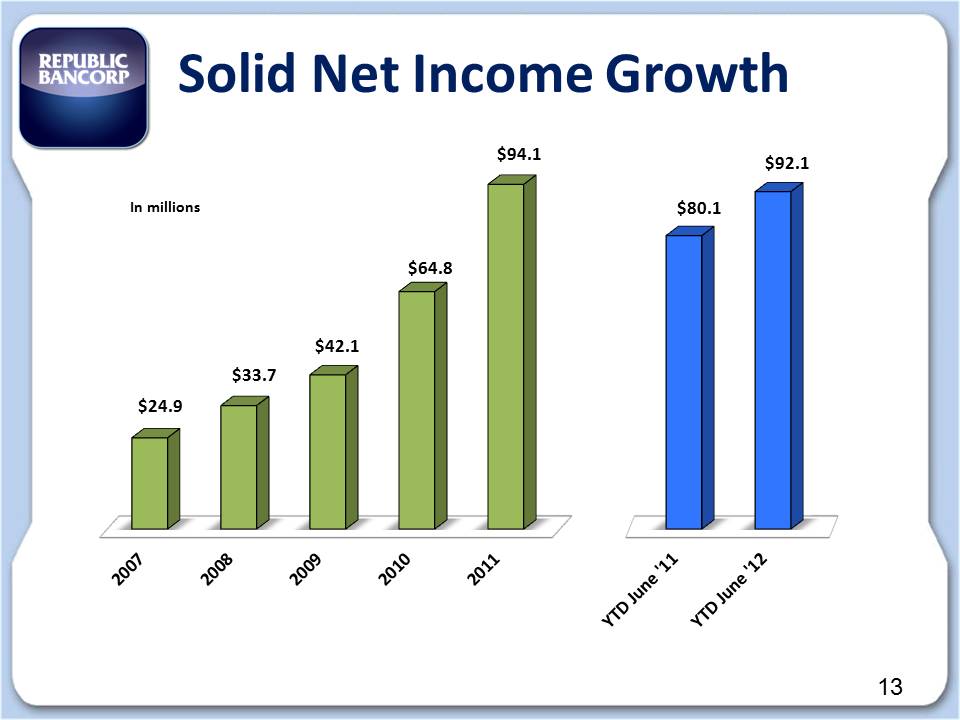
Solid Net Income Growth $24.9 $33.7 $42.1 $64.8 $94.1 $80.1 $92.1 In millions
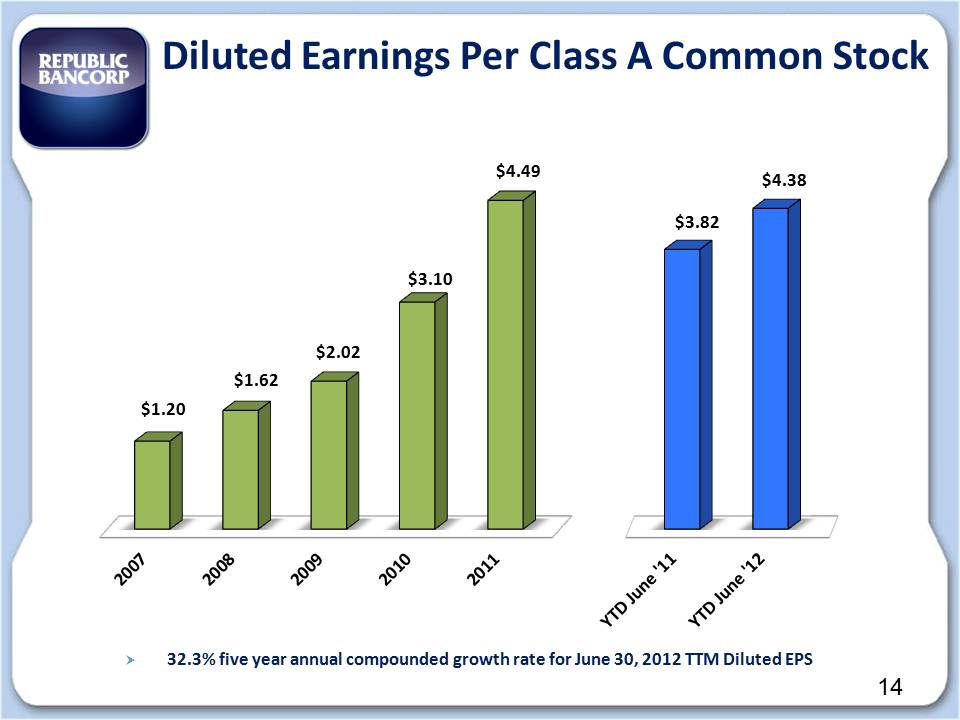
Diluted Earnings Per Class A Common Stock $1.20 $1.62 $2.02 $3.10 $4.49 $3.82 $4.38 32.3% five year annual compounded growth rate for June 30, 2012 TTM Diluted EPS

Balance Sheet
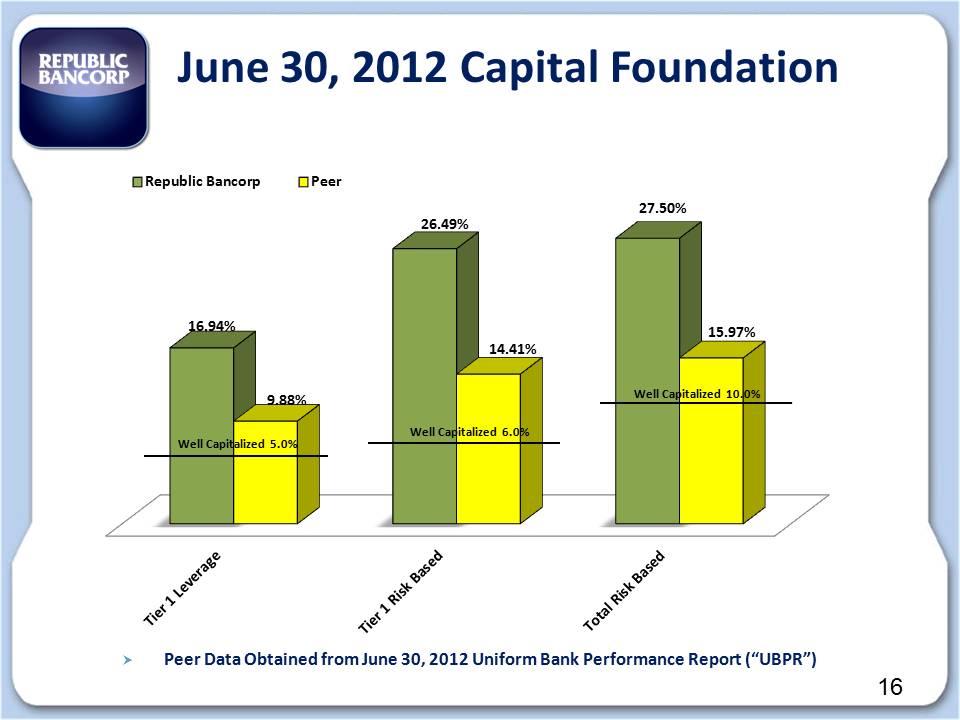
June 30, 2012 Capital Foundation Republic Bancorp Peer 16.94% 26.49% 27.50% 9.88% 14.41% 15.97% Republic Bancorp Peer Well Capitalized 5.0% Well Capitalized 6.0% Well Capitalized 10.0% Peer Data Obtained from June 30, 2012 Uniform Bank Performance Report (“UBPR”)
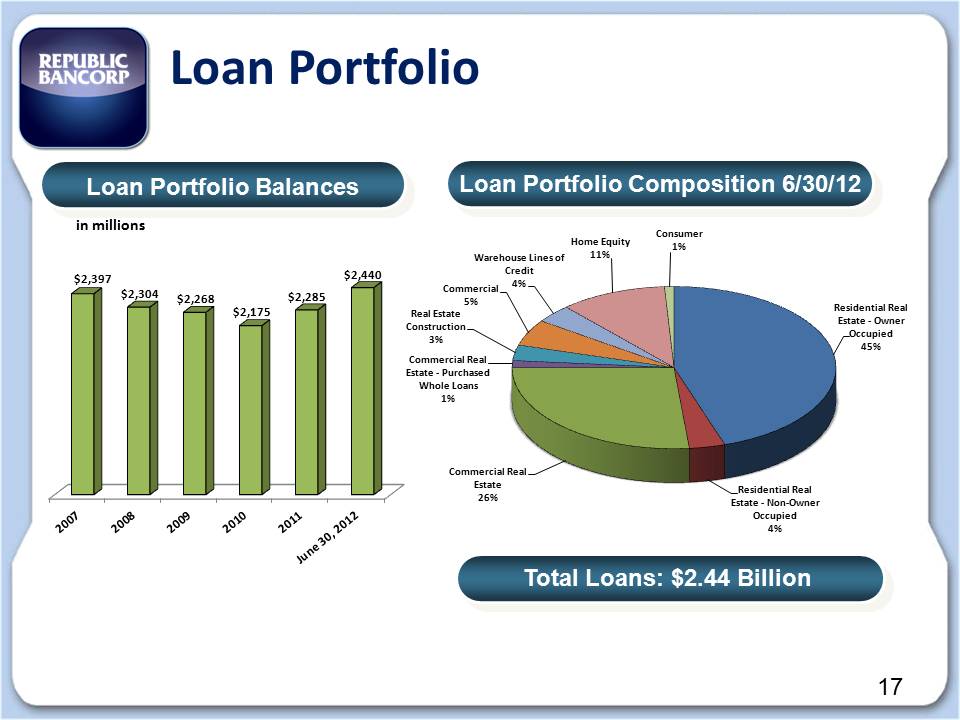
Loan Portfolio Loan Portfolio Balances in millions $2,397 $2,304 $2,268 $2,175 $2,285 $2,440 Loan Portfolio Composition 6/30/12 Residential Real Estate ‐ Owner Occupied 45% Residential Real Estate ‐ Non‐Owner Occupied 4% Commercial Real Estate 26% Commercial Real Estate ‐ Purchased Whole Loans 1% Real Estate Construction 3% Commercial 5% Warehouse Lines of Credit 4% Home Equity 11% Consumer Total Loans: $2.44 Billion
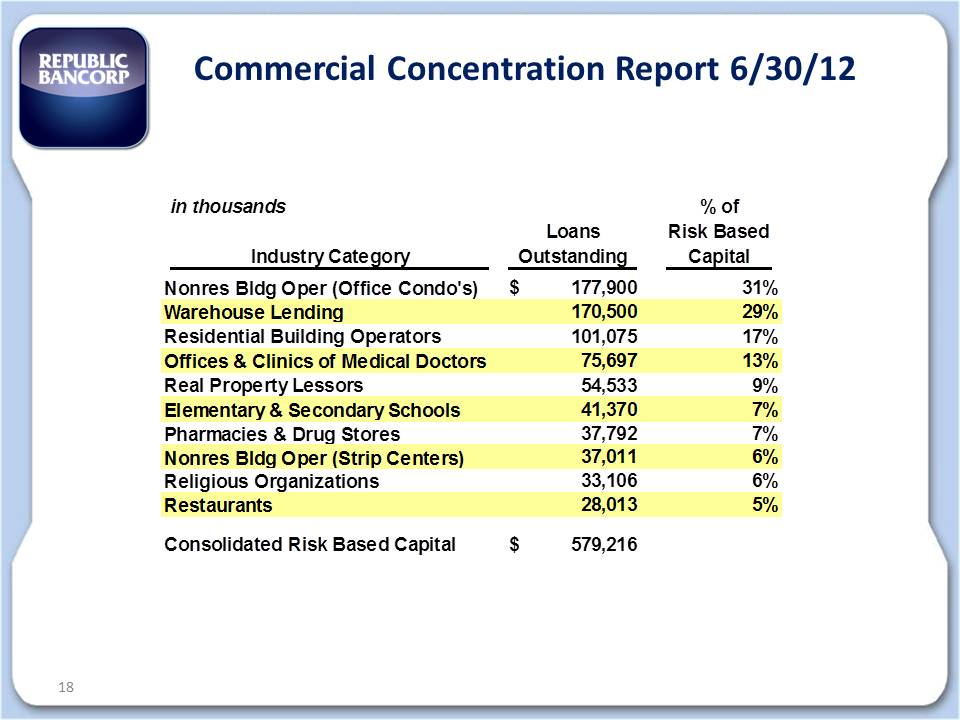
Commercial Concentration Report 6/30/12 in thousands % of Loans Risk Based Industry Category Outstanding Capital Nonres Bldg Oper (Office Condo's) 177,900 $ 31% Warehouse Lending 170,500 29% Residential Building Operators 101,075 17% Offices & Clinics of Medical Doctors 75,697 13% Real Property Lessors 54,533 9% Elementary & Secondary Schools 41,370 7% Pharmacies & Drug Stores 37,792 7% Nonres Bldg Oper (Strip Centers) 37,011 6% Religious Organizations 33,106 6% Restaurants 28,013 5% Consolidated Risk Based Capital 579,216
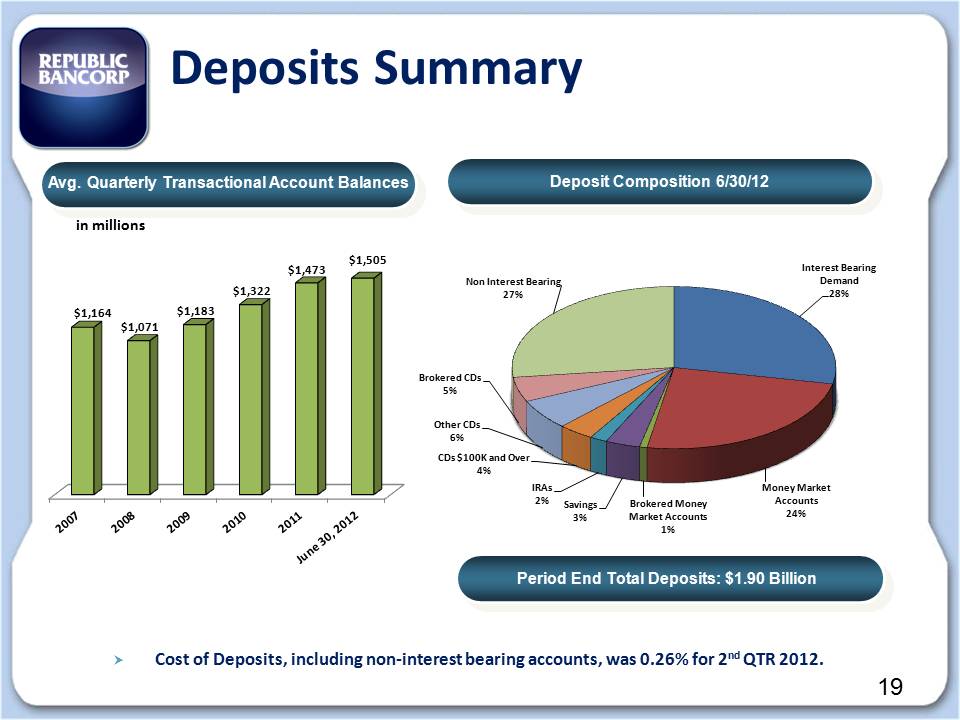
Interest Bearing Demand 28% Money Market Accounts 24% Brokered Money Market Accounts 1% Savings 3% IRAs 2% CDs $100K and Over 4% Other CDs 6% Brokered CDs 5% Non Interest Bearing 27% Avg. Quarterly Transactional Account Balances Deposit Composition 6/30/12 Period End Total Deposits: $1.90 Billion Deposits Summary $1,164 $1,071 $1,183 $1,322 $1,473 $1,505 in millions Cost of Deposits, including non‐interest bearing accounts, was 0.26% for 2nd QTR 2012.

Industry Strong Credit Quality
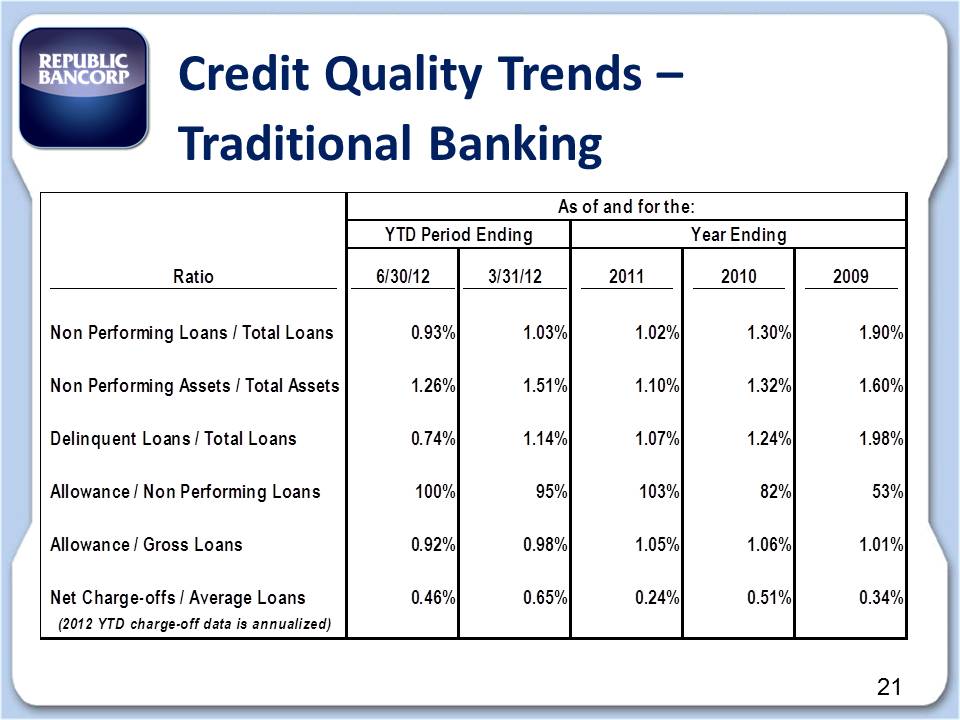
Credit Quality Trends – Traditional Banking Ratio 6/30/12 3/31/12 2011 2010 2009 Non Performing Loans / Total Loans 0.93% 1.03% 1.02% 1.30% 1.90% Non Performing Assets / Total Assets 1.26% 1.51% 1.10% 1.32% 1.60% Delinquent Loans / Total Loans 0.74% 1.14% 1.07% 1.24% 1.98% Allowance / Non Performing Loans 100% 95% 103% 82% 53% Allowance / Gross Loans 0.92% 0.98% 1.05% 1.06% 1.01% Net Charge-offs / Average Loans 0.46% 0.65% 0.24% 0.51% 0.34% (2012 YTD charge-off data is annualized) YTD Period Ending Year Ending As of and for the:
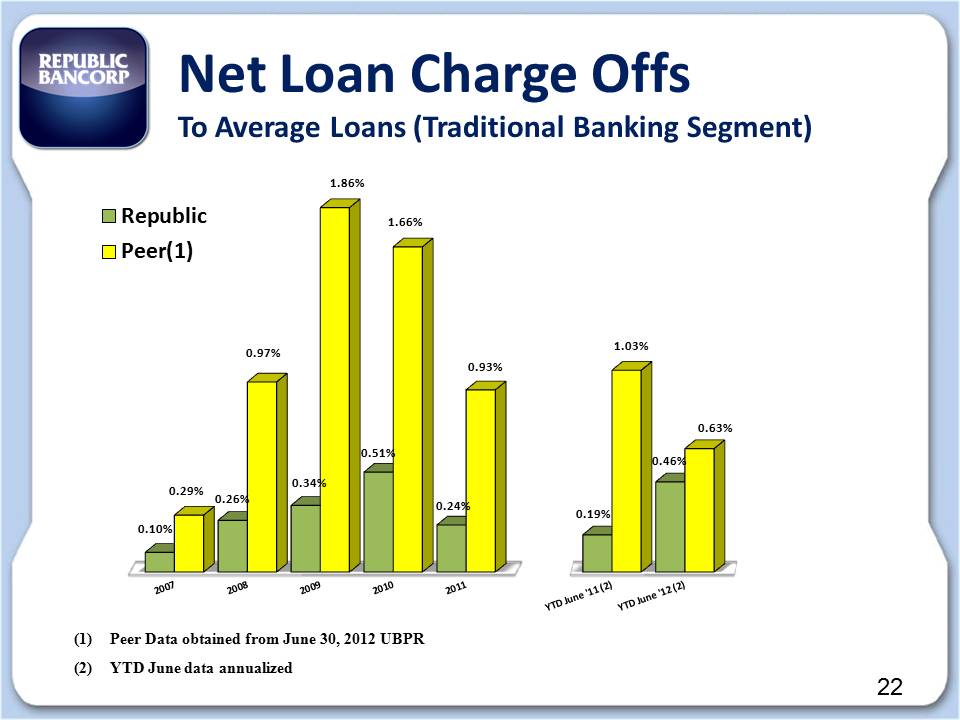
Net Loan Charge Offs To Average Loans (Traditional Banking Segment) 0.10% 0.26% 0.34% 0.51% 0.24% 0.19% 0.46% 0.29% 0.97% 1.86% 1.66% 0.93% 1.03% 0.63% Republic Peer(1) 22 (1) Peer Data obtained from June 30, 2012 UBPR (2) YTD June data annualized
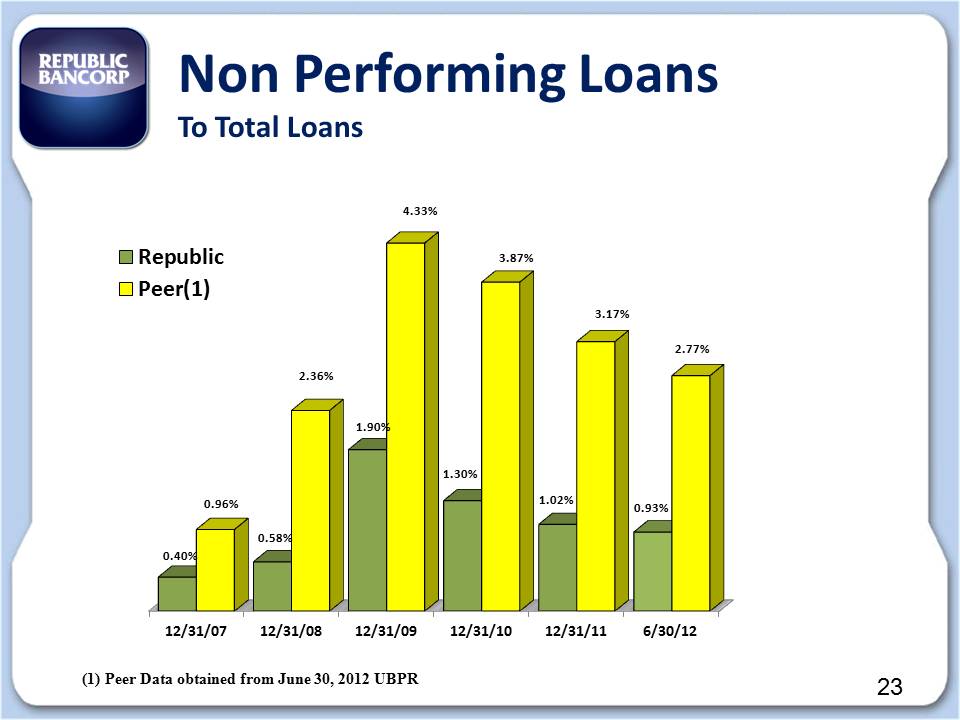
Non Performing Loans To Total Loans Republic Peer(1) 12/31/07 12/31/08 12/31/09 12/31/10 12/31/11 6/30/12 0.40% 0.58% 1.90% 1.30% 1.02% 0.93% 0.96% 2.36% 4.33% 3.87% 3.17% 2.77% (1) Peer Data obtained from June 30, 2012 UBPR
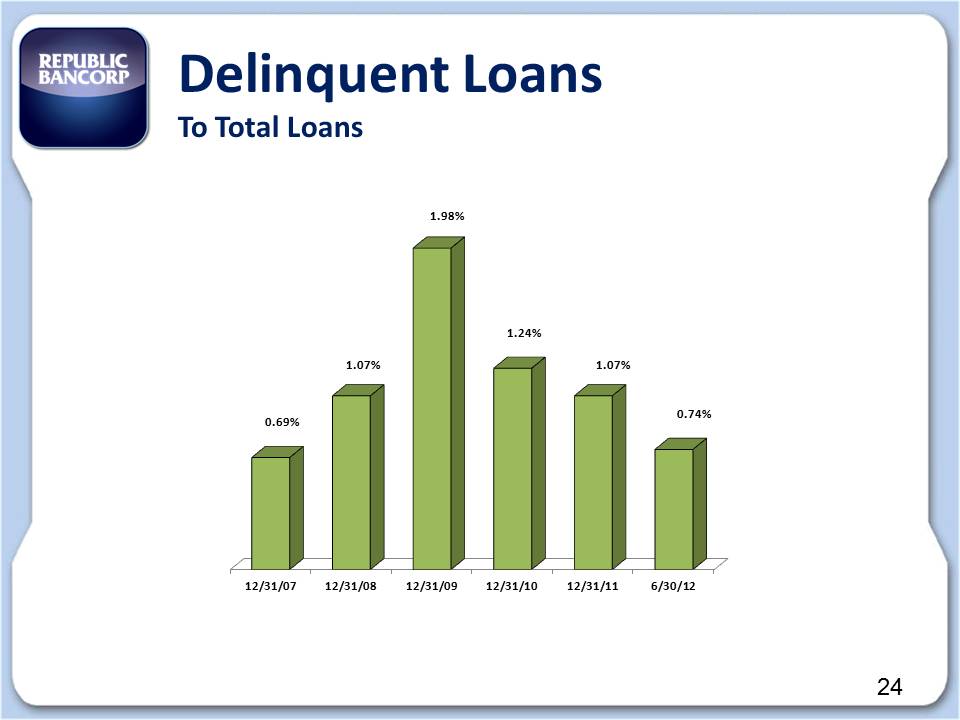
Delinquent Loans To Total Loans 12/31/07 12/31/08 12/31/09 12/31/10 12/31/11 6/30/12 0.69% 1.07% 1.98% 1.24% 1.07% 0.74%
Growth Initiatives • Grow existing product lines –Warehouse Lending, Credit Card, and Debit Card income • Develop new lines of business – Prepaid Cards • Make selective acquisitions • Add strategically located banking centers • Outperform peer financial performance • Focus on core deposit growth initiatives • Continue to improve on already solid loan quality metrics • Remain positioned for sustainable, profitable growth
2012 Challenges & Opportunities • Improve net interest margin by capitalizing on low cost deposit opportunities within Treasury Management • Control non‐interest expenses • Expand product offerings to the under‐served market through nontraditional delivery channels • Maintain industry‐strong credit quality • Continue the solid returns achieved at TRS • Increase presence in the Nashville market


THANK YOU