Attached files
| file | filename |
|---|---|
| 8-K - FORM 8-K - HomeStreet, Inc. | d394493d8k.htm |
Exhibit 99.1

Exhibit 99.1
Management Update – August 2012 NASDAQ:HMST
Important Disclosures
Forward-Looking Statements
We may make forward-looking statements during today’s presentation that are subject to many risks and uncertainties. These forward-looking statements are based on the Company’s current expectations, beliefs, projections, future plans and strategies, anticipated events or trends and similar expressions concerning matters that are not historical facts, as well as a number of assumptions concerning future events. These statements are subject to risks, uncertainties, assumptions and other important factors set forth in our SEC filings, including but not limited to our 2011 annual report on form 10-K, our proxy statement and the form 8-K containing our earnings release, many of which are outside of the Company’s control. Such factors could cause actual results to differ materially from the results discussed or implied in the forward-looking statements. Actual results may differ materially from those expressed or implied and there can be no assurance that estimated returns or projections will be realized or that actual returns will not be materially different than estimated herein. Accordingly you are cautioned not to place undue reliance on such forward-looking statements. All forward looking statements are based on information available to the Company as of the date hereof and the Company assumes no obligation to, and expressly disclaims any obligation to, update or revise any forward looking statements, for any reason.
Basis of Presentation of Financial Data
Unless noted otherwise in this presentation, all reported financial data is being presented as of the period ending June 30, 2012.
Non-GAAP Financial Measures
Information on any non-GAAP financial measures referenced in today’s presentation, including a reconciliation of those measures to GAAP measures, may also be found in our SEC filings and in the earnings release available on our web site.
2
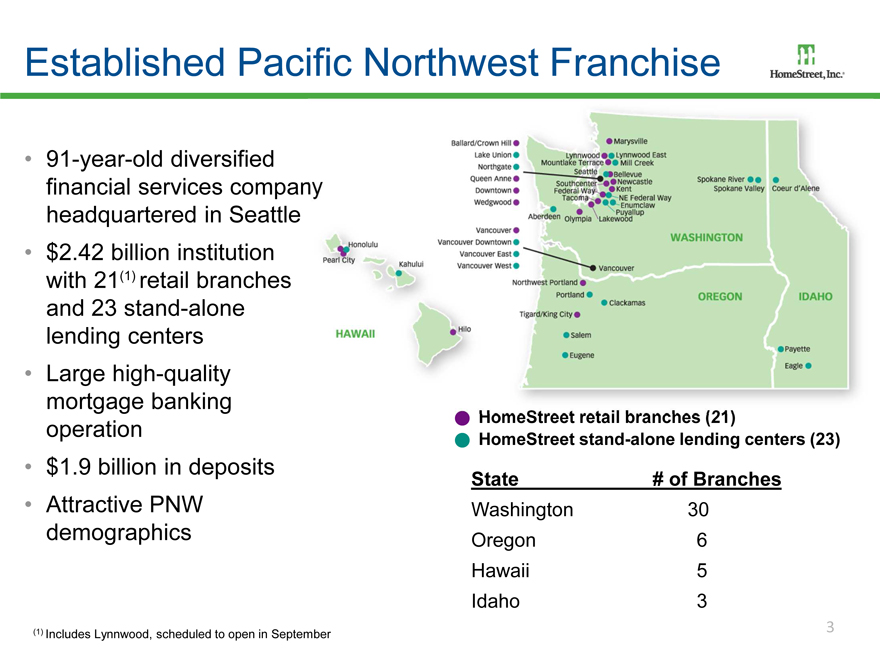
Established Pacific Northwest Franchise
91-year-old diversified financial services company headquartered in Seattle
$2.42 billion institution with 21(1) retail branches and 23 stand-alone lending centers
Large high-quality mortgage banking operation
$1.9 billion in deposits
Attractive PNW demographics
HomeStreet retail branches (21)
HomeStreet stand-alone lending centers (23)
State # of Branches
Washington 30
Oregon 6
Hawaii 5
Idaho 3
| 3 |
|
| (1) |
|
Includes Lynnwood, scheduled to open in September |
Diversified Lines of Business
Community Banking Single Family Mortgage Lending
Deposit products Originate and sell loans into secondary
Investment products market directly
Cash management services Originate and service portfolio loans
Consumer and business loans Includes home equity loans and lines
Insurance products
Income Property Lending Residential Construction Lending
Focus on multifamily Originate residential construction
One of 25 Fannie Mae DUS® lenders; portfolio loans
only one headquartered in PNW Primarily home building
Originate and service commercial Generally short duration
construction, bridge and permanent Limited land exposure
loans for portfolio and sale
| 4 |
|
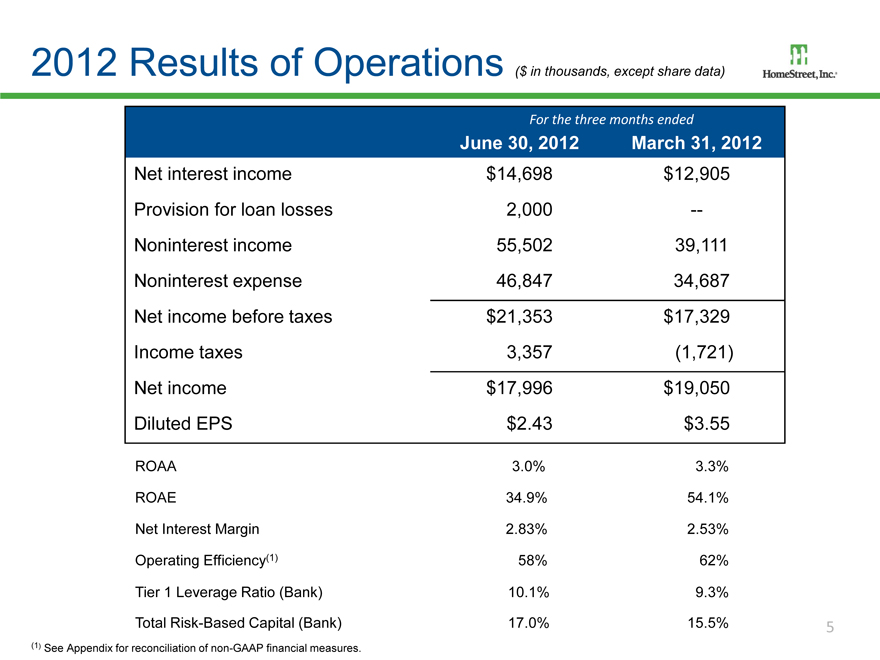
2012 Results of Operations ($ in thousands, except share data)
For the three months ended
June 30, 2012 March 31, 2012
Net interest income $14,698 $12,905
Provision for loan losses 2,000 —
Noninterest income 55,502 39,111
Noninterest expense 46,847 34,687
Net income before taxes $21,353 $17,329
Income taxes 3,357 (1,721)
Net income $17,996 $19,050
Diluted EPS $2.43 $3.55
ROAA 3.0% 3.3%
ROAE 34.9% 54.1%
Net Interest Margin 2.83% 2.53%
Operating Efficiency(1) 58% 62%
Tier 1 Leverage Ratio (Bank) 10.1% 9.3%
Total Risk-Based Capital (Bank) 17.0% 15.5%
| (1) |
|
See Appendix for reconciliation of non-GAAP financial measures. |
| 5 |
|
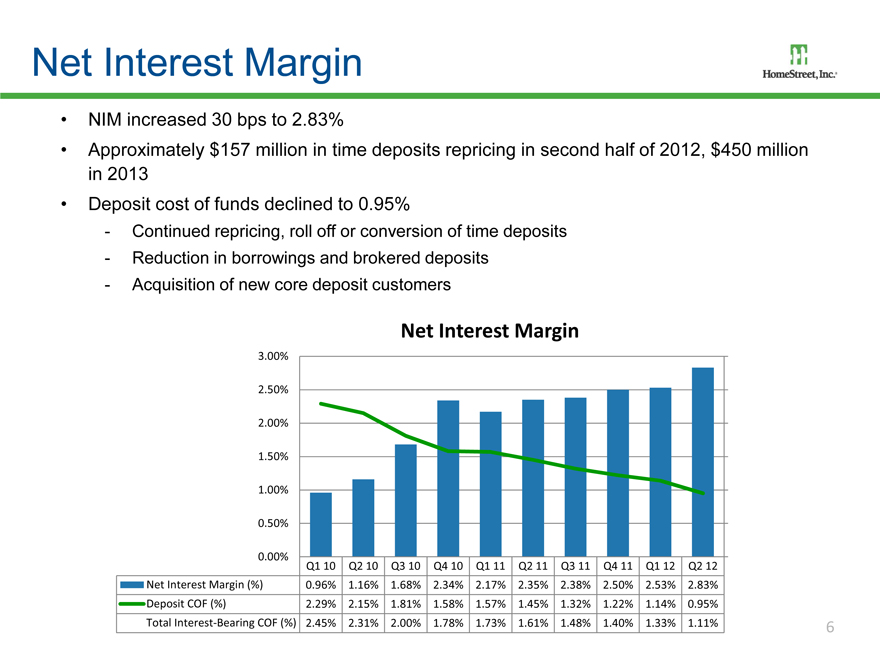
Net Interest Margin
NIM increased 30 bps to 2.83%
Approximately $157 million in time deposits repricing in second half of 2012, $450 million in 2013
Deposit cost of funds declined to 0.95%
- Continued repricing, roll off or conversion of time deposits
- Reduction in borrowings and brokered deposits
- Acquisition of new core deposit customers
Net Interest Margin
3.00%
2.50%
2.00%
1.50%
1.00%
0.50%
0.00%
Q1 10 Q2 10 Q3 10 Q4 10 Q1 11 Q2 11 Q3 11 Q4 11 Q1 12 Q2 12
Net Interest Margin (%) 0.96% 1.16% 1.68% 2.34% 2.17% 2.35% 2.38% 2.50% 2.53% 2.83%
Deposit COF (%) 2.29% 2.15% 1.81% 1.58% 1.57% 1.45% 1.32% 1.22% 1.14% 0.95%
Total Interest-Bearing COF (%) 2.45% 2.31% 2.00% 1.78% 1.73% 1.61% 1.48% 1.40% 1.33% 1.11%
| 6 |
|
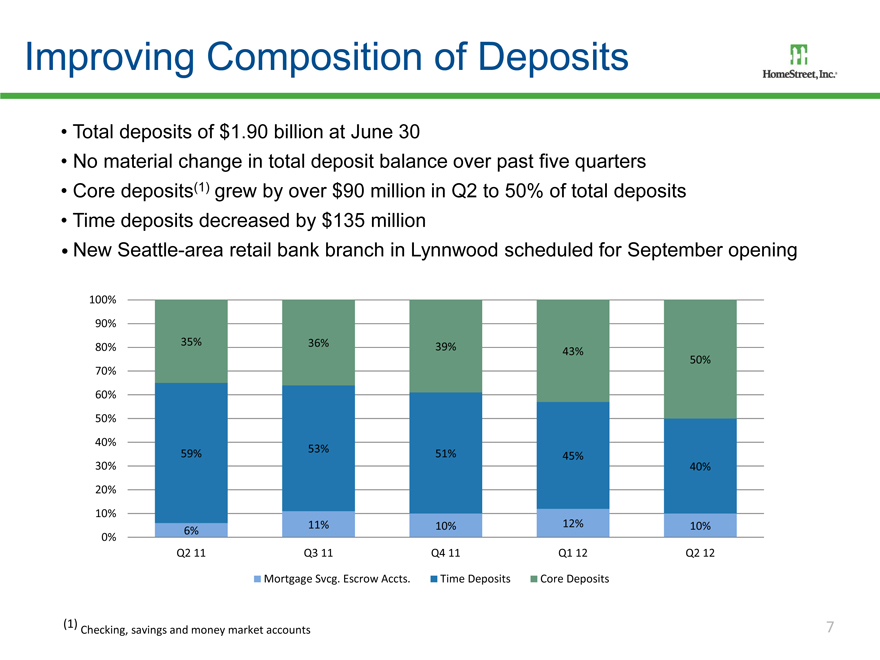
Improving Composition of Deposits
Total deposits of $1.90 billion at June 30
No material change in total deposit balance over past five quarters Core deposits(1) grew by over $90 million in Q2 to 50% of total deposits Time deposits decreased by $135 million
New Seattle-area retail bank branch in Lynnwood scheduled for September opening
100%
90%
80% 35% 36% 39%
43%
50%
70%
60%
50%
40% 53%
59% 51% 45%
30% 40%
20%
10%
6% 11% 10% 12% 10%
0%
Q2 11 Q3 11 Q4 11 Q1 12 Q2 12
Mortgage Svcg. Escrow Accts. Time Deposits Core Deposits
| (1) |
|
Checking, savings and money market accounts
| 7 |
|
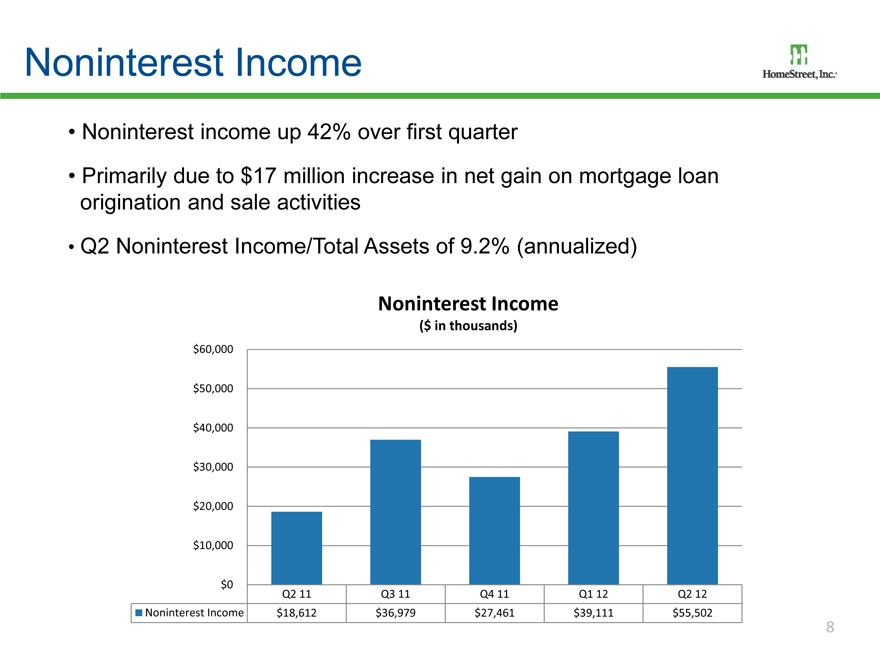
Noninterest Income
Noninterest income up 42% over first quarter
Primarily due to $17 million increase in net gain on mortgage loan origination and sale activities
Q2 Noninterest Income/Total Assets of 9.2% (annualized)
Noninterest Income
($ in thousands)
$60,000
$50,000
$40,000
$30,000
$20,000
$10,000
$0
Q2 11 Q3 11 Q4 11 Q1 12 Q2 12
Noninterest Income $18,612 $36,979 $27,461 $39,111 $55,502
| 8 |
|
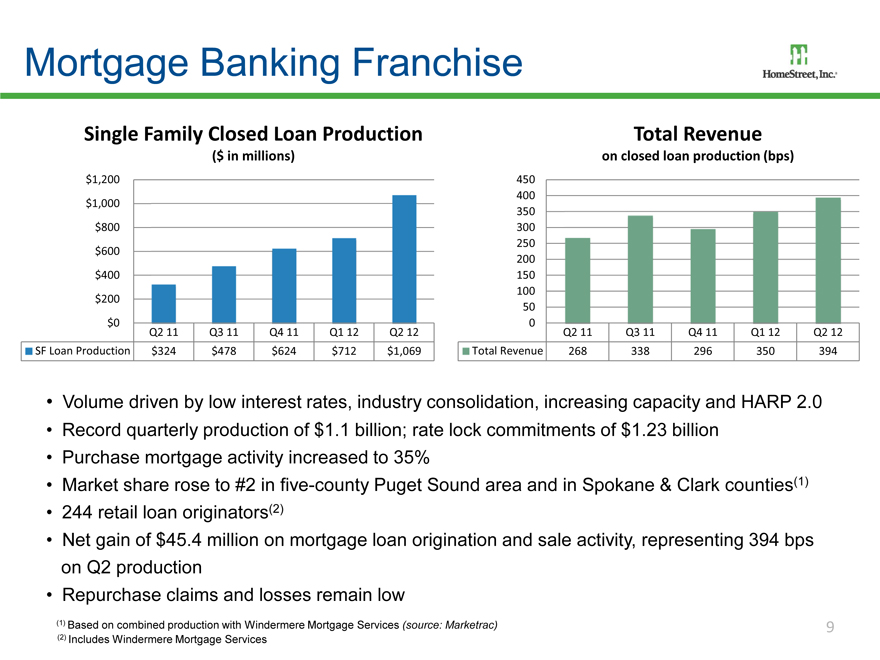
Mortgage Banking Franchise
Single Family Closed Loan Production
($ in millions)
$1,200
$1,000
$800
$600
$400
$200
$0
Q2 11 Q3 11 Q4 11 Q1 12 Q2 12
SF Loan Production $324 $478 $624 $712 $1,069
Total Revenue
on closed loan production (bps)
450
400
350
300
250
200
150
100
50
0
Q2 11 Q3 11 Q4 11 Q1 12 Q2 12
Total Revenue 268 338 296 350 394
Volume driven by low interest rates, industry consolidation, increasing capacity and HARP 2.0 Record quarterly production of $1.1 billion; rate lock commitments of $1.23 billion Purchase mortgage activity increased to 35% Market share rose to #2 in five-county Puget Sound area and in Spokane & Clark counties(1) 244 retail loan originators(2) Net gain of $45.4 million on mortgage loan origination and sale activity, representing 394 bps on Q2 production Repurchase claims and losses remain low
| (1) |
|
Based on combined production with Windermere Mortgage Services (source: Marketrac) |
| (2) |
|
Includes Windermere Mortgage Services |
9
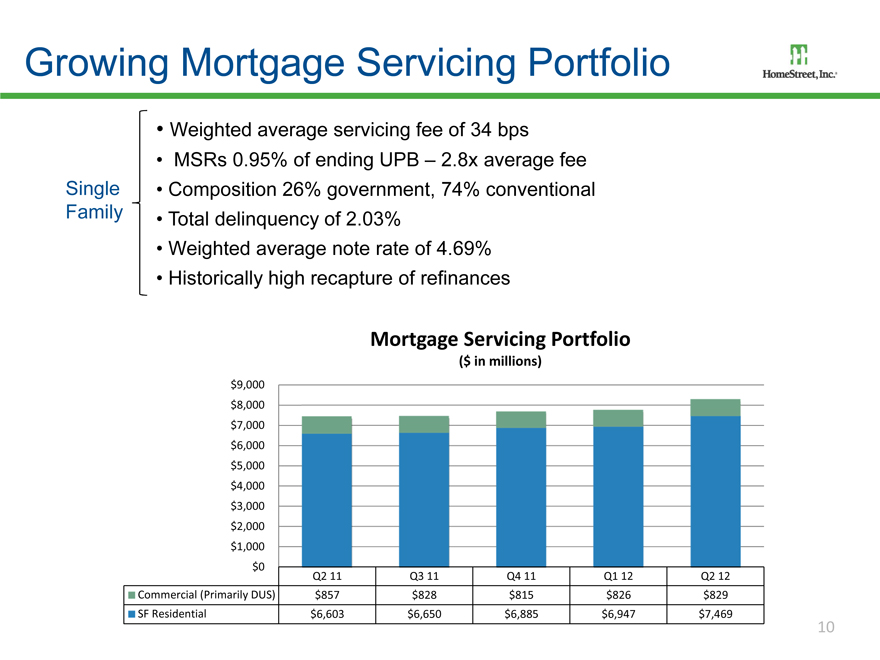
Growing Mortgage Servicing Portfolio
Weighted average servicing fee of 34 bps
MSRs 0.95% of ending UPB – 2.8x average fee Single Composition 26% government, 74% conventional Family
Total delinquency of 2.03%
Weighted average note rate of 4.69%
Historically high recapture of refinances
Mortgage Servicing Portfolio
($ in millions)
$9,000
$8,000
$7,000
$6,000
$5,000
$4,000
$3,000
$2,000
$1,000
$0
Q2 11 Q3 11 Q4 11 Q1 12 Q2 12
Commercial (Primarily DUS) $857 $828 $815 $826 $829
SF Residential $6,603 $6,650 $6,885 $6,947 $7,469
10
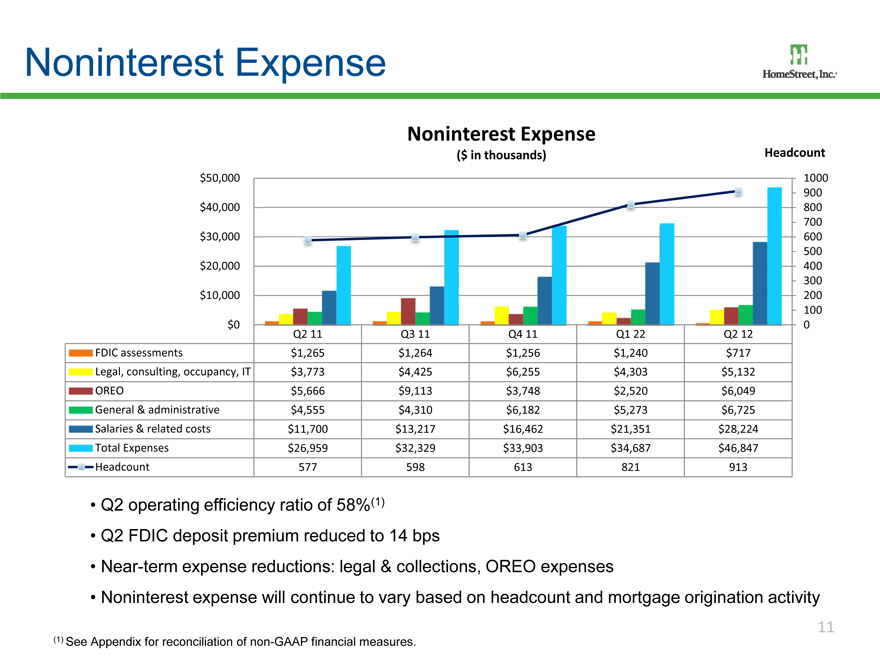
Noninterest Expense
Noninterest Expense
($ in thousands) Headcount
$50,000 1000
900
$40,000 800
700
$30,000 600
500
$20,000 400
300
$10,000 200
100
$0 0
Q2 11 Q3 11 Q4 11 Q1 22 Q2 12
FDIC assessments $1,265 $1,264 $1,256 $1,240 $717
Legal, consulting, occupancy, IT $3,773 $4,425 $6,255 $4,303 $5,132
OREO $5,666 $9,113 $3,748 $2,520 $6,049
General & administrative $4,555 $4,310 $6,182 $5,273 $6,725
Salaries & related costs $11,700 $13,217 $16,462 $21,351 $28,224
Total Expenses $26,959 $32,329 $33,903 $34,687 $46,847
Headcount 577 598 613 821 913
Q2 operating efficiency ratio of 58%(1)
Q2 FDIC deposit premium reduced to 14 bps
Near-term expense reductions: legal & collections, OREO expenses
Noninterest expense will continue to vary based on headcount and mortgage origination activity
| (1) |
|
See Appendix for reconciliation of non-GAAP financial measures. |
11
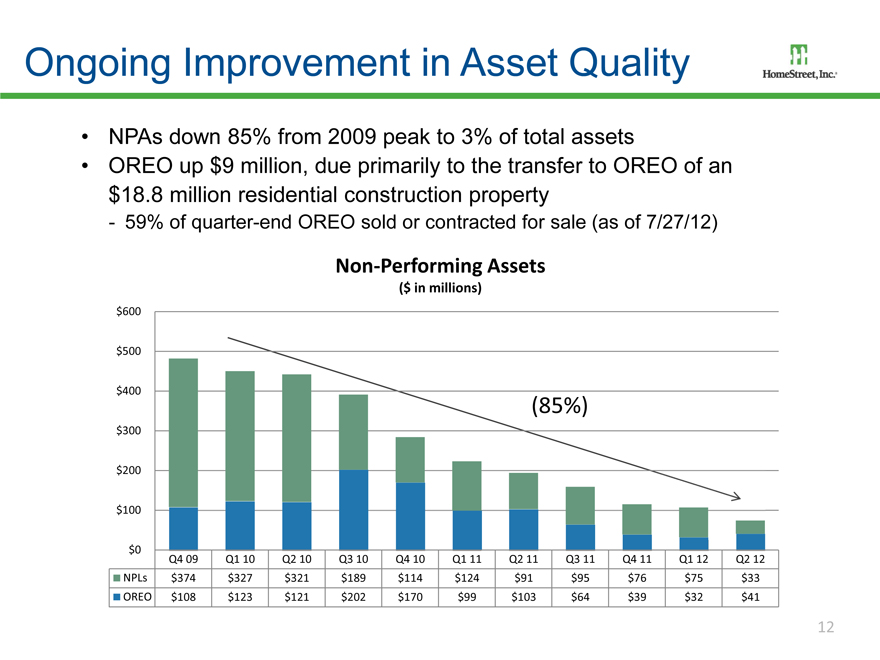
Ongoing Improvement in Asset Quality
NPAs down 85% from 2009 peak to 3% of total assets
OREO up $9 million, due primarily to the transfer to OREO of an $18.8 million residential construction property
- 59% of quarter-end OREO sold or contracted for sale (as of 7/27/12)
Non-Performing Assets
($ in millions)
$600
$500
$400
(85%)
$300
$200
$100
$0
Q4 09 Q1 10 Q2 10 Q3 10 Q4 10 Q1 11 Q2 11 Q3 11 Q4 11 Q1 12 Q2 12
NPLs $374 $327 $321 $189 $114 $124 $91 $95 $76 $75 $33
OREO $108 $123 $121 $202 $170 $99 $103 $64 $39 $32 $41
12

Loan Portfolio Characteristics
Restarting traditional lending lines – C&I, commercial real estate & construction lending
Loan Composition(1)
$ 1.27 billion
7%
14%
12%
21%
42% 4%
C&I/CRE Owner-Occupied CRE—Other
CRE—Multifamily Single Family
Consumer—HELOC Construction
CRE by Property Type(1)
$ 417 billion
6%
27%
21%
12%
16%
18%
Retail Indust./Warehouse
Mixed Use Multifamily
Office Other
| (1) |
|
As of June 30, 2012 |
13
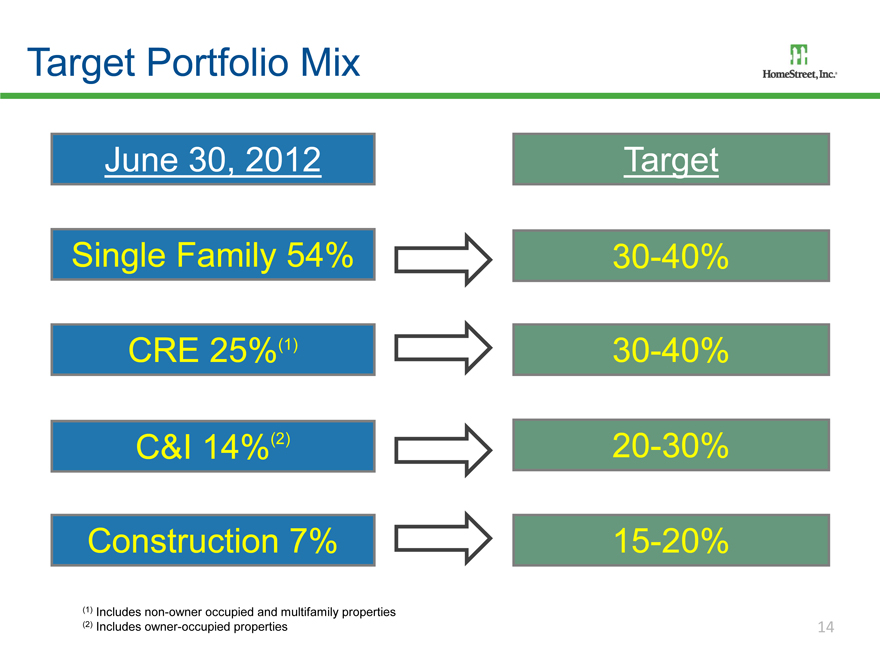
Target Portfolio Mix
June 30, 2012 Target
Single Family 54% 30-40%
CRE 25%(1) 30-40%
C&I 14%(2) 20-30%
Construction 7% 15-20%
| (1) |
|
Includes non-owner occupied and multifamily properties |
| (2) |
|
Includes owner-occupied properties |
14
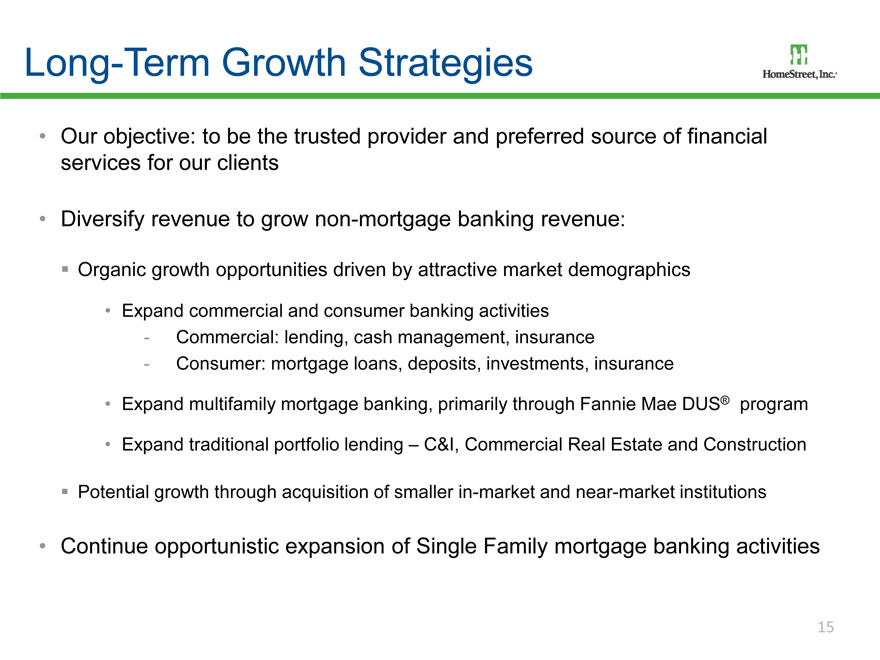
Long-Term Growth Strategies
Our objective: to be the trusted provider and preferred source of financial services for our clients
Diversify revenue to grow non-mortgage banking revenue:
??Organic growth opportunities driven by attractive market demographics
Expand commercial and consumer banking activities
- Commercial: lending, cash management, insurance
- Consumer: mortgage loans, deposits, investments, insurance
Expand multifamily mortgage banking, primarily through Fannie Mae DUS® program
Expand traditional portfolio lending – C&I, Commercial Real Estate and Construction
Potential growth through acquisition of smaller in-market and near-market institutions
Continue opportunistic expansion of Single Family mortgage banking activities
15
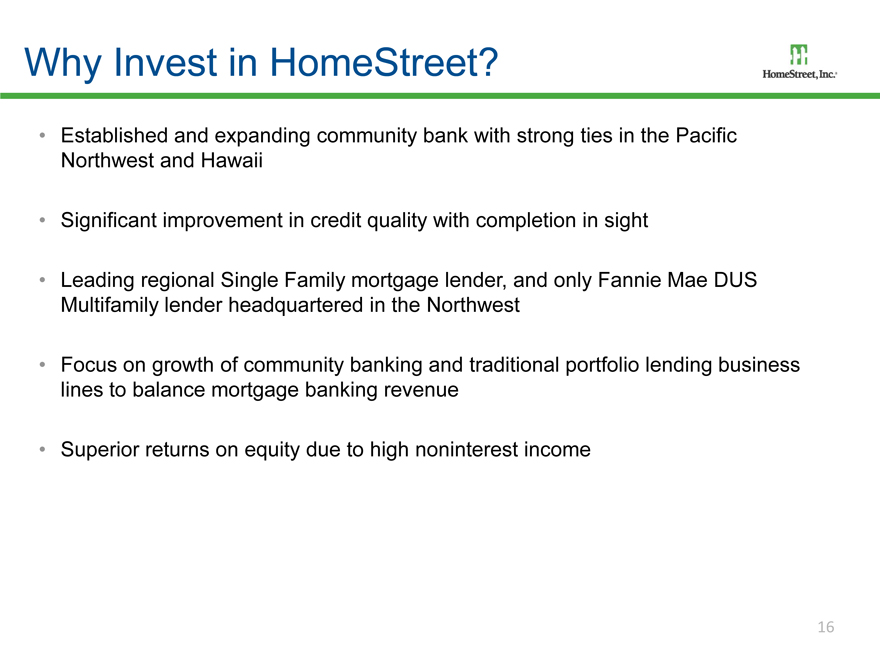
Why Invest in HomeStreet?
Established and expanding community bank with strong ties in the Pacific Northwest and Hawaii
Significant improvement in credit quality with completion in sight
Leading regional Single Family mortgage lender, and only Fannie Mae DUS Multifamily lender headquartered in the Northwest
Focus on growth of community banking and traditional portfolio lending business lines to balance mortgage banking revenue
Superior returns on equity due to high noninterest income
16
Appendix
17
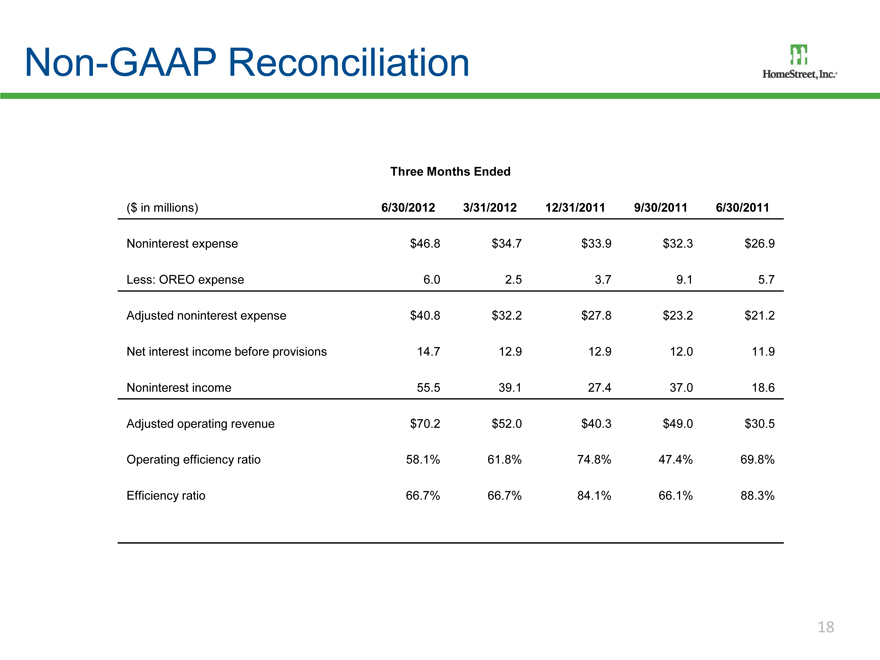
Non-GAAP Reconciliation
Three Months Ended
($ in millions) 6/30/2012 3/31/2012 12/31/2011 9/30/2011 6/30/2011
Noninterest expense $46.8 $34.7 $33.9 $32.3 $26.9
Less: OREO expense 6.0 2.5 3.7 9.1 5.7
Adjusted noninterest expense $40.8 $32.2 $27.8 $23.2 $21.2
Net interest income before provisions 14.7 12.9 12.9 12.0 11.9
Noninterest income 55.5 39.1 27.4 37.0 18.6
Adjusted operating revenue $70.2 $52.0 $40.3 $49.0 $30.5
Operating efficiency ratio 58.1% 61.8% 74.8% 47.4% 69.8%
Efficiency ratio 66.7% 66.7% 84.1% 66.1% 88.3%
18