Attached files
| file | filename |
|---|---|
| 8-K - FORM 8-K - TIAA FSB Holdings, Inc. | d395019d8k.htm |
 EverBank Financial Corp
Raymond James Bank Conference
August 14, 2012
Exhibit 99.1 |
 Disclaimer
THIS PRESENTATION HAS BEEN PREPARED BY EVERBANK FINANCIAL CORP ("EVERBANK"
OR THE “COMPANY”) SOLELY FOR INFORMATIONAL PURPOSES BASED ON ITS
OWN INFORMATION, AS WELL AS INFORMATION FROM PUBLIC SOURCES. THIS PRESENTATION HAS BEEN PREPARED
TO ASSIST INTERESTED PARTIES IN MAKING THEIR OWN EVALUATION OF EVERBANK AND DOES
NOT PURPORT TO CONTAIN ALL OF THE INFORMATION THAT MAY BE RELEVANT. IN
ALL CASES, INTERESTED PARTIES SHOULD CONDUCT THEIR OWN INVESTIGATION AND ANALYSIS OF
EVERBANK AND THE DATA SET FORTH IN THIS PRESENTATION AND OTHER INFORMATION PROVIDED
BY OR ON BEHALF OF EVERBANK. EXCEPT AS OTHERWISE INDICATED, THIS
PRESENTATION SPEAKS AS OF THE DATE HEREOF. THE DELIVERY OF THIS PRESENTATION SHALL NOT,
UNDER ANY CIRCUMSTANCES, CREATE ANY IMPLICATION THAT THERE HAS BEEN NO CHANGE IN
THE AFFAIRS OF THE COMPANY AFTER THE DATE HEREOF.
CERTAIN OF THE INFORMATION CONTAINED HEREIN MAY BE DERIVED FROM INFORMATION
PROVIDED BY INDUSTRY SOURCES. EVERBANK BELIEVES THAT SUCH INFORMATION
IS ACCURATE AND THAT THE SOURCES FROM WHICH IT HAS BEEN OBTAINED ARE RELIABLE. EVERBANK
CANNOT GUARANTEE THE ACCURACY OF SUCH INFORMATION, HOWEVER, AND HAS NOT
INDEPENDENTLY VERIFIED SUCH INFORMATION. THIS PRESENTATION MAY CONTAIN
CERTAIN FORWARD-LOOKING STATEMENTS AS DEFINED IN THE PRIVATE SECURITIES LITIGATION REFORM
ACT
OF
1995.
WORDS
SUCH
AS
“OUTLOOK,”
“BELIEVES,”
“EXPECTS,”
“POTENTIAL,”
“CONTINUES,”
“MAY,”
“WILL,”
“COULD,”
“SHOULD,”
“SEEKS,”
“APPROXIMATELY,”
“PREDICTS,”
“INTENDS,”
“PLANS,”
“ESTIMATES,”
“ANTICIPATES”
OR THE NEGATIVE VERSION OF THOSE WORDS OR OTHER
COMPARABLE WORDS ARE INTENDED TO IDENTIFY FORWARD-LOOKING STATEMENTS BUT ARE
NOT THE EXCLUSIVE MEANS OF IDENTIFYING SUCH STATEMENTS. THESE
FORWARD-LOOKING STATEMENTS ARE NOT HISTORICAL FACTS, AND ARE BASED ON CURRENT EXPECTATIONS,
ESTIMATES AND PROJECTIONS ABOUT THE COMPANY’S INDUSTRY, MANAGEMENT’S
BELIEFS AND CERTAIN ASSUMPTIONS MADE BY MANAGEMENT, MANY OF WHICH, BY THEIR
NATURE, ARE INHERENTLY UNCERTAIN AND BEYOND THE COMPANY’S CONTROL. ACCORDINGLY, YOU
ARE CAUTIONED THAT ANY SUCH FORWARD-LOOKING STATEMENTS ARE NOT GUARANTEES OF
FUTURE PERFORMANCE AND ARE SUBJECT TO CERTAIN RISKS, UNCERTAINTIES AND
ASSUMPTIONS THAT ARE DIFFICULT TO PREDICT. ALTHOUGH THE COMPANY BELIEVES THAT THE
EXPECTATIONS REFLECTED IN SUCH FORWARD-LOOKING STATEMENTS ARE REASONABLE AS OF
THE DATE MADE, EXPECTATIONS MAY PROVE TO HAVE BEEN MATERIALLY DIFFERENT FROM
THE RESULTS EXPRESSED OR IMPLIED BY SUCH FORWARD-LOOKING STATEMENTS. UNLESS
OTHERWISE REQUIRED BY LAW, EVERBANK ALSO DISCLAIMS ANY OBLIGATION TO UPDATE ITS
VIEW OF ANY SUCH RISKS OR UNCERTAINTIES OR TO ANNOUNCE PUBLICLY THE RESULT
OF ANY REVISIONS TO THE FORWARD-LOOKING STATEMENTS MADE IN THIS PRESENTATION. INTERESTED
PARTIES SHOULD NOT PLACE UNDUE RELIANCE ON ANY FORWARD-LOOKING STATEMENT AND
SHOULD CONSIDER THE UNCERTAINTIES AND RISKS DISCUSSED UNDER ITEM 1A.
“RISK FACTORS” OF EVERBANK’S QUARTERLY REPORT ON FORM
10-Q AND IN ANY OF EVERBANK’S SUBSEQUENT FILINGS WITH THE
SECURITIES AND EXCHANGE COMMISSION. 2 |
 Company Overview |
 EverBank Overview
Strong Returns
High Growth
Low Risk
Acquired in 1994
and headquartered
in Jacksonville, FL
$15.0bn in assets,
$10.8bn in deposits &
$1.2bn shareholders’
equity as of June 30,
2012
Initial public offering on
May 3, 2012
$1.4bn market
capitalization
(1)
Nationwide banking
franchise
Unique, diversified
business model
Robust asset
generation
capabilities
Scalable, low cost
deposit platform
Disciplined risk
management
Cohesive, long
tenured management
team
(1) Market capitalization as of 8.8.2012 close
4 |
 Pending Acquisition of GE Capital’s Business Property Lending
Acquired MetLife Bank’s warehouse finance business
Completion of Initial Public Offering
Acquired online
deposit franchise
2000
-
2003
Mortgage Lending
and Servicing
2004
-
2007
Expansion of
Deposit Strategy
2008
-
2012
Addition of Diversified
Asset Generation
Evolution and Growth
Adopted EverBank name
Acquired NetBank mortgage assets
Growth capital infusion
Acquired Tygris
FDIC-Assisted Acquisition of Bank of Florida
$ 16.9
Pro Forma for Pending
BPL Acquisition
5 |
 Best
of Both Online and Branch Banking Models Strong Asset Generation
Quality Deposit Mix
High Customer Retention
Geographic Diversity
Low
“Fully-Loaded”
Expenses
Ability to Quickly Scale
EverBank
Online Banks
Regional
Branch Banks
6 |
 7
EverBank’s Business Strategy
San Francisco Area
Los Angeles Area
Houston, TX
Denver, CO
Dallas, TX
Atlanta, GA
St Louis, MO
Direct Bank
Chicago, IL
Branch
Presence
Jacksonville, FL
Northern VA
-
Loan Production Office
-
Business Headquarters
-
Corporate Headquarters
Bethesda, MD
Deliver high value products and
services to self-directed customers
through a variety of channels
Target mass affluent and small business
segments
Key wealth markets nationwide
Continue integrating core product
offering
Deposits
Jumbo lending
Commercial finance
Commercial lending
Expand long-term into complimentary
product lines
Brokerage
Wealth management
Parsippany, NJ
ECF
EVER Deposits
EVER Lending
EVER Deposits & Lending
Strategic Plan
Deposits and Lending by County / Business Locations
7
Deposits
Residential
Lending
Commercial
Finance
Commercial
Lending
Brokerage
Services
Wealth
Management
Developed
In Development |
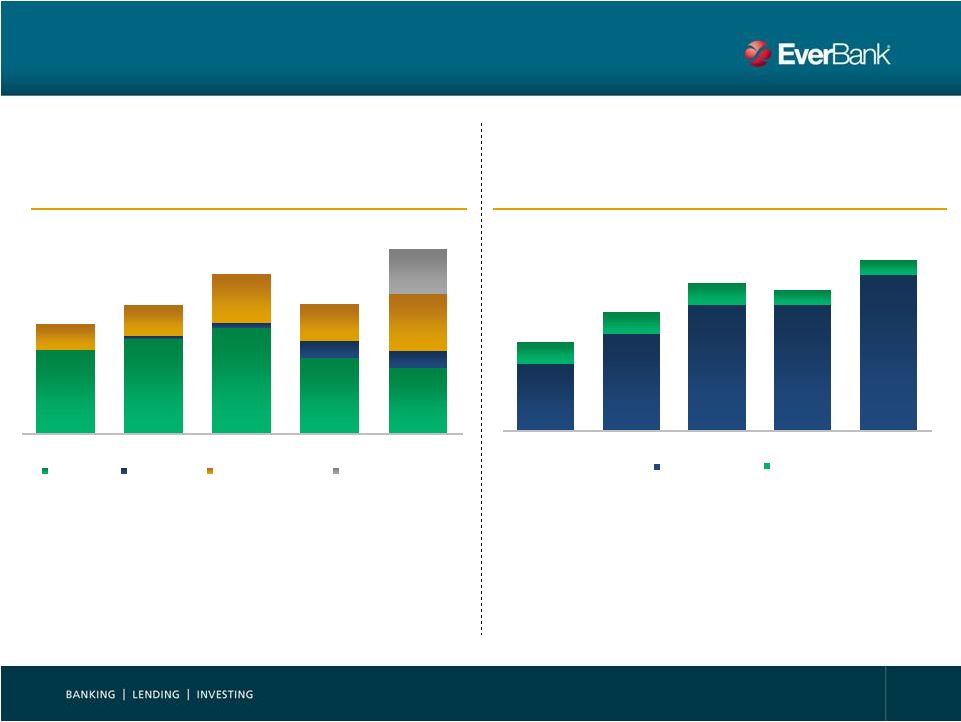 Diversified Asset Generation
Retained Asset Generation ($mm)
Mortgage Production Volume ($bn)
422
495
617
501
714
1.2
1.6
2.0
1.9
2.3
Secondary
Retained
8
76%
74%
66%
58%
35%
2%
3%
13%
9%
24%
24%
31%
29%
31%
25%
2Q11
3Q11
4Q11
1Q12
2Q12
Residential
Commercial
Commercial finance
Warehouse finance
0.9
1.3
1.7
1.7
2.1
0.3
0.3
0.3
0.2
0.2
2Q11
3Q11
4Q11
1Q12
2Q12 |
 9
Retained Asset Generation
(1)
Represents Q2 2012 annualized
(2)
Key transaction assumption
Pending BPL Acquisition Enhances Asset Generation
Diversifies and expands existing asset generation capabilities
$2.9bn
$0.5bn
$3.4bn
(2)
(1) |
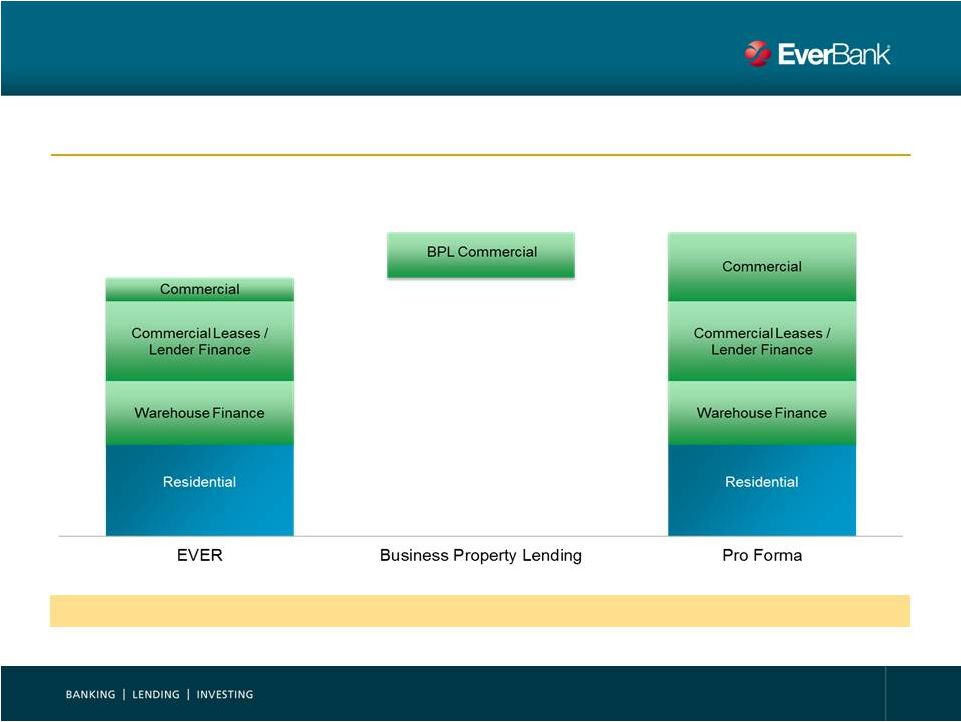
 10
Transaction increases commercial loan concentration from 23% to 37%
Residential
Commercial
Pending BPL Acquisition Diversifies Loan Portfolio
Pro Forma
EVER
Business Property Lending
Total: $10.9bn
Total: $2.4bn
Total: $13.3bn |
 11
Source: AlixPartners study
(1)
Percentage of U.S. households who used branch banking channel within the last
year Online and Mobile Banking Trends
Online
banking
channel
market
share
has
grown
to
43%
vs.
a
decline
to
62%
for
branch
banking
Bank Channel Usage as a % of U.S. Households
91%
19%
Branch Banking
(1)
Mobile Banking
0%
10%
20%
30%
40%
50%
60%
70%
80%
90%
100%
1995
1996
1997
1998
1999
2000
2001
2002
2003
2004
2005
2006
2007
2008
2009
2010
2011
11
Online Banking |
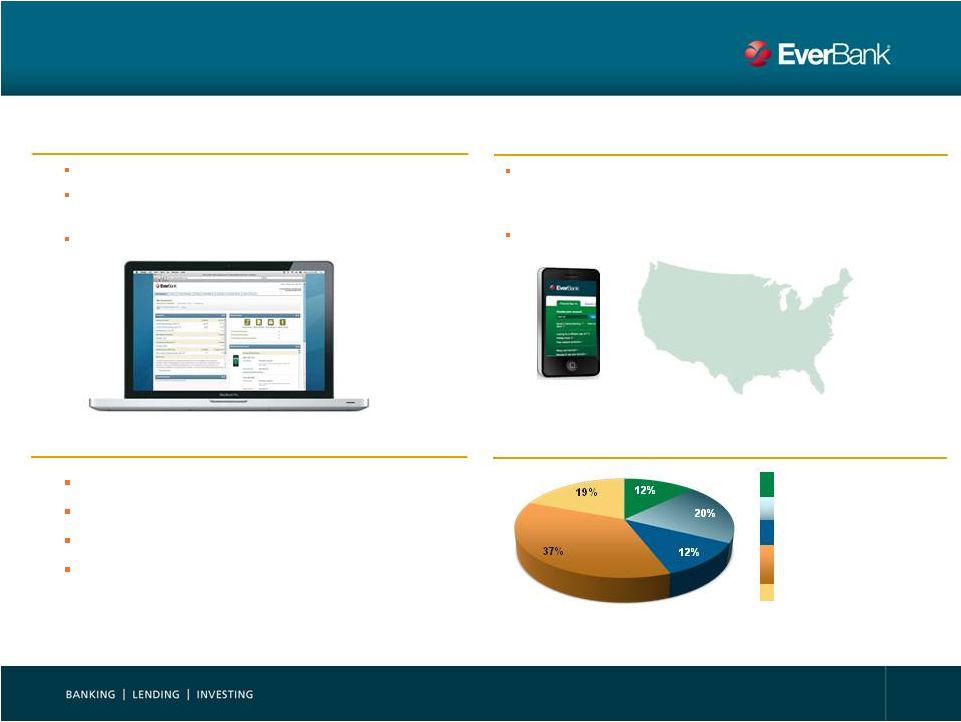 Value Proposition Yields
Attractive Customer Base Internal and external account aggregation
Analysis and reporting across financial life: investing,
spending, budgeting, tracking alerts
Bill pay and electronic transfers
Mobile, Online, 24 Hour Phone Support, No Fee ATM,
Imaging / Remote Deposit, Direct Deposit, Select
Financial Centers, Mail
ATM fee rebates
474,000 ATMs
Noninterest-bearing
Checking
MMDA & Savings
Global Market
Time Deposits
111,178 households, 222,763 accounts
Average deposits per household: $78,283
54% household income > $75,000
46%
household
net
worth
(1)
>
$250,000
(1)
Based on reported household net worth; excludes 17% of households that do not report household net
worth One Stop, Integrated Financial Portal
Convenient Access: 24 x 365
Attractive Nationwide Customer Base
2Q12 Deposit Composition
12 |
 (1)
Based
on
Bank
of
America’s
Deposit
Banking
segment
2011
average
Non-Interest
Expense
to
Average
Deposits;
NIE
reduced
by
15
bps
for
estimated
agency
fees
(2)
Non-interest expense from direct and retail banking operations, excluding agency fees and corporate
overhead allocation costs (3)
Calculated
as
annual
deposit
interest
expense
divided
by
average
balance
of
deposits;
includes
non-interest
bearing
deposits
(4)
Aggregate FDIC financial information
Low All-In Cost of Deposits
Deposit Interest Expense
(3)
Non-Interest Expense as a % of
Deposits
“All-in”
Cost of Deposits
13 |
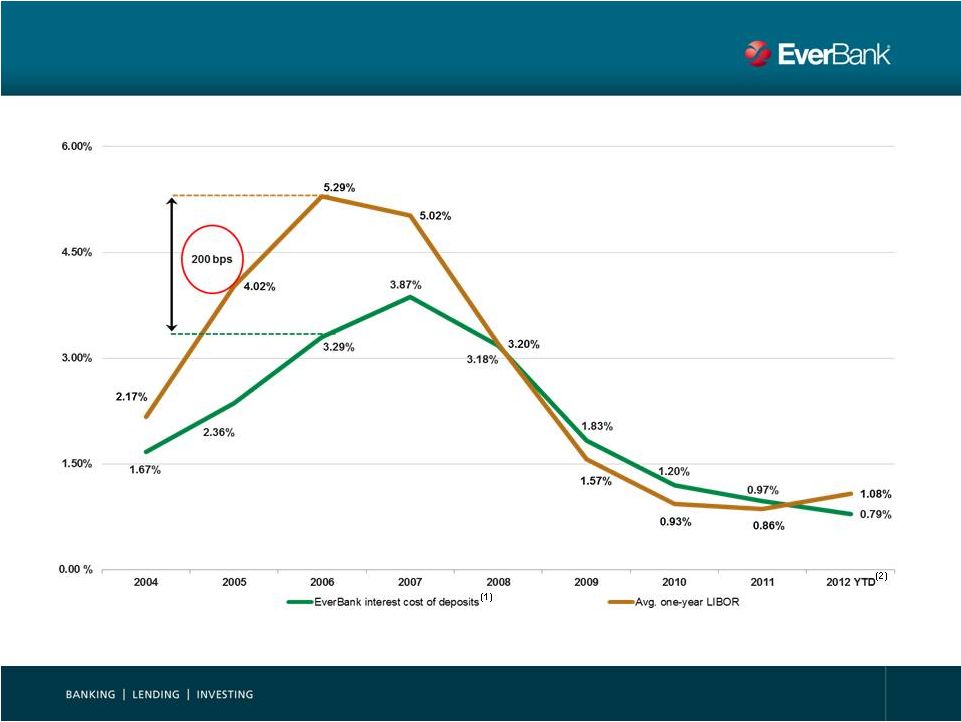 Deposit Pricing Lags in Rising Rate Environment
(1)
Calculated
as
annual
deposit
interest
expense
divided
by
average
balance
of
deposits;
includes
non-interest
bearing
deposits;
YTD
(2)
EverBank interest cost of deposits for year to date June 30, 2012; Average
one-year LIBOR represents the average of December 31, 2011, March, 31, 2012 and June 30, 2012
14 |
 15
Strong, Stable Deposit Base
(1)
Compound
annual
retention
rate
for
balances
of
non-CD
bank
accounts
existing
at
June
30,
2012,
calculated
from
initial
year
end
to
June
30,
2012
(2)
Average account balance for non-CD bank accounts existing at each point in time,
shown from initial year end to June 30, 2012 Compound
Annual
Retention
Rate
(1)
Average
Balance
of
Accounts
Existing
at
Each
Period
(2)
Vintage
High Customer Deposit Retention
Loyal Customers with Growing Balances
98%
97%
97%
96%
2004
2005
2006
2007
$10,000
$20,000
$30,000
$40,000
$50,000
2005
2006
2007
2008
2009
2010
2011
2012
YTD
2005
2006
2007
2008
2009
2010
2011
15 |
 16
History of Attractive Acquisitions
Business Property Lending
$2.4bn assets
$3.1bn servicing rights
Warehouse Finance
$351mm assets
$1.4bn assets
$1.2bn deposits
$780mm assets
$425mm growth capital
$340mm deposits
Size
(1)
Target
(1)
Net of any purchase accounting adjustments, figures are rounded
Disciplined approach has yielded attractive strategic and growth acquisitions |
 Pending Acquisition of Business Property Lending, Inc.
Business Acquired
Business Property Lending division from GE Capital
Provides loans on essential use properties owned or leased by small
and mid-sized companies
Includes commercial loan origination and servicing business
$2.44bn of high-quality top performing loans
Servicing rights on additional $3.1bn of securitized business loans
108 employees, including senior management team
Purchase Price
$2.51bn cash for the stock of a subsidiary of GE Capital, includes
$70.5mm premium and generates $40mm goodwill
Required Approvals
Regulatory and other customary approvals
Expected Closing Date
Fourth Quarter 2012
Attractive Deal
Economics
Immediately accretive to EPS
(low double digit %)
Accretive to ROE by ~100bps
Minimal impact on TBV
Low Risk
High quality loan portfolio
Turn-key platform
Strong pro forma capital and
liquidity
17
Strategic Value
Accelerates strategic growth plan
Diversifies balance sheet
Complements distribution in key
markets |
 Second Quarter 2012 Results |
 Adjusted
Earnings
Per
Share
(1)
Financial Highlights
(1)
Represents
adjusted
diluted
earnings
per
common
share
from
continuing
operations
for
2007-YTD;
2003-2006
represents
adjusted
basic
earnings
per
common
share
from
continuing
operations.
Calculated
using
adjusted
net
income
attributable
to
the
Company
from
continuing
operations;
2012
adjusted
EPS
calculation
includes
$4.5mm
and
$1.1mm
cash
dividends
paid
to
Series
A
and
Series
B
Preferred
shareholders in Q1 and Q2, respectively; a reconciliation of non-GAAP financial
measures can be found in the appendix (2)
Q2 YTD adjusted return on average equity for banks $5-25bn in assets represents
annualized Q1 metric; Q2 YTD metrics unavailable Adjusted
Return
on
Average
Equity
(2)
2Q12 Capital Ratios
Tangible Book Value Per Share
19 |
 20
Key
Highlights
–
2Q12
Note: A reconciliation of non-GAAP financial measures can be found in the
appendix Earnings
Execution of
Strategic Goals
$714mm retained organic asset generation
Total loans up $1.1bn, or 11%, LQ to $10.9bn
Deposits up $0.3bn, or 2%, LQ to $10.8bn
Core NIM up 1bp LQ to 3.53% (Reported NIM of 3.86%)
Closed acquisition of warehouse finance business from MetLife
Completed Initial Public Offering
Executed definitive agreements to acquire Business Property
Lending from GE Capital
Adjusted EPS of $0.33, up 18% linked quarter (LQ)
GAAP EPS of $0.09, up 13% LQ
Balance Sheet
and NIM Growth
Solid Capital
Ratios
Improving Credit
Quality
TCE / TA: 7.8%
Tier 1 leverage (bank): 8.3%
Total risk-based (bank): 15.8%
Adjusted non-performing assets were 1.46% of total assets, down 17bps
LQ
Net charge-offs were 0.34% of average loans held for investment, down
31bps LQ |
 Stock
Price Performance Note:
Peer
group
consists
of
AF,BOH,
BOKF,
CYN,
FHN,
FRC,
HBHC,
HCBK,
IBKC,
NYB,
SBNY
and
VLY
EVER Return Since IPO
80
85
90
95
100
105
110
115
120
125
5/2
5/9
5/16
5/23
5/30
6/6
6/13
6/20
6/27
7/4
7/11
7/18
7/25
8/1
8/8
EVER
Peer Avg
KRE
19.7%
(5.0)%
(2.3)%
21 |
 Why
Invest in EverBank High-performing,
strong-growth,
low-risk national
bank franchise
Robust asset
generation
capabilities coupled
with attractive, low-
cost deposit engine
Ability to achieve
earnings growth in a
variety of economic
cycles
Proven ability to
capitalize on market
opportunities
Scalable operating
platforms and
distribution channels
Management team
with long-term track
record of success
22 |
 Appendix |
 Loans
Strong Returns
High Growth
Low Risk
End of Period Loans ($mm)
End of period loans up $1.1bn, or 11%, LQ and
$3.3bn, or 44%, YoY
Residential loans up 5% LQ and 40% YoY
Commercial loans up 49% LQ and 63% YoY
Lease financing receivables up 12% LQ and 43% YoY
Loan growth driven by strong organic origination activity
in all asset classes and the closing of warehouse
finance acquisition
Loan yield on average loans HFI of 5.11% down 34
bps linked quarter
Decrease in excess accretion and addition of short-
term, variable rate warehouse finance loans
Loans HFI Composition ($mm)
6,767
6,198
6,442
7,245
7,708
Quarter Highlights
7,559
7,990
9,167
9,776
10,887
2Q11
3Q11
4Q11
1Q12
2Q12
Residential
Commercial
Commercial Finance
Warehouse Finance
2Q11
3Q11
4Q11
1Q12
2Q12
Loans HFI
Loans HFS
Average Loan HFI Yield
24 |
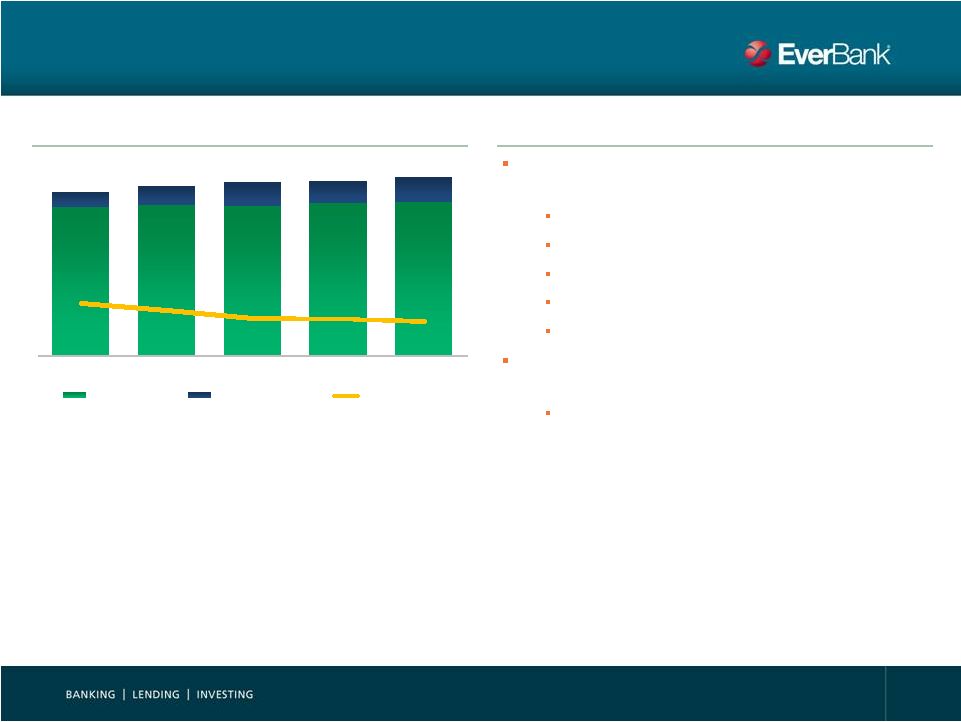 8,910
9,029
8,956
9,139
9,214
915
1,127
1,455
1,305
1,463
1.04%
0.94%
0.82%
0.81%
0.77%
2Q11
3Q11
4Q11
1Q12
2Q12
Interest-bearing
Noninterest-bearing
Cost of deposits
Deposits
Strong Returns
High Growth
Low Risk
Average Deposits and Rates ($mm)
Average deposits up $232.6mm, or 2%, LQ and
$850.9mm, or 9%, YoY
Noninterest-bearing deposits up 12% LQ and 60% YoY
Checking deposits up 1% LQ and 4% YoY
Global market deposits down 3% LQ and 4% YoY
MMDA & savings deposits up 2% LQ and 6% YoY
Time deposits down 1% LQ and up 1% YoY
Cost of deposits declined 4 bps linked quarter and
27 bps year over year to 0.77%
Over 70% of CD book will mature in the next 12 months
9,825
10,156
10,411
10,443
10,676
Quarter Highlights
Note: Cost of deposits shown above represents interest expense paid on deposits over
average total deposits 13%
25 |
 26
113
111
115
116
125
2Q11
3Q11
4Q11
1Q12
2Q12
4.22%
3.98%
3.94%
3.97%
3.86%
Net Interest Income
Net Interest Income ($mm)
Net interest income up $9.4mm, or 8%, LQ and
$12.1mm, or 11%, YoY
Average interest earning assets up 11% LQ and
22% YoY
Reported NIM declined 11 bps LQ and 36 bps YoY
to 3.86%
Core NIM rose 1 bp LQ to 3.53%
Core NIM
Quarter Highlights
Net Interest Income
Net Interest Margin
($mm)
4Q11
1Q12
2Q12
Average interest-earning assets
11,571
$
11,707
$
13,025
$
Net interest income
115
$
116
$
125
$
Reported NIM
3.94%
3.97%
3.86%
Net interest income
115
$
116
$
125
$
Less: Discount accretion from
Tygris acquisition
15
13
11
Adjusted net interest income
100
$
102
$
114
$
Core NIM
3.43%
3.52%
3.53% |
 27
Banking and Wealth Management
Net interest income up $8.3mm, or 8%, LQ and
$9.7mm, or 9%, YoY due to loan growth
Provision for loan and lease losses down $5.3mm,
or 51%, LQ and $3.2mm, or 39% YoY due to credit
quality improvement
Credit-related expenses increased due to elevated
foreclosure activity related to our GNMA pool buyout
loans
Segment Earnings
Segment Highlights
($mm)
2Q11
1Q12
2Q12
Net interest income
105
$
107
$
115
$
Provision for loan and lease losses
(8)
(10)
(5)
Net interest income after provision
97
96
110
Noninterest income
16
25
26
Noninterest expense:
Credit-related expenses
6
8
14
All other noninterest expense
40
52
62
Pre-tax income
66
$
62
$
60
$
Adjustment items (pre-tax)
3
3
1
Adjusted pre-tax income
69
$
65
$
61
$ |
 28
Mortgage Banking
Net interest income up $1.3mm, or 12%, LQ and
$2.3mm, or 24%, YoY
Noninterest income increased $11.3mm, or 30%,
YoY as a result of increased gain on sale activity
due to increased origination activity
Continued high volume of originations due to
historically low rates and HARP 2.0
Other credit-related expenses were down $7.8mm,
or 65%, LQ and $3.7mm, or 47%, YoY reflecting
positive credit trends
Segment Earnings
Segment Highlights
Key Metrics
($mm)
2Q11
1Q12
2Q12
Net interest income after provision
9
$
9
$
11
$
Noninterest income
37
48
49
Noninterest expense:
Foreclosure and OREO expense
4
3
3
Other credit-related expenses
8
12
4
All other noninterest expense
36
57
61
Pre-tax income (loss)
(2)
$
(15)
$
(8)
$
Adjustment items (pre-tax):
-
15
30
1
5
5
Adjusted pre-tax income (loss)
(1)
$
5
$
28
$
Increase in MSR valuation allowance
Transaction and non-recurring
regulatory related expense
2Q11
1Q12
2Q12
Mortgage lending volume
$1.2bn
$1.9bn
$2.3bn
Gain on sale margin
49bps
197bps
261bps
Servicing UPB
$56.9bn
$53.6bn
$53.3bn
Average servicing fee
31bps
31bps
30bps |
 29
Corporate Services
GAAP loss of $34.4mm, up $5.7mm, or 20%, LQ
Adjusted loss of $29.9mm, up $2.8mm, or 10%, LQ
Noninterest expense increased due to regulatory,
infrastructure investments and Business Property
Lending diligence expenses
Segment Earnings
Segment Highlights
($mm)
2Q11
1Q12
2Q12
Net interest income
(2)
$
(1)
$
(2)
$
Noninterest expense
28
27
33
Pre-tax income (loss)
(29)
$
(29)
$
(34)
$
Adjustment items (pre-tax):
2
2
4
Adjusted pre-tax income
(27)
$
(27)
$
(30)
$
Memo:
FTE
480
520
541
Total Assets
(1)
/ FTE
26.1
$
26.5
$
27.8
$
Transaction and non-recurring
regulatory related expense
(1)
Ratio represents total company assets per Corporate Services FTE
|
 Adjusted NPA / Total Assets
Note: A reconciliation of Non-GAAP financial measures can be found in the
appendix (1)
Tygris and Bank of Florida purchase-impaired loans and leases accounted for
under ASC 310-30 or by analogy Asset Quality
Adjusted NPA ratio
excludes loans and
leases with
enhanced credit
protection
(1)
Adjusted NPA / Total Assets Build
Highlights
NCO / Average Loans HFI
Adjusted non-performing assets to total assets
declined 17 bps LQ resulting from a $4.9mm, or
2.9%, decrease in non-performing loans
Net charge-offs to average loans HFI decreased 31
bps LQ to 0.34%
Allowance for loan and lease losses decreased
$0.9mm, or 1.1%, LQ as charge-offs of $6.6mm
exceeded provisions of $5.8mm
1.35%
1.46%
1.02%
0.65%
0.34%
2.73%
2.11%
1.86%
1.63%
1.46%
13.49%
(10.96)%
Regulatory NPAs /
Assets
Impact Ex. Govt
Insured Loans
Adjusted NPAs /
Assets
2009
2010
2011
1Q12
2Q12
2009
2010
2011
1Q12
2Q12
Impact Ex. Tygris
and Bank of
Florida
1.46%
(1.07)%
30 |
 31
Mortgage Banking Drivers
Revenue vs. Amortization and Valuation
Allowance ($mm)
Summary
Current low interest rate environment generates
positive long-term net economic value for our
mortgage business
June 30, 2012 mortgage servicing rights carrying
value reflects the significant decline in mortgage
rates at the end of the second quarter and the
success of the government’s HARP initiatives
An increase in expected refinance activity will
generate residential lending revenues over time,
while the non-cash MSR valuation allowance is
recorded immediately; we believe the residential
lending revenues will more than offset the increase
in prepayments
Amortization rate of 27% closely approximates the
actual payoff activity in the underlying portfolio of
approximately 24%
Valuation allowance is recoverable if rates rise and
refinance activity slows
Servicing fee income
Loan production and gain on sale income
Amortization
Addition to MSR valuation allowance
(23)
(28)
(29)
(34)
(21)
(19)
(15)
(30)
48
45
46
42
27
41
56
80
3Q11
4Q11
1Q12
2Q12 |
 32
'04 - '05
'06 - '08
'09 - '12
Total
$2,357
$450
$18,241
$21,048
8,977
11,528
3,134
23,639
$11,334
$11,978
$21,374
$44,686
0.34%
1.89%
0.32%
0.77%
0.05%
0.57%
0.18%
0.26%
41%
40%
27%
37%
15%
21%
25%
23%
9%
45%
22%
35%
25%
50%
31%
44%
Life Time
Last 12 Months
Life Time
Last 12 Months
Loss Severity
Last 12 Months
Repurchase Rates
Request Rates
Life Time
Sold UPB ($mm)
Agency
Agency Aggregator
Total Sold UPB
Credit –
Originated Mortgage Repurchase Reserve
Reserve Trends
Summary Statistics by Vintage
Coverage ratio of 3.25 years
LTD realized losses of only 8bps for the whole portfolio and
expected total life-time realized losses of just 16bps
2006
–
2008
quality
of
production
was
strong
2006
–
2008
vintages
were
primarily
sold
to
the
large
agency
aggregators
Highlights
Reserve Rollforward
($mm)
2Q11
3Q11
4Q11
1Q12
2Q12
Pending Reserves -
BoP
$ 32.0
$ 33.2
$ 33.0
$ 32.0
$ 35.0
Provisions -
New Sales
0.5
0.0
0.1
0.4
0.3
Provisions -
Changes in
Existing Reserves
4.9
2.6
1.2
5.8
1.1
Charge Offs
(4.2)
(2.8)
(2.3)
(3.2)
(2.4)
Pending Reserves -
EoP
$ 33.2
$ 33.0
$ 32.0
$ 35.0
$ 34.0
10
11
13
Quarters of Coverage at
Trailing 4 Quarter Realized Loss Rate
Losses to date ($mm)
'04 -
'05
'06 -
'08
'09 -
'12
Total
Total Sold UPB
$11,334
$11,978
$21,374
$44,686
Total Sold Units
51,108
57,421
95,297
203,826
Request Rate
0.34%
1.89%
0.32%
0.77%
Requests Received
173
1,087
309
1,569
Pending Requests
20
251
38
312
Resolved Requests
153
836
271
1,257
Repurchase Rate
41%
40%
27%
37%
Repurchases
63
334
73
469
Average Loan size
221,770
208,597
224,293
219,238
Loss Severity
9%
45%
22%
35%
Losses Recognized
$1.2
$31.5
$3.7
$36.4
Losses Recognized (bps)
1.1
26.3
1.7
8.1 |
 33
Annual
Targets
ROE
Net
Income
/
EPS
Growth
(2)
Dividend Payout Ratio
TCE/TA
Total Risk-Based Capital
Ratio
Asset Growth
Intermediate Financial Targets
3-Year Average
Historical Annual
Performance
(1)
Represents CAGR from 2008-2011
(2)
EPS on a diluted basis
(3)
Adjusted earnings and return metrics for continuing operations; a reconciliation of
non-GAAP financial measures can be found in the appendix 9% -
12%
23%
(1)
9% -
12%
66% / 39%
(1)(3)
10% -
13%
12%
(3)
~15%
N/A
7.0% -
7.5%
7.1%
12% -
14%
15.3% |
 Non-GAAP Reconciliations
Adjusted Net Income
(1)
No material items gave rise to adjustments prior to the year ended December 31,
2010. Accordingly, for periods presented before the year ended December 31, 2010, we have not reflected
adjustments to net income attributable to the Company from continuing operations
calculated in accordance with GAAP 2Q 2012
2011
2010
2009
2008
2007
2006
2005
2004
2003
GAAP net income from continuing operations
23.0
$
52.7
$
188.9
$
53.5
$
23.4
$
29.7
$
32.6
$
28.2
$
23.7
$
19.0
$
Bargain purchase gain on Tygris transaction
-
-
(68.1)
-
-
-
-
-
-
-
Gain on sale of investment securities due to portfolio repositioning
-
-
(12.3)
-
-
-
-
-
-
-
Gain on repurchase of trust preferred securities
-
(2.9)
(3.6)
-
-
-
-
-
-
-
Transaction and non-recurring regulatory related expense
10.0
16.8
6.0
-
-
-
-
-
-
-
Loss on early extinguishment of acquired debt
-
-
6.4
-
-
-
-
-
-
-
Decrease in fair value of Tygris indemnification asset
-
5.4
13.7
-
-
-
-
-
-
-
Increase in Bank of Florida non-accretable discount
2.6
3.0
3.8
-
-
-
-
-
-
-
Impact of change in ALLL methodology
-
1.2
-
-
-
-
-
-
-
-
Early adoption of TDR guidance and policy change
-
6.2
-
-
-
-
-
-
-
-
MSR impairment
28.1
24.5
-
-
-
-
-
-
-
-
Tax benefit (expense) related to revaluation of Tygris NUBILs
-
0.7
(7.8)
-
-
-
-
-
-
-
Adjusted net income from continuing operations
63.7
$
107.6
$
127.0
$
53.5
$
23.4
$
29.7
$
32.6
$
28.2
$
23.7
$
19.0
$
Three Months Ended
June 30,
March 31,
December 31,
September 30,
June 30,
(dollars in thousands)
2012
2012
2011
2011
2011
Net income
11,172
$
11,846
$
13,760
$
7,758
$
21,795
$
Transaction and non-recurring regulatory related expense, net of tax
6,143
3,884
4,331
4,751
2,136
Increase in Bank of Florida non-accretable discount, net of tax
463
2,135
2,208
298
-
Early adoption of TDR guidance and policy change, net of tax
-
-
-
-
1,561
MSR impairment, net of tax
18,684
9,389
11,638
12,824
-
Adjusted net income
36,462
$
27,254
$
31,937
$
25,631
$
25,492
$
34 |
 Non-GAAP Reconciliations
Non-performing Assets (NPA)
June 30,
March 31,
December 31,
December 31,
December 31,
(dollars in thousands)
2012
2012
2011
2010
2009
Total non-accrual loans and leases
168,962
$
170,589
$
193,478
$
213,818
$
194,951
$
Accruing loans 90 days or more past due
1,800
5,119
6,673
1,754
1,362
Total non-performing loans (NPL)
170,762
175,708
200,151
215,592
196,313
Other real estate owned (OREO)
49,248
49,304
42,664
37,450
24,087
Total non-performing assets (NPA)
220,010
225,012
242,815
253,042
220,400
Troubled debt restructurings (TDR) less than 90 days past due
93,184
92,954
92,628
70,173
95,482
Total NPA and TDR
(1)
313,194
$
317,966
$
335,443
$
323,215
$
315,882
$
Total NPA and TDR
313,194
$
317,966
$
335,443
$
323,215
$
315,882
$
Government-insured 90 days or more past due still accruing
1,647,567
1,530,665
1,570,787
553,341
589,842
Bank of Florida loans accounted for under ASC 310-30:
90 days or more past due
140,797
146,379
149,743
195,425
-
OREO
20,379
22,852
19,456
19,166
-
Total regulatory NPA and TDR
2,121,937
$
2,017,862
$
2,075,429
$
1,091,147
$
905,724
$
Adjusted credit quality ratios excluding government-insured loans
and loans accounted for under ASC 310-30:
(1)
NPA to total assets
1.46%
1.63%
1.86%
2.11%
2.73%
Credit quality ratios including government-insured loans and loans
accounted for under ASC 310-30:
NPA to total assets
13.49%
13.97%
15.20%
8.50%
10.05%
(1)
We define non-performing assets, or NPA, as non-accrual loans, accruing
loans past due 90 days or more and foreclosed property. Our NPA calculation excludes government-
insured pool buyout loans for which payment is insured by the government. We
also exclude loans and foreclosed property acquired in the Bank of Florida acquisition accounted
for
under
ASC
310-30
because
as
of
June
30,
2012,
we
expected
to
fully
collect
the
carrying
value
of
such
loans
and
foreclosed
property.
35 |
  36
June 30,
(dollars in thousands)
2012
Shareholders' equity
1,181,369
$
Less:
Goodwill
10,238
Intangible assets
6,700
Tangible common equity
1,164,431
$
Less:
Accumulated other comprehensive loss
(113,094)
Adjusted tangible common equity
1,277,525
$
Total assets
15,040,824
$
Less:
Goodwill
10,238
Intangible assets
6,700
Tangible assets
15,023,886
$
June 30,
March 31,
June 30,
(dollars in thousands)
2012
2012
2011
Shareholders' equity
1,263,687
$
1,099,404
$
1,130,104
$
Less:
Goodwill and other intangibles
(16,938)
(17,290)
(18,319)
Disallowed servicing asset
(36,650)
(40,783)
(31,927)
Disallowed deferred tax asset
(70,357)
(71,302)
(74,522)
Add:
Accumulated losses on securities and cash flow hedges
110,101
86,981
25,051
Tier 1 capital
1,249,843
1,057,010
1,030,387
Less:
Low-level recourse and residual interests
-
(20,424)
(19,079)
Add:
Allowance for loan and lease losses
77,393
78,254
80,419
Total regulatory capital
1,327,236
$
1,114,840
$
1,091,727
$
Adjusted total assets
15,022,729
$
13,731,482
$
12,438,222
$
Risk-weighted assets
8,424,290
7,311,556
6,648,103
Non-GAAP Reconciliations
Regulatory Capital (bank level)
Tangible Common Equity and Tangible Assets |
 Non-GAAP Reconciliations
Tangible Common Equity
2Q 2012
2011
2010
2009
2008
2007
2006
2005
2004
2003
GAAP shareholders equity
1,181
$
968
$
1,013
$
554
$
411
$
239
$
213
$
185
$
165
$
144
$
Less: Goodwill
10
10
10
0
0
2
0
0
0
0
Less: Other intangible assets
7
7
9
-
1
2
3
4
6
7
Tangible common equity
1,164
$
950
$
994
$
554
$
410
$
235
$
209
$
180
$
159
$
137
$
37 |