Attached files
| file | filename |
|---|---|
| 8-K - FORM 8-K - RAYMOND JAMES FINANCIAL INC | d393514d8k.htm |
 August 9, 2012
1
Exhibit 99.1 |
 FORWARD LOOKING STATEMENTS
2
This presentation may contain forward-looking statements within the meaning of the
Private Securities Litigation Reform Act of
1995. Such statements are based upon the current beliefs and expectations of
Raymond James’ management and are subject to significant risks and uncertainties.
Actual results may differ from those set forth
in the forward-looking statements. Factors that could cause Raymond James’
actual results to differ materially from those described in the forward-looking
statements can be found in Raymond James’ Annual Report on Form 10-K
for the year ended September 30, 2011, and the Quarterly Reports on
Form 10-Q for the quarters ended December 31, 2011, March 31, 2012, and June 30, 2012
each of which has been filed with the Securities and Exchange Commission and are available
on the Raymond James website (www.raymondjames.com) and on the Securities and Exchange Commission’s
website (www.sec.gov). Raymond James does not undertake to
update the forward-looking statements to reflect the impact of circumstances or
events that may arise after the date of the forward-looking statements. |
 PAUL
REILLY CEO, Raymond James Financial
3 |
 RAYMOND JAMES CORE VALUES
4
INTEGRITY
INDEPENDENCE
CONSERVATISM
CLIENT
FIRST |
 RAYMOND JAMES CORE VALUES
5 |
 CONTINUED PROFITABILITY
6
Trailing 10 Years
98
Consecutive Profitable Quarters |
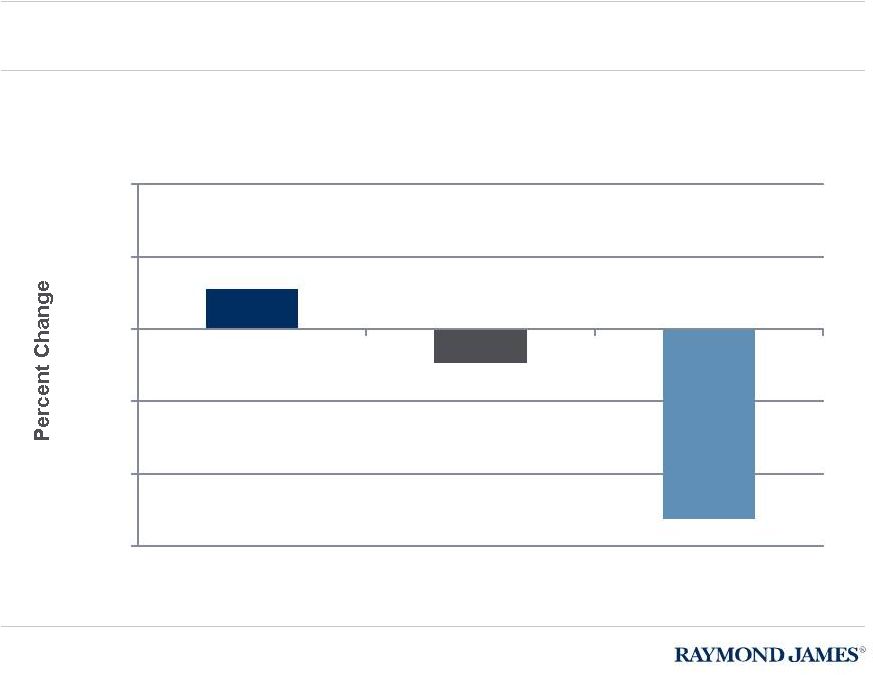 RAYMOND JAMES FINANCIAL
7
RJF Stock Price vs. Sector, Five-Year Change
11%
-9%
-52%
-60%
-40%
-20%
0%
20%
40%
RJF
S&P 500
DJ US Financials Index
Five Years Ended June 30, 2012 |
 RAYMOND JAMES FINANCIAL
Core Business Total Revenue, Nine Months Ended
8
Other
$37 mil
1%
Other
$36 mil
1%
Private
Client
Group
$1.8 bil
64%
Capital
Markets
$559 mil
20%
Asset
Mgmt.
176 mil
%
RJ Bank
$251 mil
9%
$
6
June 30, 2012
$2,804,432,000
Private
Client
Group
$1
6 bil
%
Capital
Markets
$513 mil
20%
Asset
Mgmt
169 mil
%
RJ Bank
$214 mil
%
June 30, 2011
$2,565,289,000
.
64
$
7
8 |
 RAYMOND JAMES FINANCIAL
Core Business Pre-Tax Income, Nine Months Ended
9
Other
($72 mil)
Other
($92 mil)
Private
Client
Group
155 mil
38%
Capital
Markets
$73 mil
18%
Asset
Mgmt.
$48 mil
12%
RJ Bank
131 mil
32%
June 30
, 2011
335,
418,000
$
$
$
Private
Client
Group
160
36
Capital
Markets
$60 mil
14%
Asset
Mgmt.
$49
11%
RJ Bank
$170 mil
39%
June 30, 2012
$347,218,000
$
mil
%
*Pie charts indicate contribution of each of Raymond James’ four core business units as it
relates to the other core business units. Percentages do not reflect contribution to Total
Pre-Tax Income and dollar amounts do not add to Total Pre-Tax Income due to
“Other” category (-$92 mil for 2012 and -$72 for 2011). Other includes Emerging
Markets, Securities Lending Proprietary Capital and miscellaneous other income/expense.
|
 RAYMOND JAMES FINANCIAL
10
Core Business Total Revenue, Three Months Ended
Other
3%
Other
0%
Private
Client
Group
$685 mil
61%
Capital
Markets
$257 mil
23%
Asset
Mgmt.
$61 mil
5%
RJ Bank
$90 mil
8%
June 30, 2012
$1,115,762,000
Private
Client
Group
$568 mil
65%
Capital
Markets
$165 mil
19%
Asset
Mgmt.
$58 mil
7%
RJ Bank
$83 mil
9%
March 31, 2012
$889,853,000 |
 RAYMOND JAMES FINANCIAL
11
Core Business Pre-Tax Income, Three Months Ended
Other
($31 mil)
Private
Client
Group
$64 mil
38%
Capital
Markets
$28 mil
17%
Asset
Mgmt.
RJ Bank
$60 mil
35%
June 30,
2012
124,
870,
000
$17 mil
10%
$
Other
($44 mil)
Private
Client
Group
46 mil
32%
Capital
Markets
$22 mil
16%
Asset
Mgmt.
17 mil
12%
RJ Bank
$57 mil
40%
March 31, 2012
$111,497,000
$
$
*Pie charts indicate contribution of each of Raymond James’ four core business units as it
relates to the other core business units. Percentages do not reflect contribution to Total
Pre-Tax Income and dollar amounts do not add to Total Pre-Tax Income due to
“Other” category (-$44 mil for 2012 and -$31 for 2011). Other includes Emerging
Markets, Securities Lending Proprietary Capital and miscellaneous other income/expense.
|
 CHANGING COMPETITIVE LANDSCAPE
FIRST UNION-WACHOVIA CORP
STRONG FINANCIAL CORP
MARQUETTE FINANCIAL GROUP INC
RAGEN MACKENZIE GROUP INC.
H.D. VEST
PRUDENTIAL SECURITIES INC.
GOLDEN WEST FINANCIAL CORP.
A.G. EDWARDS INC.
INTERSTATE/JOHNSON LANE INC.
EVERGREEN
BANK OF AMERICA
MERRILL LYNCH
THE ADVEST GROUP INC.
HERZOG HEINE GEDULD INC.
MIDLAND WALWYN INC.
MERRILL LYNCH & CO.
FLEETBOSTON FINANCIAL CORP.
COUNTRYWIDE FINANCIAL CORP.
U.S. TRUST CORP.
JP MORGAN & CHASE
J.P. MORGAN & CO. INC.
HAMBRECHT & QUIST GROUP
THE BEACON GROUP LLC
BANK ONE CORP.
THE BEAR STEARNS COS. INC.
FIRST CHICAGO NBD CORP.
UBS
PAINEWEBBER GROUP INC.
PIPER JAFFRAY COS. INC. PRIVATE
CLIENT BRANCH NETWORK
J.C. BRADFORD & CO.
EDWARD JONES
AMERIPRISE
LPL
STIFEL
COMMONWEALTH
FIDELITY
TD AMERITRADE
LINCOLN FINANCIAL
RW BAIRD
CITIGROUP
PIPER JAFFRAY
COWEN
BMO
RBC
JEFFERIES
GOLDMAN SACHS
HARRIS WILLIAMS
MOELIS
VINING SPARKS
KBW
LAZARD
CHARLES SCHWAB
BANK OF AMERICA
MORGAN STANLEY
12 |
 CHANGING COMPETITIVE LANDSCAPE
BANK OF AMERICA
MERRILL LYNCH
JP MORGAN & CHASE
UBS
EDWARD JONES
AMERIPRISE
LPL
STIFEL
COMMONWEALTH
FIDELITY
TD AMERITRADE
LINCOLN FINANCIAL
RW BAIRD
CITIGROUP
PIPER JAFFRAY
COWEN
BMO
RBC
JEFFERIES
GOLDMAN SACHS
HARRIS WILLIAMS
MOELIS
VINING SPARKS
KBW
LAZARD
CHARLES SCHWAB
MORGAN STANLEY
13 |
 WHY
MORGAN KEEGAN? 14
1
Culture
2
Strategic Benefit
Price
4
3
Ability to Integrate |
 15
POSITIVE IMPACT ON BUSINESS UNITS
Equity Capital
Markets
Private Client Group
Ranking by
Number of Deals
14
th
9
th
Ranking by Par
Amount
19
th
8
th
Number of Financial
Advisors
Fixed Income |
 FOUNDATION FOR SUCCESS
Management Commitment
Advisor Commitment
16 |
 DAY
1 ACCOMPLISHMENTS 17
Trading Inventory Shared
Benefits Integrated
Payroll Converted
Email Cross-Functional |
 VISION FOR GROWTH
STRATEGIC THINKING
EXECUTION
+
18 |
 Full transition to Raymond
James brand
Institutional and Municipal
Retail trading transitioned to
Raymond James
broker/dealer
Full transition to Raymond
James brand
Transitioned to
Raymond James
broker/dealer
INTEGRATION TIMELINE OVERVIEW
PCG
Equity Capital
Markets
Fixed Income
Within 30 days
Within 12 months
Within 24 months
Transition to
Raymond James
broker/dealer
Public Finance
19 |
 RJ
20
CULTURE: SERVICE/CLIENT ORIENTATION
WIREHOUSES
BOUTIQUES
REGIONALS
CUSTODIANS
THE PREMIER
ALTERNATIVE TO
WALL STREET
INDEPENDENTS
VISION FOR GROWTH |
 CULTURE: SERVICE/CLIENT ORIENTATION
WIREHOUSES
BOUTIQUES
REGIONALS
CUSTODIANS
THE PREMIER
ALTERNATIVE TO
WALL STREET
INDEPENDENTS
VISION FOR GROWTH
21 |
 JEFF JULIEN
Executive Vice President,
Finance
Chief Financial Officer and
Treasurer
22 |
 RJF
HIGHLIGHTS 23
Total Assets
$21 billion
Total Shareholders’
Equity
$3.2 billion
Shares Outstanding
137.4 million
Book Value Per Share
Leverage (Assets/Equity)
6.7x
Leverage Ex. RJ Bank
$1.3 billion
Corporate Debt
$23.29
5.4x
Balance Sheet Highlights, as of June 30, 2012 |
 24
RJF HIGHLIGHTS
Total Revenues
Net Revenues
Net Income
Net Income Per Share (diluted)
Shareholders’
Equity
Market Capitalization
As of June 2011
Nine Months
Ended
June 2011
Change*
$2.8 billion
$2.7 billion
$213 million
$1.60
$3.2 billion
$4.7 billion
$2.6 billion
$2.5 billion
$209 million
$1.65
$2.6 billion
$4.1 billion
9%
9%
1%
(3%)
23%
15%
Nine Months
Ended
June 2012
As of June 2012
* Percentage change in this table reflects calculations from actual numbers and
cannot be recalculated from the figures shown due to rounding
differences. Change* |
 25
RJF HIGHLIGHTS
Total Revenues
Net Revenues
Net Income
Net Income Per Share (diluted)
Three Months
Ended
March 31, 2012
Change*
$1.1 billion
$1.09 billion
$76 million
$0.55
$890 million
$872 million
$69 million
$0.52
25%
25%
11%
6%
Three Months
Ended
June 30, 2012
* Percentage change in this table reflects calculations from actual numbers and
cannot be recalculated from the figures shown due to rounding
differences. |
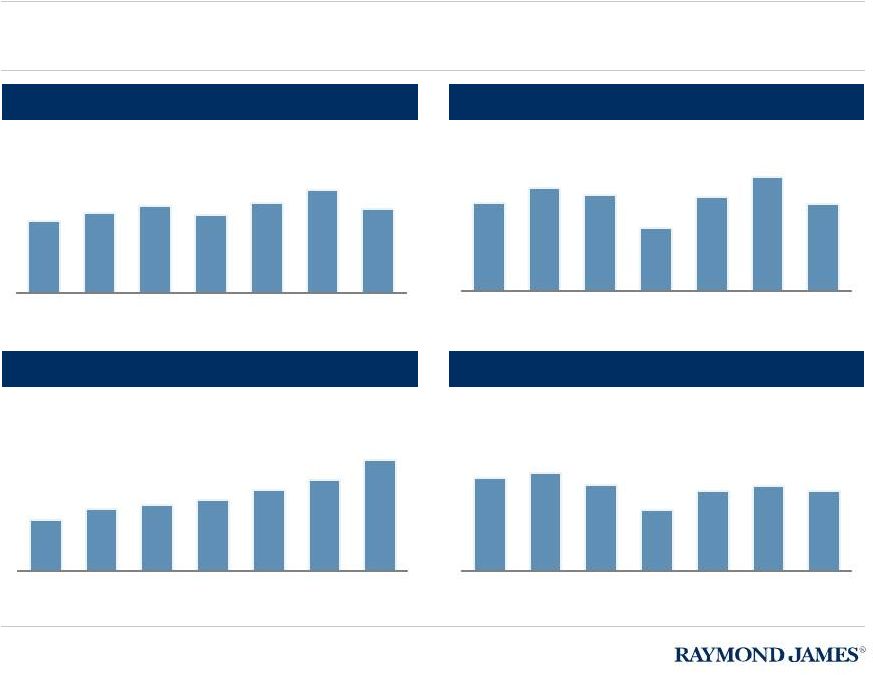 2011 Five-Year CAGR 5%
26
Net Revenues ($mm)
Net Income ($mm)
Shareholders’
Equity ($mm)
Net Margin
RJF FIVE-YEAR TRENDS
2011 Five-Year CAGR 7%
26
2,349
2,610
2,813
2,546
2,917
3,334
2,741
2006
2007
2008
2009
2010
2011
3Q12
YTD
214
250
235
153
228
278
213
2006
2007
2008
2009
2010
2011
3Q12
YTD
1,464
1,758
1,884
2,033
2,303
2,588
3,158
2006
2007
2008
2009
2010
2011
3Q12
YTD
9.1%
9.6%
8.4%
6.0%
7.8%
8.3%
7.8%
2006
2007
2008
2009
2010
2011
3Q12
YTD |
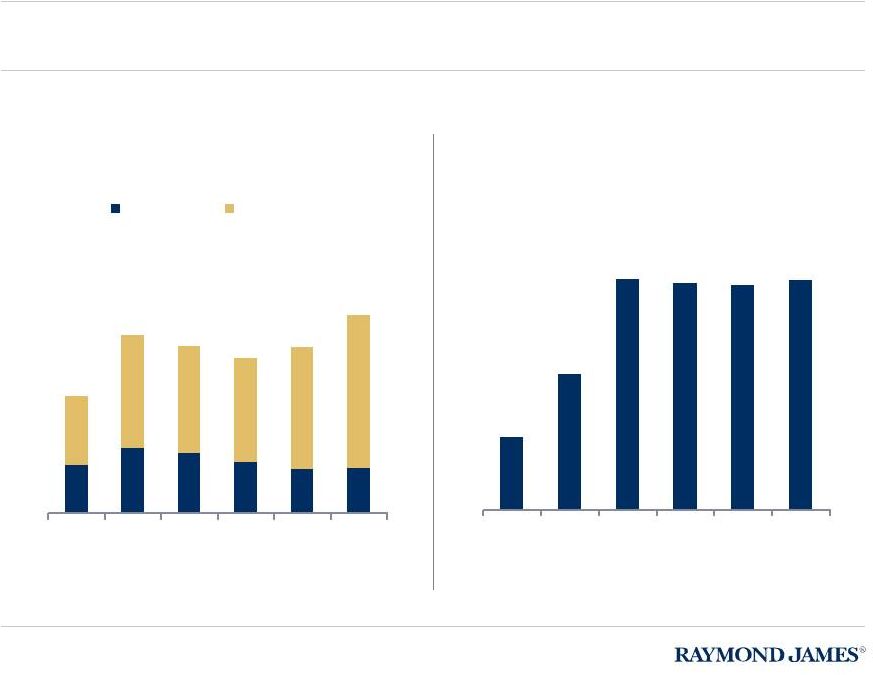
 PRIVATE CLIENT GROUP TRENDS
27
5.4% CAGR
5-year 2011
* Annualized and adjusted for MK
5.3% CAGR
5-year 2011
1,680
1,987
2,000
1,557
1,903
2,186
1,781
06
07
08
09
10
11
YTD
3Q12
Total Revenue
$ Millions
2,449*
169
222
178
85
160
219
160
06
07
08
09
10
11
YTD
3Q12
Pre-
Tax Income
$ Millions
220*
|
 28
PRIVATE CLIENT GROUP TRENDS
7.1% CAGR
5-year 2011
2.4% CAGR
5-year 2011
182
217
197
223
249
256
376
06
07
08
09
10
11
3Q12
Assets
$ Billions
Retail
Institutional
06
07
08
09
10
11
3Q12
Number of Advisors
IAR
RJL
RJ&A
RJFS
MK
4,743
4,659
4,929
5,368
5,350
6,367
5,249 |
 PRIVATE CLIENT GROUP
Total
Securities
Commissions/Fees
Revenue
($mm)
$1,263
$1,812
7.4%
Client
Assets
($bil)
$186
$256
6.6%
Fee-based
Assets
($bil)
$47
$82
10.9%
Recurring
Revenue
52%
64%
4.2%
Financial
Advisors
4,666
5,350
2.8%
Avg.
AUA
per
FA
($mm)
37
43
3.1%
Pre-tax
Income
($mm)
169
219
5.3%
#
FAs
T12
>
$1mm
140
264
13.5%
2011
2006
29
5YR
CAGR
2006/2011
Key Statistics |
 PRIVATE CLIENT GROUP
Total
Securities
Commissions/Fees
Revenue
($mm)
$469
$576
23%
Client
Assets
($bil)
$290
$356
23%
Fee-based
Assets
($bil)
$86
$95
10%
Recurring
Revenue
63%
64%
2%
Financial
Advisors
5,398
6,367
18%
Avg.
AUA
per
FA
($mm)
$52
$59
13%
Pre-tax
Income
($mm)
$46
$64
18%
#
FAs
T12
>
$1mm
265
293
11%
Q312
Q212
30
% Chg.
Key Statistics |
 CAPITAL MARKETS TRENDS
31
5.7% CAGR
5-year 2011
* Annualized and adjusted for MK
816*
503
506
506
533
592
664
06
07
08
09
10
11
YTD
3Q12
Total Revenues
$ Millions
559
93
63
44
73
84
78
60
06
07
08
09
10
11
YTD
3Q12
Pre-
Tax Income
$ Millions
88
* |
 CAPITAL MARKETS TRENDS
32
* Annualized based on first two quarters
* *Annualized and adjusted for MK
1% CAGR
5-year 2011
2.8% CAGR
5-year 2011
97
78
60
70
95
101
60
06
07
08
09
10
11
2Q12
Number of Domestic
Underwriting Deals
120
*
218
210
229
198
222
250
164
06
07
08
09
10
11
3Q12
Institutional Equity
Commissions
$ Millions
221** |
 CAPITAL MARKETS TRENDS
33
*
Annualized
and
adjusted
for
MK
21.8% CAGR
5-year 2011
0.6% CAGR
5-year 2011
27.2
16.5
1.7
48
38
37
06
07
08
09
10
11
YTD
3Q12
Firm Trading Profits
$ Millions
53
*
28
47
53
108
174
147
168
06
07
08
09
10
11
YTD
3Q12
Institutional Fixed
Income Commissions
$ Millions
273
*
126
- |
 ASSET MANAGEMENT GROUP TRENDS
34
1.8% CAGR
5-year 2011
6.1% CAGR
5-year 2011
* Annualized
49
63
62
30
47
66
49
06
07
08
09
10
11
YTD
3Q12
Pre-Tax Income
$ Millions
66
*
208
241
244
177
197
227
176
06
07
08
09
10
11
YTD
3Q12
Total Revenues
$ Millions
234
* |
 ASSET MANAGEMENT GROUP TRENDS
35
Assets as of Sep. 30 of each fiscal year. Eagle’s assets shown here include
retail, institutional/sub-advised and long mutual-fund programs,
both managed and non-managed, but exclude the Eagle money-market funds.
Assets Under Management: Fee-Based
7.5% CAGR
5-year 2011
$0
$10
$20
$30
$40
$50
$60
$70
$80
$90
06
07
08
09
10
11
3Q12
AMS: non
managed
AMS: managed
Eagle |
 36
RAYMOND JAMES BANK TRENDS
* Annualized
19.7% CAGR
5-year 2011
61% CAGR
5-year 2011
23.8% CAGR
5-year 2011
1
Includes
$1.9
billion
borrowed
overnight
for
regulatory
reasons;
2
Includes
$3.2
billion
excess
for
regulatory
reasons;
3
Includes
$3.5
billion
excess
for
regulatory reasons.
115
280
343
277
282
251
06
07
08
09
10
11
YTD
3Q12
Total Revenue
$ Millions
335
405
16
27
112
80
112
173
170
06
07
08
09
10
11
YTD
3Q12
Pre-Tax Income
$ Millions
227
*
6.3
1
11.1
06
07
08
09
10
11
3Q12
Assets
$ Billions
10.8
9.0
9.4
3.1
11.4
2
3 |
 RAYMOND JAMES BANK
Trends
-
-
-
-
-
-
-
-
-
-
-
as of 9/30 -
-
-
-
-
-
-
-
6/30/12
-
-
-
-
-
-
-
-
-
-
-
as of 9/30 -
-
-
-
-
-
-
-
6/30/12
37
4,724
7,225
6,782
6,281
6,730
8,045
07
08
09
10
11
YTD
Total Loans
$ Millions
Residential
Corporate
47
88
150
147
146
149
07
08
09
10
11
YTD
Total Loan Loss
Reserves
$ Millions |
 RAYMOND JAMES BANK
Asset Composition
6/30/12 Total Assets $9.4 billion
Top 5 Corporate Loan Industry
Concentrations
Business Systems &
Services
3.8%
Media
3.6%
Pharmaceuticals
3.1%
Telecommunications
2.9%
Hospitals
2.9%
*Investments at market value, net of unrealized loss of $34 million
pre-tax 38
Residential
Loans
$1.8
Commercial
& Industrial
Loans
$5.3
Commercial
Real Estate
$1.0
Cash
$0.8
Investments*
$0.5 |
 RAYMOND JAMES BANK
Tier 1 Capital
Tier 1 Risk Based Capital
Total Risk Based Capital
Tangible Common Equity to Risk Weighted Assets
10.9%
11.5%
12.8%
11.2%
Credit Ratios as of June 30, 2012
39 |
 RAYMOND JAMES BANK
Quarterly Loan Loss Provision and Charge-Offs
$4.8 charge-
offs
$9.3
provisions
40 |
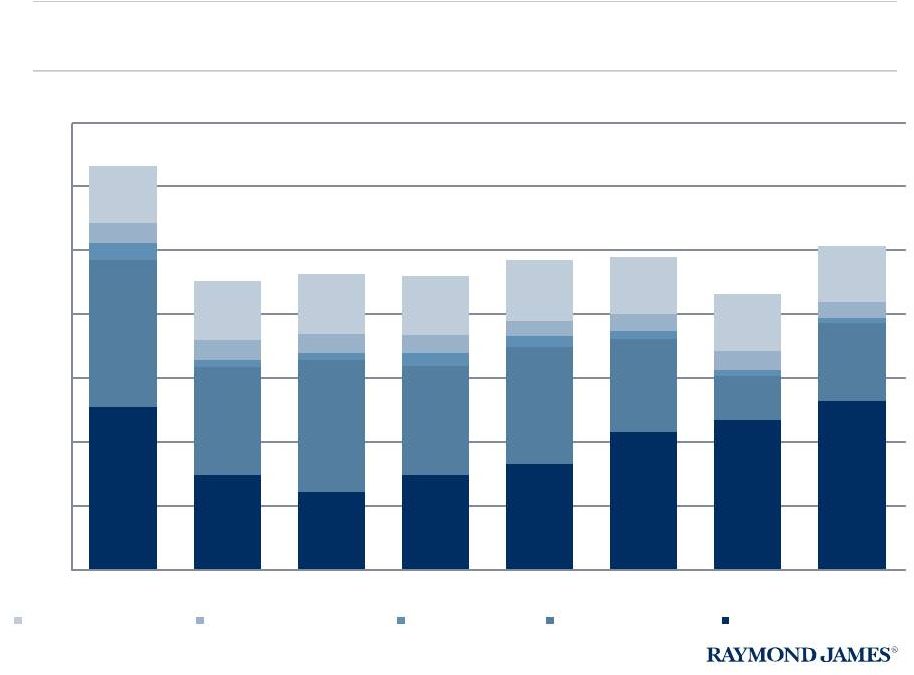 RAYMOND JAMES BANK
41
$631
$451
$462
$459
$484
$489
$431
$506
$254
$147
$121
$147
$165
$215
$233
$264
$230
$169
$207
172
$184
$145
$69
$121
$26
$11
$10
$19
$17
$13
$11
$8
$32
$32
$31
29
$24
$26
$30
$24
$89
$92
$93
$92
$95
$90
$88
$89
$0
$100
$200
300
$400
$500
$600
$700
10
Dec
Mar
11
Jun
11
Sep
11
Dec
11
Mar
12
Jun
12
Residential Substandard
Residential Special Mention
Corporate Doubtful
Corporate Substandard
Corporate Special Mention
$
$
$
Sep
10
-
-
-
-
-
-
-
-
Criticized Loan Trend ($ in millions) |
 RAYMOND JAMES BANK
Non-Performing Asset Trend ($ in millions)
42
$86
$87
$88
88
$92
$87
$87
$87
$68
$49
$44
$52
$42
$24
$16
$13
$8
$9
$9
9
$7
$7
$8
$4
$20
$12
$11
$10
$8
$5
$6
$5
$0
$20
$40
60
$80
$100
$120
$140
$160
$180
$200
Sep
10
Dec
10
Mar
11
Jun
11
Sep
11
Dec
11
Mar
12
Jun
12
Commercial OREO
Residential OREO
Commercial NPLs
Residential NPLs
$182
$157
$152
$159
$148
$124
$117
$109
$
$
$
-
-
-
-
-
-
-
- |
 RAYMOND JAMES FINANCIAL
Net Interest Earnings
43
* Annualized
269
06
07
08
09
10
11
YTD 3Q12
Other
Stock Loan/Stock Borrow
Retail Balances
Raymond James Bank
227
332
387
326
308
361*
173 |
 RAYMOND JAMES FINANCIAL
A 100 basis point rise in short-term interest rates would equate to
an increase of approximately $110 million in pre-tax earnings
$49 mm
$48 mm
$13 mm
$110 mm
Net Interest
Earnings
Client Account
and Service
Fees
Money Market
Mutual Fund
Fees
Estimated
Incremental
Pre-Tax
Earnings
44 |
 RAYMOND JAMES FINANCIAL
Transactional vs. Recurring Revenues
Transactional
Recurring
45
52%
59%
61%
53%
54%
55%
56%
48%
41%
39%
47%
46%
45%
44%
0%
10%
20%
30%
40%
50%
60%
70%
2006
2007
2008
2009
2010
2011
3Q12
Percentage of Total Revenues |
 RAYMOND JAMES FINANCIAL
$350 @
6.90%
Debt Maturities ($ in millions)
$300 @
8.60%
$250 @
5.625%
46
$250 @
4.25%
2016
2019
2024
2042 |
 RAYMOND JAMES FINANCIAL
47
Return on Equity
*2012 YTD Non GAAP ROE: 11.1%
11.1*
18.7
10.0
19.0
21.
24.4
29.
26.
19.4
.7
22.
19.0
19.8
16.
21.0
0.0
5.0
.0
15.0
20.0
25.0
30.0
35.0
3
0
9
4
1
13.3
9.7
9.7
12.8
13.1
15.
15.6
13.0
7.
9
10.6
11.
3
8
10
18
7
9. |
 RAYMOND JAMES FINANCIAL
June 30, 2012
Debt / EBITDA
2.12x
Assets / Equity
6.70x
Debt / Total Capitalization
30%
Total capital (to risk-weighted assets)
17.9%
Tier
I capital (to risk-weighted assets)
16.9%
Tier
I capital (to adjusted assets)
13.7%
Note: Excludes non-controlling interests; RJF , Assumes debt issued in 2012 was
outstanding for entire fiscal year. Summary Metrics
48 |
 RAYMOND JAMES FINANCIAL
(in thousands)
RJF Cash Balance at 6/30/12
Cash on hand (includes cash invested by RJ&A)
$616,000
Dividends
available*:
RJ&A
$62,000
RJ Bank
$65,000
Morgan Keegan
$163,000
COLI borrowings available (3 days)
$122,000
Uncommitted, unsecured lines of credit (RJF only)
$100,000
Total cash available to RJF:
$1,128,000
*A portion is subject to regulatory approval.
Liquidity Analysis
49 |
 August 9, 2012
50 |