Attached files
| file | filename |
|---|---|
| EX-99.1 - EXHIBIT 99.1 - PPL Corp | form8k_exhibit99-1.htm |
| 8-K - FORM 8-K - PPL Corp | form8k.htm |

©PPL Corporation 2012
2nd Quarter Earnings Call
PPL Corporation
August 8, 2012
©PPL Corporation 2012
Exhibit 99.2

©PPL Corporation 2012
2
Cautionary Statements and Factors
That May Affect Future Results
That May Affect Future Results
Any statements made in this presentation about future
operating results or other future events are forward-looking
statements under the Safe Harbor Provisions of the Private
Securities Litigation Reform Act of 1995. Actual results may
differ materially from such forward-looking statements. A
discussion of factors that could cause actual results or events
to vary is contained in the Appendix to this presentation and
in the Company’s SEC filings.

©PPL Corporation 2012
3
Agenda
Second Quarter Earnings Results, Operational
Overview and 2012 Earnings Forecast
Overview and 2012 Earnings Forecast
Segment Results and Financial Overview
Q&A
W. H. Spence
P. A. Farr
©PPL Corporation 2012
4
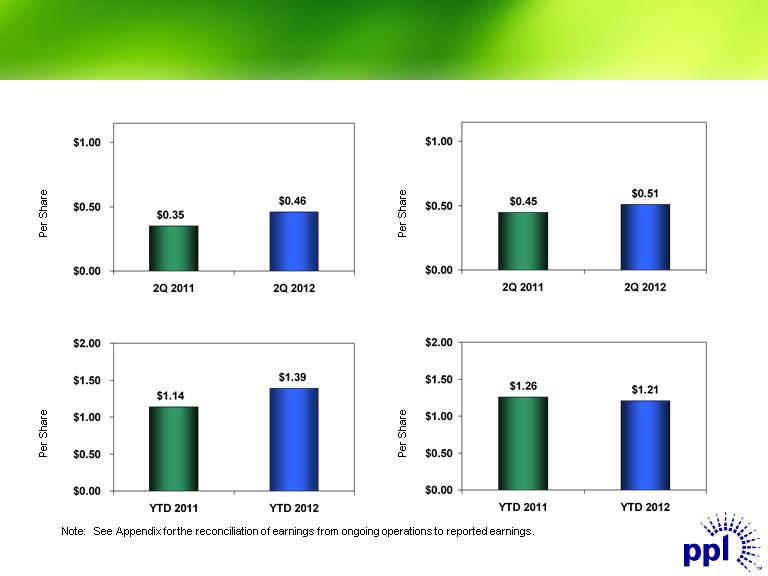
Earnings Results
Second Quarter
Reported Earnings
Second Quarter
Earnings from Ongoing Operations
Year-to-Date
Reported Earnings
Year-to-Date
Earnings from Ongoing Operations
©PPL Corporation 2012
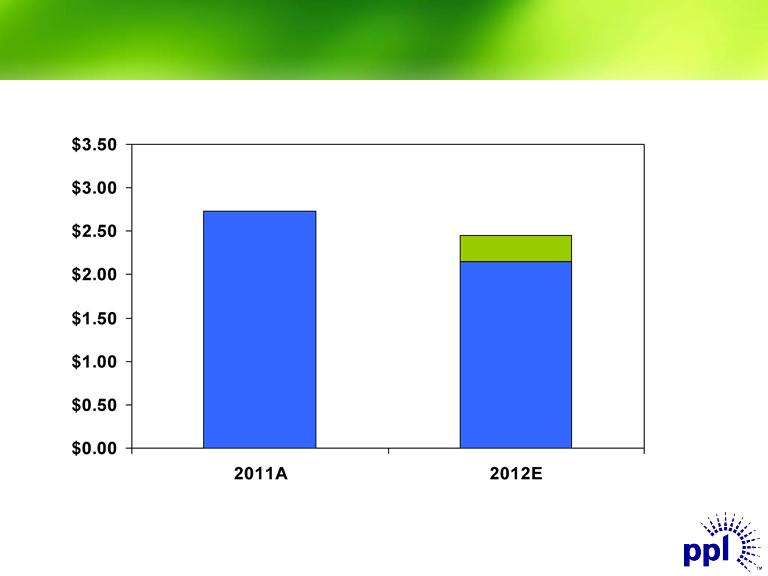
5
Reaffirmed 2012 Ongoing Earnings Forecast
$2.73
$/Share
Note: See Appendix for the reconciliation of earnings from ongoing operations to reported
earnings.
earnings.
$2.45
$2.15

©PPL Corporation 2012
6
Operational Overview
All four WPD distribution companies awarded Customer
Service Excellence Standard
Service Excellence Standard
PPL Electric Utilities awarded its 18th J.D. Power award
Ranked highest among large electric utilities in the eastern U.S.
Positive outlook regarding Susquehanna turbine blades
Inspection found no cracks on Unit #2 blades
Additional diagnostic equipment installed to validate suspected
root causes
root causes
Rate cases filed for LG&E and KU

©PPL Corporation 2012
7
Ongoing Earnings Overview
Q2 2012
Q2 2011
Change
Kentucky Regulated
$0.07
$0.06
$0.01
U.K. Regulated
0.31
0.21
0.10
Pennsylvania Regulated
0.05
0.06
(0.01)
Supply
0.08
0.12
(0.04)
Total
$0.51
$0.45
$0.06
|
Note: See Appendix for the reconciliation of earnings from ongoing operations to reported earnings.
|

©PPL Corporation 2012
8
Kentucky Regulated Segment
Earnings Drivers
Earnings Drivers
|
|
2nd Quarter
|
|
|
2011 EPS - Ongoing Earnings
|
|
$0.06
|
|
Gross Margins
|
0.01
|
|
|
Total
|
|
0.01
|
|
2012 EPS - Ongoing Earnings
|
|
$0.07
|
|
Note: See Appendix for the reconciliation of earnings from ongoing operations to reported earnings.
|

©PPL Corporation 2012
9
U.K. Regulated Segment
Earnings Drivers
Earnings Drivers
|
Note: See Appendix for the reconciliation of earnings from ongoing operations to reported earnings.
(1) Includes additional month of operations, performance improvement and interest expense from the 2011 equity units.
|
|
|
2nd Quarter
|
|
|
2011 EPS - Ongoing Earnings
|
|
$0.21
|
|
Midlands(1)
|
0.10
|
|
|
Delivery revenue
|
0.02
|
|
|
O&M
|
(0.01)
|
|
|
Financing
|
0.01
|
|
|
Effect of exchange rates
|
(0.01)
|
|
|
Dilution
|
(0.01)
|
|
|
Total
|
|
0.10
|
|
2012 EPS - Ongoing Earnings
|
|
$0.31
|

©PPL Corporation 2012
10
Pennsylvania Regulated Segment
Earnings Drivers
Earnings Drivers
|
Note: See Appendix for the reconciliation of earnings from ongoing operations to reported earnings.
|
|
|
2nd Quarter
|
|
|
2011 EPS - Ongoing Earnings
|
|
$0.06
|
|
|
|
|
|
O&M
|
(0.02)
|
|
|
Income taxes & other
|
0.01
|
|
|
Total
|
|
(0.01)
|
|
2012 EPS - Ongoing Earnings
|
|
$0.05
|

©PPL Corporation 2012
11
Supply Segment Earnings Drivers
|
Note: See Appendix for the reconciliation of earnings from ongoing operations to reported earnings.
|
|
|
2nd Quarter
|
|
|
2011 EPS - Ongoing Earnings
|
|
$0.12
|
|
East energy margins
|
0.01
|
|
|
West energy margins
|
(0.01)
|
|
|
O&M
|
(0.01)
|
|
|
Income taxes & other
|
(0.02)
|
|
|
Dilution
|
(0.01)
|
|
|
Total
|
|
(0.04)
|
|
2012 EPS - Ongoing Earnings
|
|
$0.08
|

©PPL Corporation 2012
12
Appendix
©PPL Corporation 2012
13
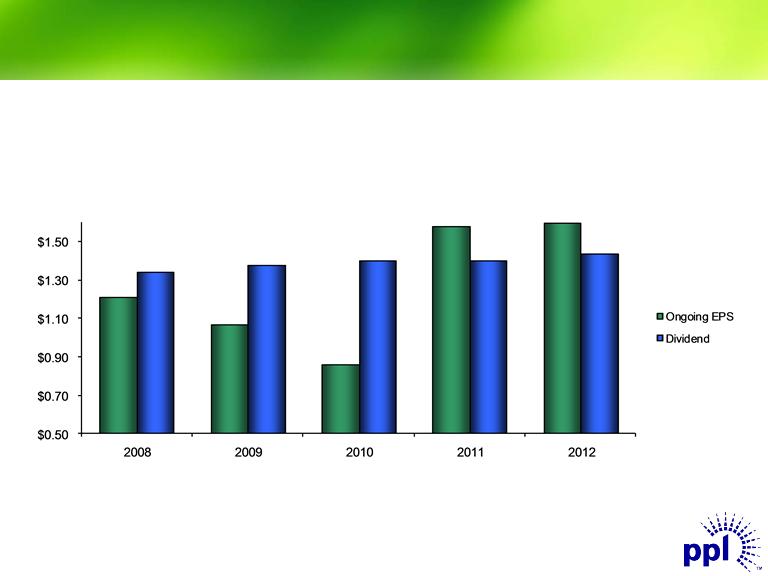
Dividend Profile
A significantly more rate-regulated business mix provides strong
support for current dividend and a platform for future growth
support for current dividend and a platform for future growth
(1) Ongoing EPS based on mid-point of forecast. Annualized dividend based on 2nd quarter declaration. Actual dividends to be determined by Board of Directors.
(2) From only regulated segments.
$/Share
Annualized
(2)
(1)
©PPL Corporation 2012
14
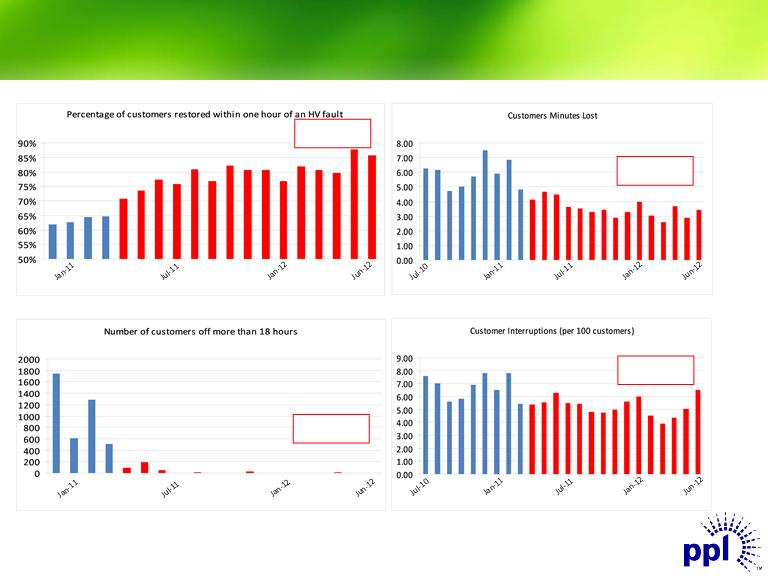
Midlands Integration - Improved
Network Performance
Network Performance
Customer Minutes Lost
Customer Interruptions (per 100 customers)
25.9%
Improvement
Improvement
39.7%
Improvement
Improvement
96%
Improvement
Improvement
21.6%
Improvement
Improvement
18 Hour Standard
Target 60

©PPL Corporation 2012
15
U.K. Electricity Distribution Price Control Review
|
RIIO-ED1 Tentative Schedule
|
|
|
Provisional
Timing |
Milestone
|
|
September 2012
|
Publication of Strategy Consultation
|
|
February 2013
|
Publication of Strategy Decision
|
|
End May 2013
|
DNOs submit business plans
|
|
September 2013
|
Publication of Initial Assessment of companies business plans
|
|
November 2013
|
Publication of Fast Track Proposals (Initial Proposals)
|
|
March 2014
|
Publication of Fast Track Decision (Initial Proposals)
|
|
June 2014
|
Publication of Initial Proposals Consultation for non fast tracked
companies |
|
November 2014
|
Publication of Final Proposals for non fast tracked companies
|
|
December 2014
|
Issue statutory consultation on new license conditions
|
|
April 1, 2015
|
Price control commences
|
Source: Ofgem Press Release dated February 6, 2012

©PPL Corporation 2012
16
LG&E and KU Rate Case Facts
Complete filings available at www.lge-ku.com/regulatory.asp
|
|
LG&E
|
KU
|
|
|
|
Electric
|
Gas
|
Electric
|
|
Revenue Increase Requested
|
$62.1 million
|
$17.2 million
|
$82.4 million
|
|
Test Year
|
12-months ended
3/31/2012 |
12-months ended
3/31/2012 |
12-months ended
3/31/2012 |
|
Requested ROE
|
11.00%
|
11.00%
|
11.00%
|
|
Rate Base
|
$1.97 billion
|
$0.52 billion
|
$3.98 billion
|
|
Common Equity Ratio
|
55.64%
|
55.64%
|
53.74%
|
|
1% Change in ROE =
|
~$15 million in
revenue |
~$8 million in
revenue |
~$18 million in
revenue |
|
Docket No.
|
2012-00222
|
2012-00222
|
2012-00221
|

©PPL Corporation 2012
17
LG&E and KU Rate Case Schedules
1st Request for information received July 31, 2012
LG&E and KU responses filed August 14, 2012
Supplemental request for information received August 28, 2012
LG&E and KU responses filed September 12, 2012
Intervenor testimony filed September 25, 2012
Request to intervenors submitted October 9, 2012
Intervenor responses filed October 22, 2012
LG&E/KU rebuttal testimony filed November 5, 2012
Public meetings across the state TBD
Public hearing in Frankfort TBD
Order issued (tentative) December 28, 2012
New rates effective January 2013
Completed
P
P

©PPL Corporation 2012
18
PPL Electric Utilities Distribution Rate Case Facts
Distribution Revenue Increase Requested $104.6 million
Test Year 2012
Requested ROE 11.25%
2012 Distribution Rate Base $2.42 billion
2012 Common Equity Ratio 51.03%
1% Change in ROE = ~$23 million in revenue
Docket No. R-2012-2290597
Complete filing available at www.pplelectric.com/rateinfo

©PPL Corporation 2012
19
PPL Electric Utilities Distribution Rate Case Schedule
Completed
P
P
Direct testimony of other parties June 22, 2012
Rebuttal testimony July 16, 2012
Sur-rebuttal testimony August 1, 2012
Evidentiary hearings August 6, 7, 9 and 10, 2012
Close of record August 10, 2012
Main briefs August 29, 2012
Reply briefs September 14, 2012
Recommended Decision October 2012
Order issued (tentative) Mid-December 2012
New rates effective January 2013
P
P
©PPL Corporation 2012
20
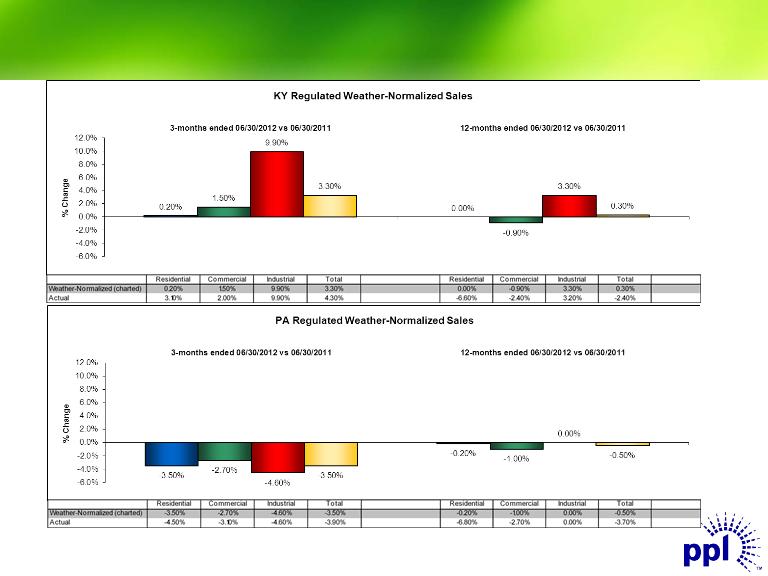
Regulated Volume Variances
Note: Total includes Residential, Commercial and Industrial customer classes as well as “Other”, which is not depicted on the charts above.
©PPL Corporation 2012
21
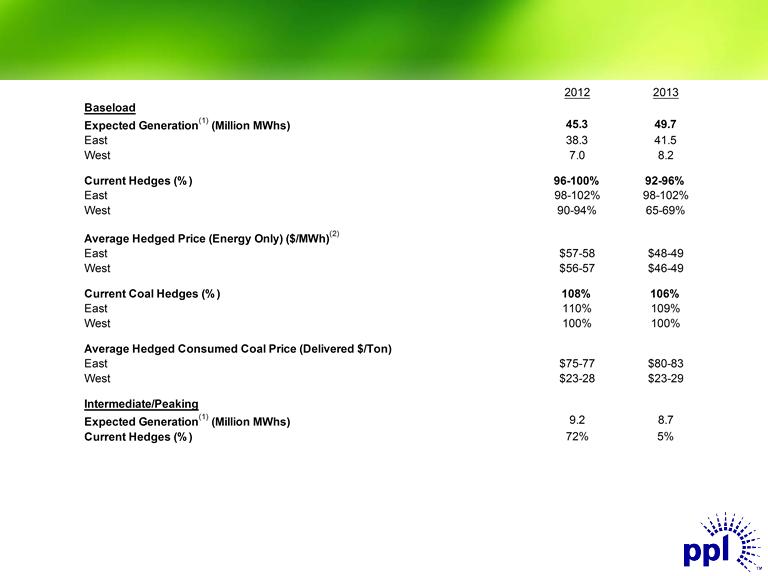
Enhancing Value Through Active Hedging
Capacity revenues are expected to be $385 million and $590 million for 2012 and 2013, respectively.
As of June 30, 2012
(1) Represents expected sales of Supply segment based on current business plan assumptions.
(2) The 2013 ranges of average energy prices for existing hedges were estimated by determining the impact on the existing collars resulting from 2013 power prices at the 5th and 95th
percentile confidence levels.
©PPL Corporation 2012
22
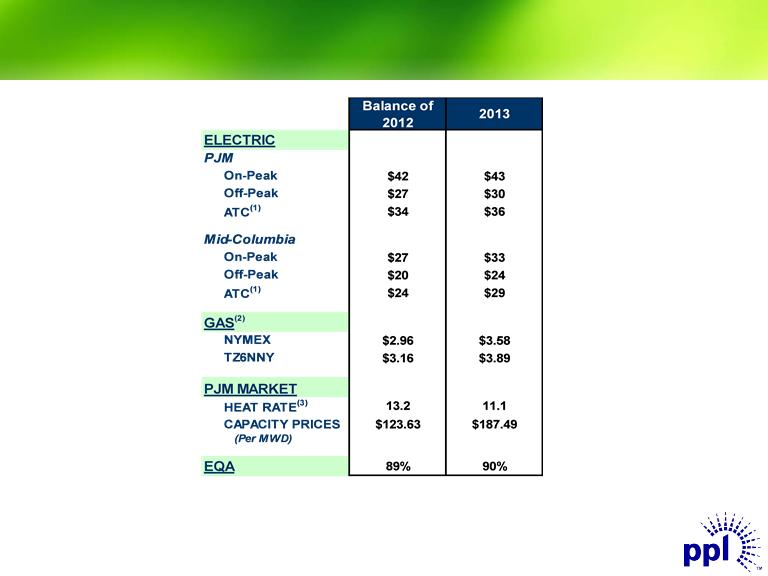
Market Prices
|
(1)
|
24-hour average.
|
|
(2)
|
NYMEX and TZ6NNY forward gas prices on 6/30/2012.
|
|
(3)
|
Market Heat Rate = PJM on-peak power price divided by TZ6NNY gas price.
|
Market Prices Market Prices Market Prices Balance of 2012 2013 ELECTRIC PJM On-Peak Off-Peak ATC(1) Mid-Columbia On-Peak Off-Peak ATC(1) GAS(2) NYMEX TZ6NNY PJM MARKET HEAT RATE(3) CAPACITY PRICES (Per MWD) EQA (1) 24- hour average. $42 $43 $27 $30 $34 $36 $27 $33 $20 $24 $24 $29 $2.96 $3.58 $3.16 $3.89 13.2 11.1 $123.63 $187.49 89% 90% ©PPL Corporation 2012 (2) NYMEX and TZ6NNY forward gas prices on 6/30/ 2012. (3) Market Heat Rate = PJM on-peak power price divided by TZ6NNY gas price. 22
©PPL Corporation 2012
23
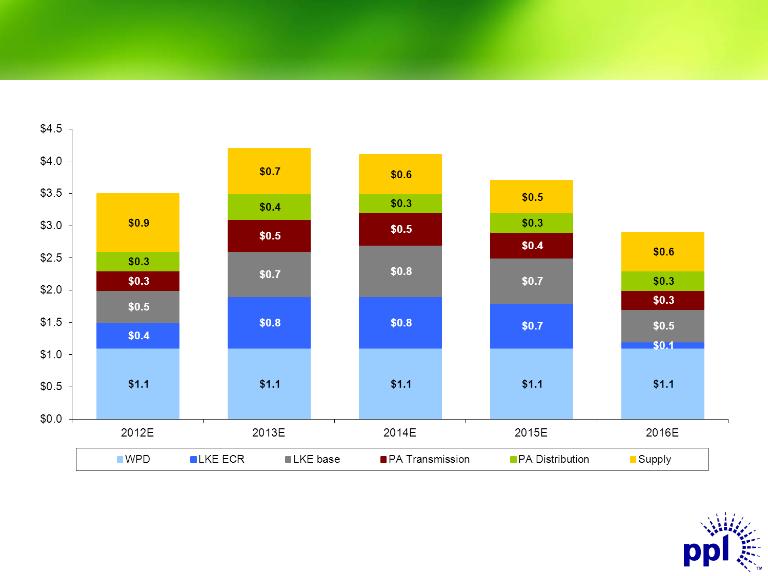
Capital Expenditures
($ in billions)
(1) Includes capex for WPD Midlands. Figures based on assumed exchange rate of $1.57 / GBP.
(2) Expect between 80% and 90% to receive timely returns via ECR mechanism based on historical experience and future projections.
(1)
(2)
$3.5
$4.2
$4.1
$3.7
$2.9
©PPL Corporation 2012
24
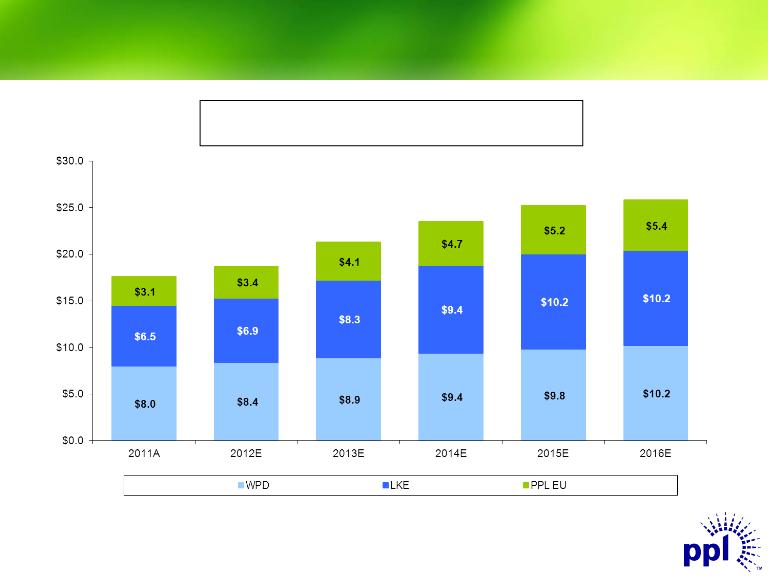
Projected Regulated Rate Base Growth
($ in billions)
(1) Represents capitalization for LKE, as LG&E and KU rate constructs are based on capitalization. Represents Regulatory Asset Value (RAV) for WPD.
(2) Includes RAV for WPD Midlands. Figures based on assumed exchange rate of $1.57 / GBP and are as of year-end December 31.
$18.7
$21.3
$23.5
$25.2
(2)
2012E - 2016E Regulatory Asset Base(1) CAGR: 7.9%
$17.6
$25.8
©PPL Corporation 2012
25
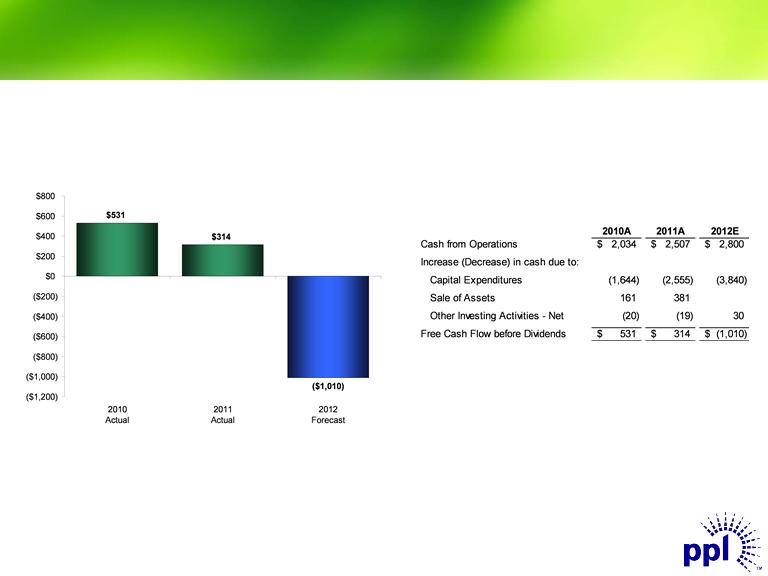
Free Cash Flow before Dividends
Free Cash Flow before
Dividends
Dividends
(Millions of Dollars)
(1) 2010 Free Cash Flow includes two months of the results of the Kentucky Regulated segment.
(1)
Reconciliation of Cash from
Operations to Free Cash Flow
before Dividends
Operations to Free Cash Flow
before Dividends
(Millions of dollars)
Free Cash Flow before Dividends Free Cash Flow before Dividends Free Cash Flow before Dividends Free Cash Flow before Dividends Free Cash Flow before Reconciliation of Cash from Dividends Operations to Free Cash Flow before Dividends (Millions of Dollars) (Millions of dollars) $531 $314 ( $ 1,010) ( $1,200) ( $1,000) ( $800) ( $600) ( $400) ( $200) $0 $200 $400 $600 $800 2010A 2011A 2012E Cash from Operations $ 2,034 $ 2,507 $ 2,800 Increase ( Decrease) in cash due to: Capital Expenditures ( 1,644) (2,555) (3,840) Sale of Assets 161 381 Other Investing Activities - Net ( 20) (19) 30 Free Cash Flow before Dividends $ 531 $ 314 $ (1,010) 2010 2011 2012 (1) Actual Actual Forecast (1) 2010 Free Cash Flow includes two months of the results of the Kentucky Regulated segment. ©PPL Corporation 2012 25
©PPL Corporation 2012
26
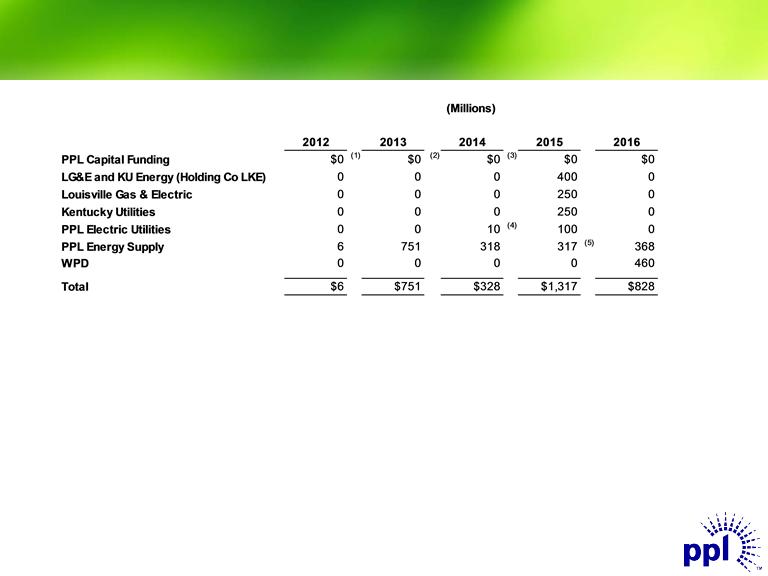
Debt Maturities
Note: As of June 30, 2012
(1) Excludes $99 million of senior notes due 2047, for which PPL Capital Funding gave notice in July 2012 of its election
to redeem at par in August 2012.
(2) Excludes $1.15 billion of junior subordinated notes due 2018 that are a component of PPL’s 2010 Equity Units and may
be put back to PPL Capital Funding if the remarketing in 2013 is not successful.
(3) Excludes $978 million of junior subordinated notes due 2019 that are a component of PPL’s 2011 Equity Units and
may be put back to PPL Capital Funding if the remarketing in 2014 is not successful.
(4) Bonds defeased in substance in 2008 by depositing sufficient funds with the trustee.
(5) Represents REset Put Securities due 2035 that are required to be put by the holders in October 2015 either for (a)
purchase and remarketing by a remarketing dealer or (b) repurchase by PPL Energy Supply.
Debt Maturities Debt Maturities Debt Maturities ( Millions) 2012 2013 2014 2015 2016 $0 (1) (2) $0 (3) PPL Capital Funding $0 $0 $0 LG&E and KU Energy ( Holding Co LKE) 0 0 0400 0 Louisville Gas & Electric 0 0 0250 0 Kentucky Utilities 0 0 0250 0 10 (4) PPL Electric Utilities 00 1000 PPL Energy Supply 6 751 318 317 (5) 368 WPD 0 0 0 0460 Total $6 $751 $328 $1,317 $828 Note: As of June 30, 2012 ( 1) Excludes $99 million of senior notes due 2047, for which PPL Capital Funding gave notice in July 2012 of its election to redeem at par in August 2012. ( 2) Excludes $1.15 billion of junior subordinated notes due 2018 that are a component of PPL’s 2010 Equity Units and may be put back to PPL Capital Funding if the remarketing in 2013 is not successful. ( 3) Excludes $978 million of junior subordinated notes due 2019 that are a component of PPL’s 2011 Equity Units and may be put back to PPL Capital Funding if the remarketing in 2014 is not successful. ( 4) Bonds defeased in substance in 2008 by depositing sufficient funds with the trustee. ( 5) Represents REset Put Securities due 2035 that are required to be put by the holders in October 2015 either for (a) purchase and remarketing by a remarketing dealer or (b) repurchase by PPL Energy Supply. ©PPL Corporation 2012 26
©PPL Corporation 2012
27
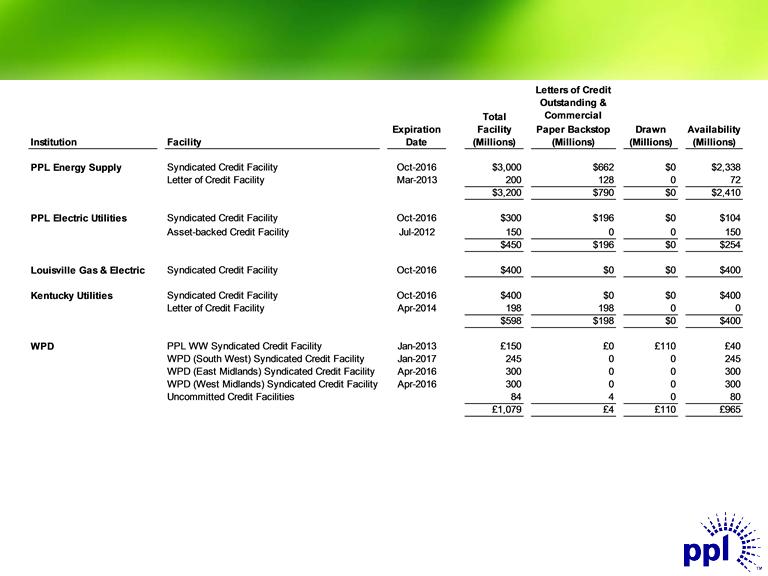
Liquidity Profile
(1)
(1)
Note: As of June 30, 2012
• Credit facilities consist of a diverse bank group, with no bank and its affiliates providing an aggregate commitment of more than
9% of the total committed capacity for the domestic facilities and 16% of the total committed capacity for WPD’s facilities.
9% of the total committed capacity for the domestic facilities and 16% of the total committed capacity for WPD’s facilities.
(1) In July 2012, PPL Energy Supply entered into a $100 million uncommitted letter of credit facility agreement with BBVA that expires
in July 2015.
in July 2015.
(2) In July 2012, PPL Electric Utilities reduced the capacity of the asset-backed credit facility to $100 million and extended the
expiration date to September 24, 2012.
expiration date to September 24, 2012.
(2)
Liquidity Profile Liquidity Profile Liquidity Profile Liquidity Profile Total Expiration Facility Drawn Availability Institution Facility Date (Millions) (Millions) (Millions) Letters of Credit Outstanding & Commercial Paper Backstop (Millions) PPL Energy Supply (1) Syndicated Credit Facility Oct-2016 $ 3,000 $ 662 $ 0 $ 2,338 Letter of Credit Facility Mar-2013 200 128 0 72 $3,200 $790 $0 $2,410 PPL Electric Utilities Syndicated Credit Facility Oct-2016 $ 300 $ 196 $ 0 $ 104 Asset-backed Credit Facility(2) Jul-2012 150 0 0 150 $450 $196 $0 $254 Louisville Gas & Electric Syndicated Credit Facility Oct-2016 $ 400 $ 0 $ 0 $ 400 Kentucky Utilities Syndicated Credit Facility Oct-2016 $ 400 $ 0 $ 0 $ 400 Letter of Credit Facility Apr-2014 198 198 0 0 $598 $198 $0 $400 WPD PPL WW Syndicated Credit Facility Jan-2013 £150 £ 0 £110 £40 WPD (South West) Syndicated Credit Facility Jan-2017 245 0 0 245 WPD (East Midlands) Syndicated Credit Facility Apr-2016 300 0 0 300 WPD ( West Midlands) Syndicated Credit Facility Apr-2016 300 0 0 300 Uncommitted Credit Facilities 84 4 0 80 £1,079 £4 £110 £965 Note: As of June 30, 2012 • Credit facilities consist of a diverse bank group, with no bank and its affiliates providing an aggregate commitment of more than 9% of the total committed capacity for the domestic facilities and 16% of the total committed capacity for WPD’s facilities. ( 1) In July 2012, PPL Energy Supply entered into a $100 million uncommitted letter of credit facility agreement with BBVA that expires in July 2015. ( 2) In July 2012, PPL Electric Utilities reduced the capacity of the asset- backed credit facility to $100 million and extended the expiration date to September 24, 2012. ©PPL Corporation 2012 27
©PPL Corporation 2012
28
Reconciliation of Second Quarter Earnings from
Ongoing Operations to Reported Earnings
Ongoing Operations to Reported Earnings
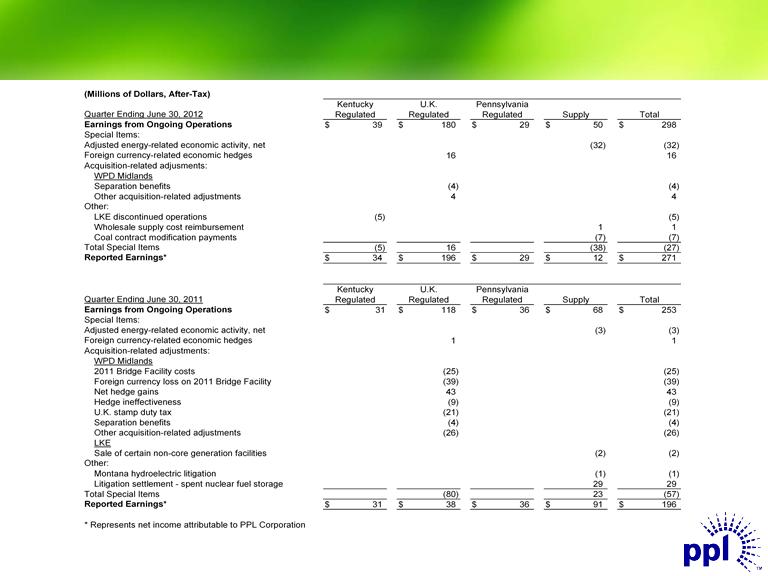
Reconciliation of Second Quarter Earnings from Reconciliation of Second Quarter Earnings from Reconciliation of Second Quarter Earnings from Ongoing Operations to Reported Earnings Ongoing Operations to Reported Earnings Ongoing Operations to Reported Earnings (Millions of Dollars, After-Tax) Kentucky U.K. Pennsylvania Quarter Ending June 30, 2012 Regulated Regulated Regulated Supply Total Earnings from Ongoing Operations $ 39 $ 180 $ 29 $ 50 $ 298 Special Items: Adjusted energy- related economic activity, net (32) (32) Foreign currency-related economic hedges 16 16 Acquisition-related adjustments: WPD Midlands Separation benefits (4) (4) Other acquisition-related adjustments 4 4 Other: LKE discontinued operations (5) (5) Wholesale supply cost reimbursement 1 1 Coal contract modification payments (7) (7) Total Special Items (5) 16 (38) (27) Reported Earnings* $ 34 $ 196 $ 29 $ 12 $ 271 Acquisition-related adjustments: WPD Midlands 2011 Bridge Facility costs Foreign currency loss on 2011 Bridge Facility Net hedge gains Hedge ineffectiveness U. K. stamp duty tax Separation benefits Other acquisition-related adjustments LKE Sale of certain non-core generation facilities Montana hydroelectric litigation Litigation settlement - spent nuclear fuel storage Total Special Items Other: Reported Earnings* Adjusted energy- related economic activity, net Foreign currency-related economic hedges Earnings from Ongoing Operations Special Items: Quarter Ending June 30, 2011 Kentucky Regulated $ 31 $ 31 $ 118 1 (25) (39) 43 (9) (21) (4) (26) (80) $ 38 Regulated U.K. $ 36 $ 36 Regulated Pennsylvania $ $ 68 (3) (2) (1) 29 23 91 Supply $ $ 253 (3) 1 (25) (39) 43 (9) (21) (4) (26) (2) (1) 29 (57) 196 Total * Represents net income attributable to PPL Corporation ©PPL Corporation 2012 28
©PPL Corporation 2012
29
Reconciliation of Second Quarter Earnings from
Ongoing Operations to Reported Earnings
Ongoing Operations to Reported Earnings
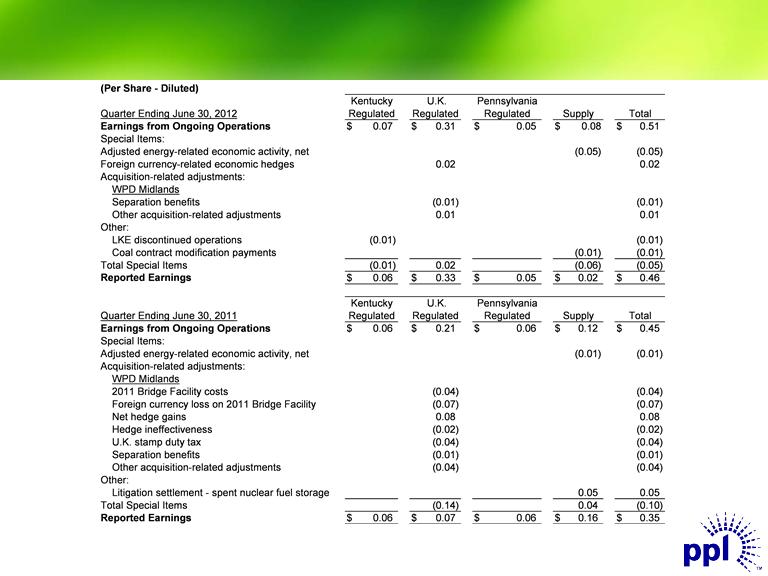
Reconciliation of Second Quarter Earnings from Reconciliation of Second Quarter Earnings from Reconciliation of Second Quarter Earnings from Ongoing Operations to Reported Earnings Ongoing Operations to Reported Earnings Ongoing Operations to Reported Earnings (Per Share - Diluted) Foreign currency- related economic hedges Acquisition-related adjustments: WPD Midlands Adjusted energy-related economic activity, net Earnings from Ongoing Operations Special Items: Quarter Ending June 30, 2012 $ 0.07 Regulated Kentucky$ 0.31 0.02 Regulated U.K. $ 0.05 Regulated Pennsylvania $ 0.08 (0.05) Supply $ 0.51 (0.05) 0.02 Total Separation benefits Other acquisition-related adjustments Other: ( 0.01) 0.01 (0.01) 0.01 LKE discontinued operations Coal contract modification payments Total Special Items Reported Earnings (0.01) (0.01) $ 0.06 0.02 $ 0.33 $ 0.05 ( 0.01) (0.06) $ 0.02 (0.01) (0.01) (0.05) $ 0.46 Kentucky U.K. Pennsylvania Quarter Ending June 30, 2011 Regulated Regulated Regulated Supply Total Earnings from Ongoing Operations $ 0.06 $ 0.21 $ 0.06 $ 0.12 $ 0.45 Special Items: Adjusted energy-related economic activity, net (0.01) (0.01) Acquisition-related adjustments: WPD Midlands 2011 Bridge Facility costs ( 0.04) (0.04) Foreign currency loss on 2011 Bridge Facility (0.07) (0.07) Net hedge gains 0.08 0.08 Hedge ineffectiveness (0.02) (0.02) U. K. stamp duty tax ( 0.04) (0.04) Separation benefits ( 0.01) (0.01) Other acquisition-related adjustments ( 0.04) (0.04) Other: Litigation settlement - spent nuclear fuel storage 0.05 0.05 Total Special Items (0.14) 0.04 (0.10) Reported Earnings $ 0.06 $ 0.07 $ 0.06 $ 0.16 $ 0.35 ©PPL Corporation 2012 29
©PPL Corporation 2012
30
Reconciliation of Year-to-Date Earnings from
Ongoing Operations to Reported Earnings
Ongoing Operations to Reported Earnings
©PPL Corporation 2012
31
Reconciliation of Year-to-Date Earnings from
Ongoing Operations to Reported Earnings
Ongoing Operations to Reported Earnings
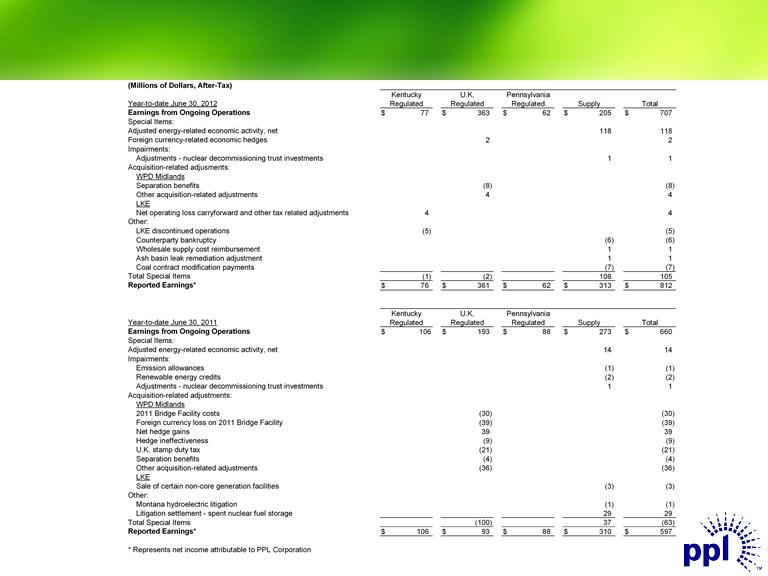
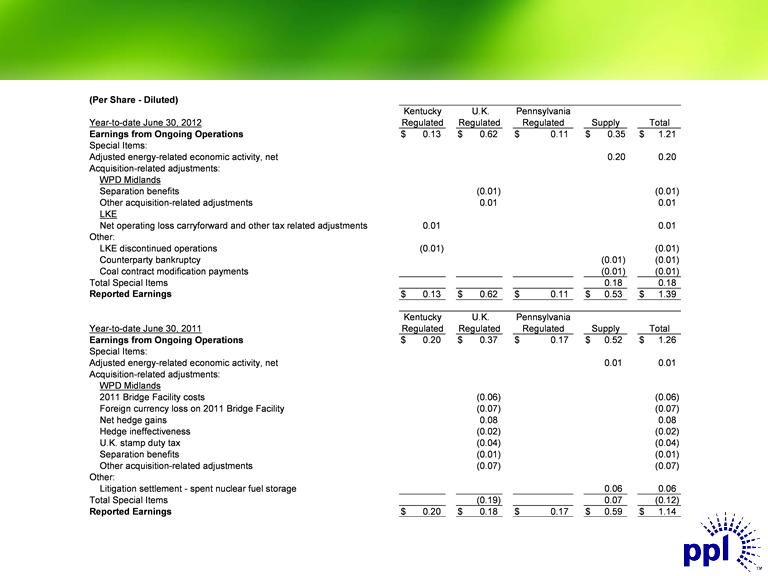
Reconciliation of Year Reconciliation of Year-- to to-- Date Earnings from Date Earnings from Ongoing Operations to Reported Earnings Ongoing Operations to Reported Earnings Reconciliation of Year Reconciliation of Year-- to to-- Date Earnings from Date Earnings from Ongoing Operations to Reported Earnings Ongoing Operations to Reported Earnings (Per Share - Diluted) Kentucky U.K. Pennsylvania Year-to-date June 30, 2012 Regulated Regulated Regulated Supply Total Earnings from Ongoing Operations $ 0.13 $ 0.62 $ 0.11 $ 0.35 $ 1.21 Special Items: Adjusted energy-related economic activity, net 0.20 0.20 Acquisition-related adjustments: WPD Midlands Separation benefits (0.01) (0.01) Other acquisition- related adjustments 0.01 0.01 LKE Net operating loss carryforward and other tax related adjustments 0.01 0.01 Other: LKE discontinued operations (0.01) (0.01) Counterparty bankruptcy (0.01) (0.01) Coal contract modification payments (0.01) (0.01) Total Special Items 0.18 0.18 Reported Earnings $ 0.13 $ 0.62 $ 0.11 $ 0.53 $ 1.39 Kentucky U.K. Pennsylvania Year-to-date June 30, 2011 Regulated Regulated Regulated Supply Total Earnings from Ongoing Operations $ 0.20 $ 0.37 $ 0.17 $ 0.52 $ 1.26 Special Items: Adjusted energy-related economic activity, net 0.01 0.01 Acquisition-related adjustments: WPD Midlands 2011 Bridge Facility costs ( 0.06) (0.06) Foreign currency loss on 2011 Bridge Facility (0.07) (0.07) Net hedge gains 0.08 0.08 Hedge ineffectiveness ( 0.02) (0.02) U. K. stamp duty tax (0.04) (0.04) Separation benefits (0.01) (0.01) Other acquisition- related adjustments ( 0.07) (0.07) Other: Litigation settlement - spent nuclear fuel storage 0.06 0.06 Total Special Items (0.19) 0.07 (0.12) Reported Earnings $ 0.20 $ 0.18 $ 0.17 $ 0.59 $ 1.14 ©PPL Corporation 2012 31
©PPL Corporation 2012
32
Reconciliation of PPL’s Earnings from Ongoing
Operations to Reported Earnings
Operations to Reported Earnings
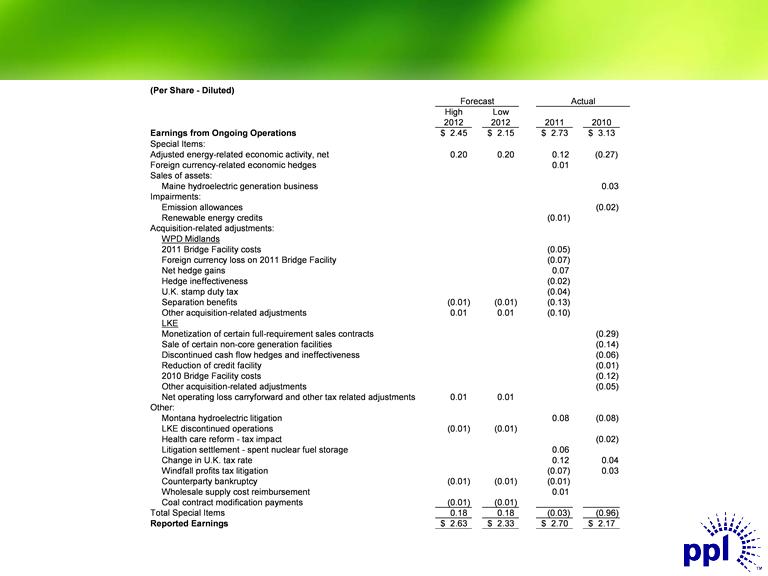
Reconciliation of PPL Reconciliation of PPL’’ s Earnings from Ongoings Earnings from Ongoing Operations to Reported Earnings Operations to Reported Earnings Reconciliation of PPL Reconciliation of PPL’’ s Earnings from Ongoings Earnings from Ongoing Operations to Reported Earnings Operations to Reported Earnings ©PPL Corporation 2012 32 (Per Share - Diluted) Forecast Actual High Low 2012 2012 2011 2010 Earnings from Ongoing Operations $ 2.45 $ 2.15 $ 2.73 $ 3.13 Special Items: Adjusted energy-related economic activity, net 0.20 0.20 0.12 ( 0.27) Foreign currency-related economic hedges 0.01 Sales of assets: Maine hydroelectric generation business 0.03 Impairments: Emission allowances ( 0.02) Renewable energy credits ( 0.01) Acquisition-related adjustments: WPD Midlands 2011 Bridge Facility costs ( 0.05) Foreign currency loss on 2011 Bridge Facility ( 0.07) Net hedge gains 0.07 Hedge ineffectiveness ( 0.02) U.K. stamp duty tax ( 0.04) Separation benefits ( 0.01) (0.01) ( 0.13) Other acquisition-related adjustments 0.01 0.01 ( 0.10) LKE Monetization of certain full-requirement sales contracts ( 0.29) Sale of certain non-core generation facilities ( 0.14) Discontinued cash flow hedges and ineffectiveness ( 0.06) Reduction of credit facility ( 0.01) 2010 Bridge Facility costs ( 0.12) Other acquisition-related adjustments ( 0.05) Net operating loss carryforward and other tax related adjustments 0.01 0.01 Other: Montana hydroelectric litigation 0.08 ( 0.08) LKE discontinued operations (0.01) (0.01) Health care reform - tax impact ( 0.02) Litigation settlement - spent nuclear fuel storage 0.06 Change in U.K. tax rate 0.12 0.04 Windfall profits tax litigation ( 0.07) 0.03 Counterparty bankruptcy (0.01) (0.01) ( 0.01) Wholesale supply cost reimbursement 0.01 Coal contract modification payments ( 0.01) (0.01) Total Special Items 0.18 0.18 ( 0.03) ( 0.96) Reported Earnings $ 2.63 $ 2.33 $ 2.70 $ 2.17 32
©PPL Corporation 2012
33
Gross Margins Summary
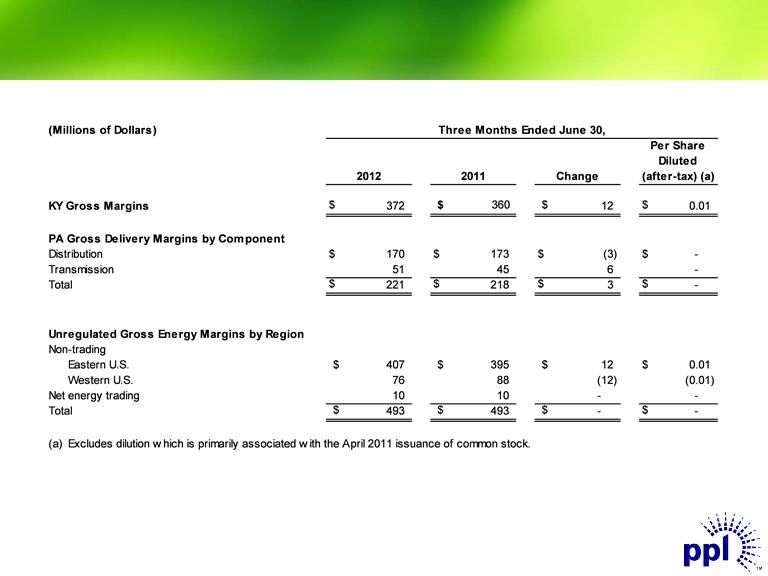
Gross Margins Summary Gross Margins Summary Gross Margins Summary Gross Margins Summary (Millions of Dollars) Three Months Ended June 30, Per Share Diluted 2012 2011 Change (after-tax) (a) KY Gross Margins $ 372 $ 360 $ 12$ 0.01 PA Gross Delivery Margins by Component Distribution $ 170 $ 173 $ ( 3) $ Transmission 51 45 6 Total $ 221 $ 218 $ 3$ Unregulated Gross Energy Margins by Region Non- trading Eastern U. S. $ 407 $ 395 $ 12 $ 0.01 Western U. S. 76 88 ( 12) ( 0.01) Net energy trading 10 10 - Total $ 493 $ 493 $ - $ ( a) Excludes dilution which is primarily associated with the April 2011 issuance of common stock. ©PPL Corporation 2012 33
©PPL Corporation 2012
34
Reconciliation of Second Quarter
Operating Income to Margins
Operating Income to Margins
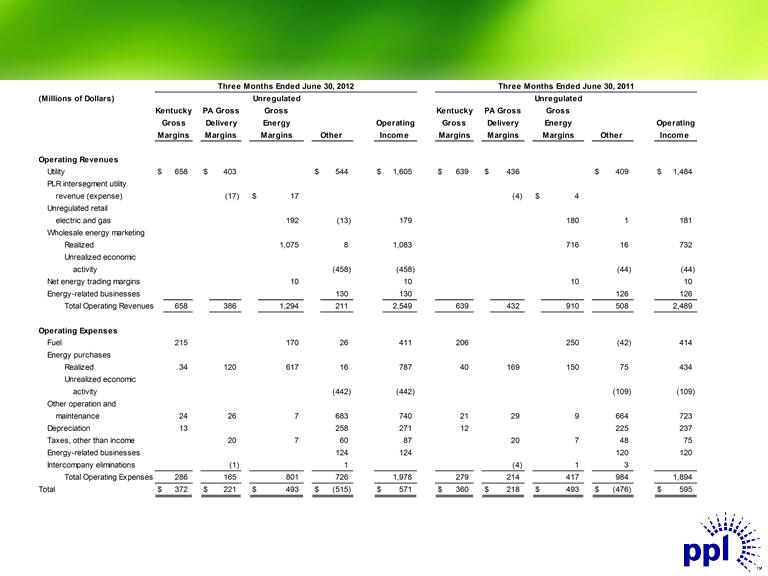
Reconciliation of Second Quarter Reconciliation of Second Quarter Operating Income to Margins Operating Income to Margins Reconciliation of Second Quarter Reconciliation of Second Quarter Operating Income to Margins Operating Income to Margins Three Months Ended June 30, 2012 Three Months Ended June 30, 2011 ( Millions of Dollars) Unregulated Unregulated Kentucky PA Gross Gross Kentucky PA Gross Gross Gross Delivery Energy Operating Gross Delivery Energy Operating Margins Margins Margins Other Income Margins Margins Margins Other Income Operating Revenues Utility $ 658 $ 403 $ 544 $ 1,605 $ 639 $ 436 $ 409 $ 1,484 PLR intersegment utility revenue ( expense) ( 17) $ 17 ( 4) $ 4 Unregulated retail electric and gas 192 ( 13) 179 180 1 181 Wholesale energy marketing Realized 1,075 8 1,083 716 16 732 Unrealized economic activity ( 458) ( 458) ( 44) ( 44) Net energy trading margins 10 10 10 10 Energy- related businesses 130 130 126 126 Total Operating Revenues 658 386 1,294 211 2,549 639 432 910 508 2,489 Operating Expenses Fuel 215 170 26 411 206 250 ( 42) 414 Energy purchases Realized 34 120 617 16 787 40 169 150 75 434 Unrealized economic activity ( 442) ( 442) ( 109) ( 109) Other operation and maintenance 24 26 7 683 740 21 29 9 664 723 Depreciation 13 258 271 12 225 237 Taxes, other than income 20 7 60 87 20 7 48 75 Energy- related businesses 124 124 120 120 Intercompany eliminations (1) 1 ( 4) 1 3 Total Operating Expenses 286 165 801 726 1,978 279 214 417 984 1,894 Total $ 372 $ 221 $ 493 $ ( 515) $ 571 $ 360 $ 218 $ 493 $ ( 476) $ 595 ©PPL Corporation 2012 34

©PPL Corporation 2012
35
Forward-Looking Information Statement
Statements contained in this presentation, including statements with respect to future earnings, cash flows, financing, regulation and
corporate strategy are "forward-looking statements" within the meaning of the federal securities laws. Although PPL Corporation
believes that the expectations and assumptions reflected in these forward-looking statements are reasonable, these statements are
subject to a number of risks and uncertainties, and actual results may differ materially from the results discussed in the statements.
The following are among the important factors that could cause actual results to differ materially from the forward-looking statements:
market demand and prices for energy, capacity and fuel; weather conditions affecting customer energy usage and operating costs;
competition in power markets; the effect of any business or industry restructuring; the profitability and liquidity of PPL Corporation, its
subsidiaries and customers; new accounting requirements or new interpretations or applications of existing requirements; operating
performance of plants and other facilities; the length of scheduled and unscheduled outages at our generating plants; environmental
conditions and requirements and the related costs of compliance, including environmental capital expenditures and emission
allowance and other expenses; system conditions and operating costs; development of new projects, markets and technologies;
performance of new ventures; asset or business acquisitions and dispositions, and PPL Corporation’s ability to realize the expected
benefits from acquired businesses, including the 2010 acquisition of Louisville Gas and Electric Company and Kentucky Utilities
Company and the 2011 acquisition of the Central Networks electricity distribution businesses in the U.K.; any impact of hurricanes or
other severe weather on our business, including any impact on fuel prices; receipt of necessary government permits, approvals, rate
relief and regulatory cost recovery; capital market conditions and decisions regarding capital structure; the impact of state, federal or
foreign investigations applicable to PPL Corporation and its subsidiaries; the outcome of litigation against PPL Corporation and its
subsidiaries; stock price performance; the market prices of equity securities and the impact on pension income and resultant cash
funding requirements for defined benefit pension plans; the securities and credit ratings of PPL Corporation and its subsidiaries;
political, regulatory or economic conditions in states, regions or countries where PPL Corporation or its subsidiaries conduct business,
including any potential effects of threatened or actual terrorism or war or other hostilities; foreign exchange rates; new state, federal or
foreign legislation, including new tax legislation; and the commitments and liabilities of PPL Corporation and its subsidiaries. Any such
forward-looking statements should be considered in light of such important factors and in conjunction with PPL Corporation's Form 10
-K and other reports on file with the Securities and Exchange Commission.

©PPL Corporation 2012
36
Definitions of Non-GAAP Financial Measures
“Earnings from ongoing operations,” also referred to as “ongoing earnings,” should not be considered as an alternative to reported earnings, or net
income attributable to PPL, which is an indicator of operating performance determined in accordance with generally accepted accounting principles
(GAAP). PPL believes that “earnings from ongoing operations,” although a non-GAAP financial measure, is also useful and meaningful to investors
because it provides management’s view of PPL’s fundamental earnings performance as another criterion in making investment decisions. PPL’s
management also uses “earnings from ongoing operations” in measuring certain corporate performance goals. Other companies may use different
measures to present financial performance.
“Earnings from ongoing operations” is adjusted for the impact of special items. Special items include:
• Adjusted energy-related economic activity (as discussed below).
• Foreign currency-related economic hedges.
• Gains and losses on sales of assets not in the ordinary course of business.
• Impairment charges (including impairments of securities in the company’s nuclear decommissioning trust funds).
• Workforce reduction and other restructuring impacts.
• Acquisition-related adjustments.
• Other charges or credits that are, in management’s view, not reflective of the company’s ongoing operations.
Adjusted energy-related economic activity includes the changes in fair value of positions used economically to hedge a portion of the economic value
of PPL’s generation assets, full-requirement sales contracts and retail activities. This economic value is subject to changes in fair value due to market
price volatility of the input and output commodities (e.g., fuel and power) prior to the delivery period that was hedged. Also included in energy-related
economic activity is the ineffective portion of qualifying cash flow hedges, the monetization of certain full-requirement sales contracts and premium
amortization associated with options. This economic activity is deferred, with the exception of the full-requirement sales contracts that were
monetized, and included in earnings from ongoing operations over the delivery period of the item that was hedged or upon realization. Management
believes that adjusting for such amounts provides a better matching of earnings from ongoing operations to the actual amounts settled for PPL’s
underlying hedged assets. Please refer to the Notes to the Financial Statements and MD&A in PPL Corporation’s periodic filings with the Securities
and Exchange Commission for additional information on energy-related economic activity.
Free cash flow before dividends is derived by deducting capital expenditures and other investing activities-net, from cash flow from operations. Free
cash flow before dividends should not be considered as an alternative to cash flow from operations, which is determined in accordance with GAAP.
PPL believes that free cash flow before dividends, although a non-GAAP measure, is an important measure to both management and investors, as it
is an indicator of the company's ability to sustain operations and growth without additional outside financing beyond the requirement to fund maturing
debt obligations. Other companies may calculate free cash flow before dividends in a different manner.

©PPL Corporation 2012
37
Definitions of Non-GAAP Financial Measures
"Kentucky Gross Margins" is a single financial performance measure of the Kentucky Regulated segment's electricity generation, transmission and
distribution operations as well as its distribution and sale of natural gas. In calculating this measure, utility revenues and expenses associated with
approved cost recovery tracking mechanisms are offset. Certain costs associated with these mechanisms, primarily ECR and DSM, are recorded as
"Other operation and maintenance“ and "Depreciation.” These mechanisms allow for recovery of certain expenses, returns on capital investments
and performance incentives. As a result, this measure represents the net revenues from the Kentucky Regulated segment's operations.
"Pennsylvania Gross Delivery Margins" is a single financial performance measure of the Pennsylvania Regulated segment's electric delivery
operations, which includes transmission and distribution activities. In calculating this measure, utility revenues and expenses associated with
approved recovery mechanisms, including energy provided as a PLR, are offset with minimal impact on earnings. Costs associated with these
mechanisms are recorded in "Energy purchases," "Other operation and maintenance,“ which is primarily Act 129 costs, and in "Taxes, other than
income," which is primarily gross receipts tax. This performance measure includes PLR energy purchases by PPL Electric from PPL EnergyPlus,
which are reflected in “PLR intersegment utility revenue (expense).” As a result, this measure represents the net revenues from the Pennsylvania
Regulated segment's electric delivery operations.
"Unregulated Gross Energy Margins" is a single financial performance measure of the Supply segment's competitive energy non-trading and trading
activities. In calculating this measure, the Supply segment's energy revenues, which include operating revenues associated with certain Supply
segment businesses that are classified as discontinued operations, are offset by the cost of fuel, energy purchases, certain other operation and
maintenance expenses, primarily ancillary charges, gross receipts tax, which is recorded in "Taxes, other than income," and operating expenses
associated with certain Supply segment businesses that are classified as discontinued operations. This performance measure is relevant to PPL
due to the volatility in the individual revenue and expense lines on the Statements of Income that comprise "Unregulated Gross Energy Margins."
This volatility stems from a number of factors, including the required netting of certain transactions with ISOs and significant swings in unrealized
gains and losses. Such factors could result in gains or losses being recorded in either "Wholesale energy marketing" or "Energy purchases" on the
Statements of Income. This performance measure includes PLR revenues from energy sales to PPL Electric by PPL EnergyPlus, which are
reflected in "PLR intersegment utility revenue (expense)." PPL excludes from "Unregulated Gross Energy Margins" the Supply segment's adjusted
energy-related economic activity, which includes the changes in fair value of positions used to economically hedge a portion of the economic value of
PPL's competitive generation assets, full-requirement sales contracts and retail activities. This economic value is subject to changes in fair value
due to market price volatility of the input and output commodities (e.g., fuel and power) prior to the delivery period that was hedged. Also included in
this energy-related economic activity is the ineffective portion of qualifying cash flow hedges, the monetization of certain full-requirement sales
contracts and premium amortization associated with options. This economic activity is deferred, with the exception of the full-requirement sales
contracts that were monetized, and included in unregulated gross energy margins over the delivery period that was hedged or upon realization.