Attached files
| file | filename |
|---|---|
| 8-K - FORM 8-K - HUNTINGTON INGALLS INDUSTRIES, INC. | d392622d8k.htm |
| EX-99.1 - PRESS RELEASE - HUNTINGTON INGALLS INDUSTRIES, INC. | d392622dex991.htm |
Exhibit 99.2
Q2 2012 Earnings Presentation
August 8, 2012
Mike Petters
President and Chief Executive Officer
Barb Niland
Corporate Vice President, Business Management Huntington Ingalls Industries
& Chief Financial Officer
Safe Harbor
Statements in this presentation, other than statements of historical fact, constitute “forward-looking statements” within the meaning of the Private Securities Litigation Reform Act of 1995. Forward-looking statements involve risks and uncertainties that could cause our actual results to differ materially from those expressed in these statements. Factors that may cause such differences include: changes in government and customer priorities and requirements (including government budgetary constraints, shifts in defense spending, and changes in customer short-range and long-range plans); our ability to obtain new contracts, estimate our costs and perform effectively; risks related to our spin-off from Northrop Grumman (including our increased costs and leverage); our ability to realize the expected benefits from consolidation of our Ingalls facilities; natural disasters; adverse economic conditions in the United States and globally; and other risk factors discussed in our filings with the U.S. Securities and Exchange Commission. There may be other risks and uncertainties that we are unable to predict at this time or that we currently do not expect to have a material adverse effect on our business, and we undertake no obligations to update any forward-looking statements. This presentation also contains non-GAAP financial measures and includes a GAAP reconciliation of these financial measures. Non-GAAP financial measures should not be construed as being more important than comparable GAAP measures.
| 2 |
|
Highlights from the Second Quarter 2012
Diluted EPS of $1.00 for the second quarter, up $0.20 over Q2 2011
Total operating margin was 6.2%, up from 5.8% for the same period 2011
Newport News operating margin was 9.1%, flat to second quarter 2011 Ingalls operating margin was 5.0%, up from 2.7% in second quarter 2011 Cash from operating activities was $151 million for Q2 2012 Announced $2.5 billion of new contract awards during Q2 2012 including: ?Detail design and construction of LHA-7 Tripoli Advance procurement for LPD-27 (unnamed)
Launched LPD-25 Somerset and LHA-6 America, meeting key program milestones
Successfully completed U.S. Navy acceptance trials for LPD-23 Anchorage
| 3 |
|
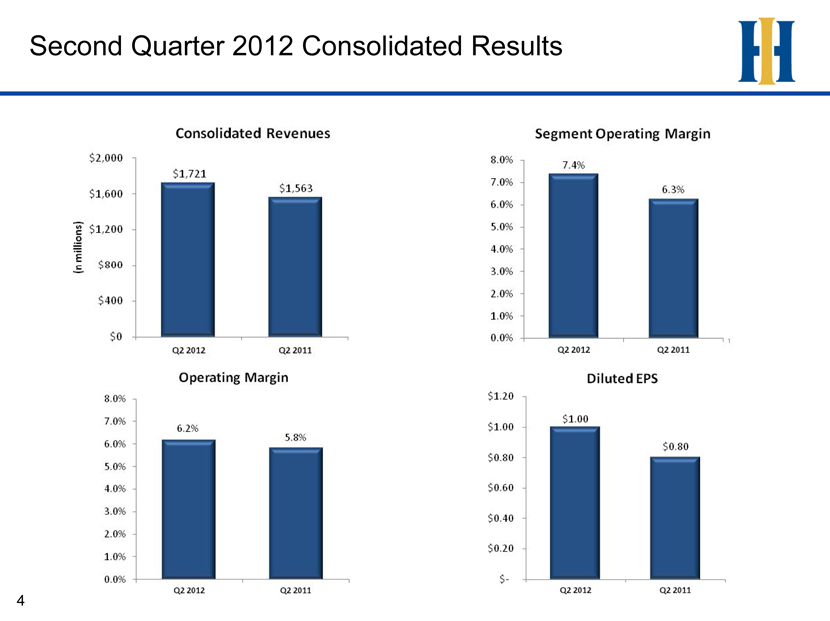
Second Quarter 2012 Consolidated Results
Consolidated Revenues $2,000 $1,600 $1,200 $800 $400 $0 Q2 2012 Q2 2011
Operating margin 8.0% 7.0% 60.% 5.0% 4.0% 3.0% 2.0% 1.0% 0.0% 6.2% 5.8% Q2 2012 Q2 2011
Segment Operating Margin 8.0% 7.0% 60.% 5.0% 4.0% 3.0% 2.0% 1.0% 0.0% 7.4% 6.3% Q2 2012 Q2 2011
Diluted EPS
$1.20 $1.00 $0.80 $0.60 $0.40 $0.20 $- $1.00 $0.80 Q2 2012 Q2 2011
| 4 |
|
(in millions)
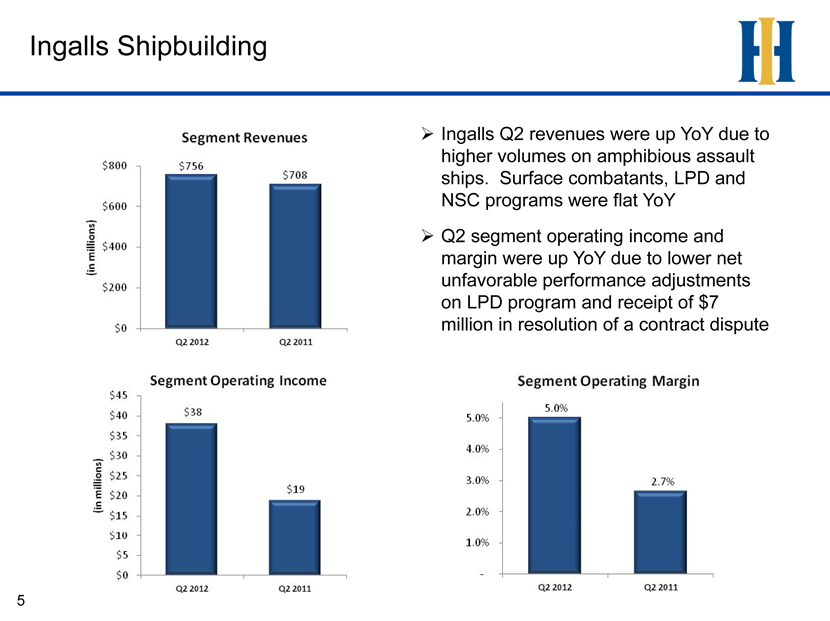
Ingalls Shipbuilding
Ingalls Q2 revenues were up YoY due to higher volumes on amphibious assault ships. Surface combatants, LPD and NSC programs were flat YoY
Q2 segment operating income and margin were up YoY due to lower net unfavorable performance adjustments on LPD program and receipt of $7 million in resolution of a contract dispute
Segment Revenues $800 $600 $400 $200 $0 Q2 2012 Q2 2011 $756 $708
Segment Operating Income $45 $40 $35 30 $25 $20 $15 $10 $5 $0 Q2 2012 Q2 2011 $38 $19
Segment Operating Margin
5.0% 4.0% 3.0% 2.0% 1.0%—Q2 2012 Q2 2011 5.0% 2.7% (in millions) (in millions)
| 5 |
|
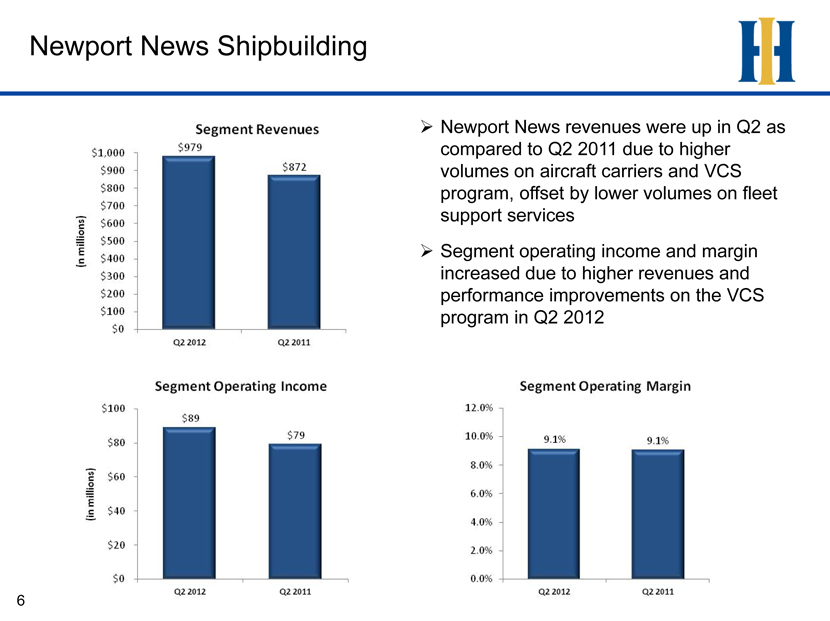
Newport News Shipbuilding
Newport News revenues were up in Q2 as compared to Q2 2011 due to higher volumes on aircraft carriers and VCS program, offset by lower volumes on fleet support services Segment operating income and margin increased due to higher revenues and performance improvements on the VCS program in Q2 2012
Segment Revenues $1,000 $900 $800 $700 $600 $500 $400 $300 $200 $100 $0 Q2 2012 Q2 2011 $979 $872 (in millions)
Segment Operating Income $100 $80 $60 $40 $20 $0 $89 $79 Q2 2012 Q2 2011 $89 $79
(in millions)
Segment Operating Margin
12.0% 10.0% 8.0% 6.0% 4.0% 2.0% 0.0% 9.1% 9.1% Q2 2012 Q2 2011
| 6 |
|
Appendix
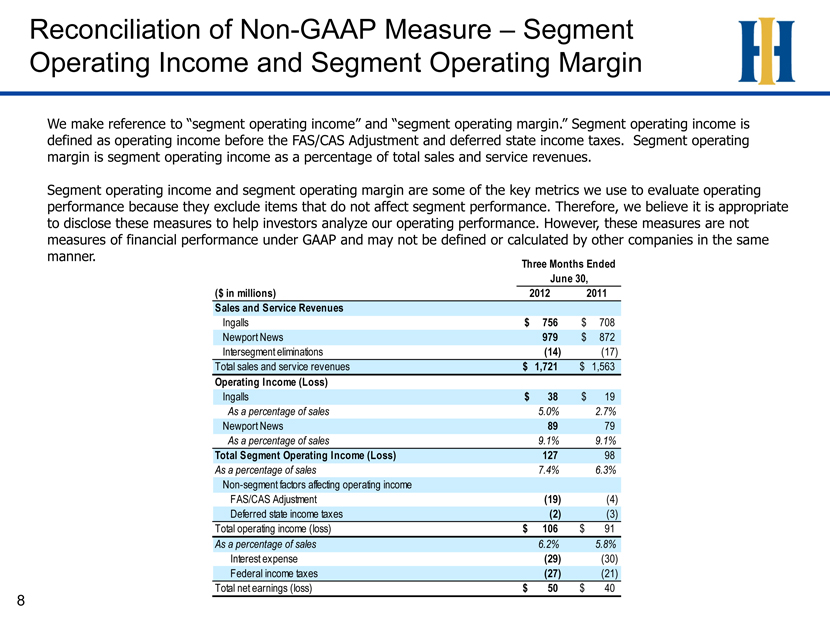
Reconciliation of Non-GAAP Measure – Segment Operating Income and Segment Operating Margin
We make reference to “segment operating income” and “segment operating margin.” Segment operating income is defined as operating income before the FAS/CAS Adjustment and deferred state income taxes. Segment operating margin is segment operating income as a percentage of total sales and service revenues.
Segment operating income and segment operating margin are some of the key metrics we use to evaluate operating performance because they exclude items that do not affect segment performance. Therefore, we believe it is appropriate to disclose these measures to help investors analyze our operating performance. However, these measures are not measures of financial performance under GAAP and may not be defined or calculated by other companies in the same manner.
Three Months Ended
June 30,
($ in millions) 2012 2011
Sales and Service Revenues
Ingalls $ 756 $ 708
Newport News 979 $ 872
Intersegment eliminations (14) (17)
Total sales and service revenues $ 1,721 $ 1,563
Operating Income (Loss)
Ingalls $ 38 $ 19
As a percentage of sales 5.0% 2.7%
Newport News 89 79
As a percentage of sales 9.1% 9.1%
Total Segment Operating Income (Loss) 127 98
As a percentage of sales 7.4% 6.3%
Non-segment factors affecting operating income
FAS/CAS Adjustment (19) (4)
Deferred state income taxes (2) (3)
Total operating income (loss) $ 106 $ 91
As a percentage of sales 6.2% 5.8%
Interest expense (29) (30)
Federal income taxes (27) (21)
Total net earnings (loss) $ 50 $ 40
| 8 |
|