Attached files
| file | filename |
|---|---|
| 8-K - FORM 8-K - HARVARD BIOSCIENCE INC | d393304d8k.htm |
 Tools to Advance Life Science Research
and Regenerative Medicine
NASDAQ HBIO
August 2012
Exhibit 99.1
Copyright © Harvard Bioscience 2012 |
 2
Safe Harbor Statement
This presentation contains forward-looking statements within the
meaning of the federal securities laws. You can identify these statements by our use of such words as “will,”
“guidance,” “objectives,”
“optimistic,” “future,” “expects,” “plans,” “estimates,” “continue,” “drive,” “strategy,” “potential,” “potentially,” “growth,”
“long-term,” “projects,” “projected,”
“intends,” “believes,” “goals,”
“sees,” “seek,” “develop,” “possible,” “new,” “emerging,” “opportunity,” “pursue” and similar expressions that do not relate to historical matters. Forward-
looking statements in this presentation may include, but are not
limited to, statements or inferences about the Company’s or management’s beliefs or expectations, the Company’s
anticipated future revenues and earnings, the strength of the
Company’s market position and business model, the impact of acquisitions or potential acquisitions, the outlook for the life
sciences industry and the field of regenerative medicine, opportunities
or potential opportunities in the field of regenerative medicine, the Company’s business strategy, the positioning of
the Company for growth, the market demand and opportunity for the
Company’s current products, or the products it is developing or intends to develop and the Company’s plans,
objectives and intentions that are not historical facts. These statements involve known and unknown risks, uncertainties and
other factors that may cause the Company’s actual results, performance or achievements to be materially
different from any future results, performance or achievements
expressed or implied by the forward-looking statements. Factors that may cause the Company’s actual results to differ
materially from those in the forward-looking statements include the
Company’s failure to identify potential acquisition candidates, successfully integrate acquired businesses or
technologies, successfully negotiate favorable pricing and other terms
with acquisition candidates to enable potential acquisitions to close, complete consolidations of business functions,
expand our distribution channels, expand our product offerings,
introduce new products or commercialize new technologies on a timely basis, including in the field of regenerative
medicine, unanticipated costs relating to acquisitions, unanticipated
costs arising in connection with the Company’s consolidation of business functions and any restructuring initiatives,
lack of demand or decreased demand for the Company’s products due
to changes in our customers’ needs, success of our efforts with our distributor to promote sales of our microvolume
spectrophotometer product and success of our strategies to increase the
sales of other products, our ability to obtain regulatory approvals, including FDA approval, for our products
including any products in the field of regenerative medicine, the
current size or anticipated size of the regenerative medicine market, the existence and size of opportunities in the
regenerative medicine market, our financial position, general economic
outlook, or other circumstances, overall economic trends, the seasonal nature of purchasing in Europe, economic,
political and other risks associated with international revenues and
operations, the impact of the current economic and financial crisis, additional costs of complying with recent changes in
regulatory rules applicable to public companies, our ability to manage
our growth, our ability to retain key personnel, competition from our competitors, technological changes resulting in
our products becoming obsolete, future changes to the operations or the
activities of our subsidiaries due to manufacturing consolidations, our ability to meet the financial covenants
contained in our credit facility, our ability to protect our
intellectual property and operate without infringing on others’ intellectual property, potential costs of any lawsuits to protect or
enforce our intellectual property, economic and political conditions
generally and those affecting pharmaceutical and biotechnology industries, research funding levels from endowments at
our university customers, impact of any impairment of our goodwill or
intangible assets, our acquisition of Genomic Solutions failing to qualify as a tax-free reorganization for federal tax
purposes, our ability to utilize deferred tax assets after the release
of our valuation allowances, the amount of earn-out consideration that the Company receives in connection with the
disposition of the Company’s Capital Equipment Business segment
and factors that may impact the receipt of this consideration, such as the revenues of the businesses disposed of, plus
factors described under the heading “Item 1A. Risk Factors”
in the Company’s Annual Report on Form 10-K for the fiscal year ended December 31, 2011, filed with the SEC on March 15,
2012 or described in the Company’s other public filings. The
Company’s results may also be affected by factors of which the Company is not currently aware. The Company may not
update these forward-looking statements, even though its situation
may change in the future, unless it has obligations under the federal securities laws to update and disclose material
developments related to previously disclosed information. Except as
otherwise noted herein, any forward looking statements represent our estimates as of August 2, 2012 and should not be
relied upon as representing our estimates as of any other date.
The Company may not update these forward-looking statements, even though its situation may change in the future, unless it
Copyright © Harvard Bioscience 2012
Tools to Advance Life Science Research and
Tools to Advance Life Science Research and
Regenerative Medicine
Regenerative Medicine
has obligations under the federal securities laws to update and
disclose material developments related to previously disclosed information. |
 3
Use Of Non-GAAP Information
In this presentation, we have included non-GAAP financial
information including adjusted operating income from continuing
operations, adjusted income from continuing operations and adjusted earnings per diluted share
from continuing operations. We believe that this non-GAAP financial
information provides investors with an enhanced understanding of
the underlying operations of the business. For the periods presented, these non-GAAP
financial measures of income have excluded certain gains and expenses
primarily resulting from business combination accounting or
events that we do not believe are related to the underlying operations of the business
such as gain from adjustment of acquisition contingencies, expenses
from amortization of intangibles related to acquisitions, fair
value adjustments of inventory and backlog related to acquisitions, asset write-down expenses,
costs related to acquisition initiatives, restructuring expenses
(including related inventory write-downs), discontinued
operations and stock-based compensation expense. They also exclude the tax effect of reconciling
items, reversal of the liability related to the uncertain tax positions
and the corresponding accrued interest, utilization of deferred
tax assets that had full valuation allowance and in the third quarter of 2010 it included the
effect of reversing valuation allowances on certain deferred tax
assets. This non-GAAP financial information approximates
information used by our management to internally evaluate the operating results of the Company.
Tabular reconciliations of our non-GAAP adjusted operating income
and adjusted net income per diluted share from continuing
operations for the periods presented to the comparable GAAP financial information is included in
this presentation in Appendices A and
B. The non-GAAP financial information provided in this presentation
should be considered in addition to, not as a substitute for,
the financial information provided and presented in accordance with GAAP.
Copyright © Harvard Bioscience 2012
Tools to Advance Life Science Research and
Tools to Advance Life Science Research and
Regenerative Medicine
Regenerative Medicine |
 4
Investment Highlights
•
2011 revenue of $109m and 35c non-GAAP EPS in Core Life Science
Research Tools (LSRT) Business:
•
Profitable, mature steady growth business.
•
$115m-$120m revenue and 39-42c EPS guidance for 2012
•
17% 14-year average revenue growth
•
12% 14-year average non-GAAP adjusted EPS growth
•
Regenerative Medicine Device (RMD) Business
•
Five patients already treated with regenerated tracheal transplants,
clinical trial begun •
Heart,
lung,
kidney
and
liver
transplant
bioreactors
in
research
stage
•
Clinical stem cell injector syringe pump will be submitted for
regulatory review this year •
Investment stage business: 13c EPS investment in 2012. Exploring
strategic alternatives for funding this at a higher level
•
We believe this nascent market could potentially grow to hundreds of
millions of dollars annually •
Commitment to Stockholder Value Creation
•
Management holds 14% of shares and beneficially owns 16% in
options •
$10m stock repurchase completed in 2010 at $3.24 per share
Copyright © Harvard Bioscience 2012
Tools to Advance Life Science Research and
Regenerative Medicine |
 IPO
MBO
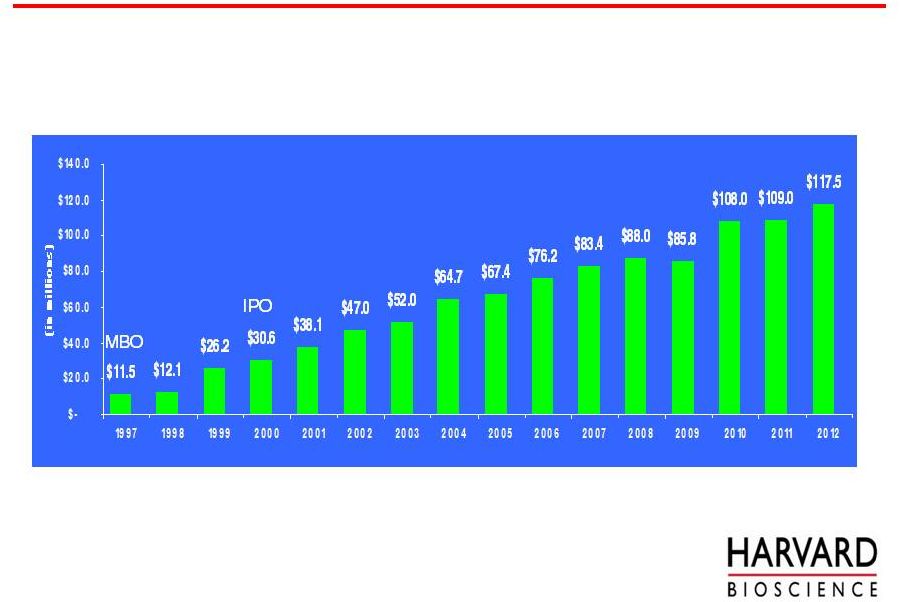
5
Core LSRT Business –
Strong, Consistent Growth
Revenue From Continuing Operations
14 year
CAGR
17%
*Est.
Copyright © Harvard Bioscience 2012
Tools to Advance Life Science Research and
Tools to Advance Life Science Research and
Regenerative Medicine
Regenerative Medicine
* The 2012 revenue estimate is the midpoint of our guidance of $115
- $120 million as of August 2, 2012 was calculated using exchange rates (USD
1.55/GBP and USD 1.25/Euro) approximating July 5, 2012 rates, excludes
any further acquisitions and assumes a continuation of the business
conditions as we see them at this time. Guidance is valid only as of
the date of issue and is not being updated to today’s date or confirmed. |
 6
Core LSRT Business -
Strong EPS Growth
Non-GAAP Adjusted Diluted EPS From
Continuing Operations
Note: See reconciliation of US GAAP diluted earnings per share to
non-GAAP adjusted diluted earnings per share in Appendix A and
Appendix B. The 2012 estimate for non-GAAP adjusted diluted EPS
from continuing operations is the midpoint of our guidance of $0.39 to
$0.42 as of August 2, 2012 and was calculated using exchange rates (USD
1.55/GBP and USD 1.25/Euro) approximating August 2, 2012 rates
and excludes further acquisitions and assumes a continuation of
the business conditions as we see them at this time. Guidance is
valid only as of
the date of issue and is not being updated to today’s date or
confirmed. MBO
IPO
GNSL
Acquired
(Divested
2007)
SOX
14 year
CAGR
12%
*Est.
Copyright © Harvard Bioscience 2012
Tools to Advance Life Science Research and
Tools to Advance Life Science Research and
Regenerative Medicine
Regenerative Medicine |
 7
Core LSRT Business Strategy
Our strategy is to have a broad range of relatively inexpensive products
that have strong positions in niche markets in life
science research:
This gives us high operating margins and low volatility
We grow through a combination of organic growth (driven by adding sales
people and launching new products) and tuck-under
acquisitions: This has given us growth through booms and
busts We improve our operations:
So we can invest in growth without decreasing margins
Copyright © Harvard Bioscience 2012
Tools to Advance Life Science Research and
Tools to Advance Life Science Research and
Regenerative Medicine
Regenerative Medicine |
 8
Core Life Science Business Has Two Divisions
Market sizes and shares are management estimates and have not been
independently verified Physiology Division
Molecular Biology Division
Business
Position:
Global market leader
Major player
Products:
Syringe pumps, isolated organ
systems, electroporators,
behavioral research products
Plastic lab consumables,
Electrophoresis products,
Spectrophotometers
Market Size:
Approx. $400m pa
Approx. $2.4bn pa
Average
Order:
Approx. $1,000
Approx. $1,000
Growth
Driver for
2012:
New products, additional sales
New products, additional sales people
The name Harvard is used under a license agreement between Harvard
Bioscience and Harvard University
Copyright © Harvard Bioscience 2012
Tools to Advance Life Science Research and
Tools to Advance Life Science Research and
Regenerative Medicine
Regenerative Medicine |
 9
Harvard Apparatus Physiology Products
Syringe Pumps
market leader
Cell & Tissue Incubators
market leader
Electroporation
strong #2 with
new technology
Neuroscience Research
Systems
Animal Ventilators
market leader
Organ Systems
market leader
Market sizes and shares are management estimates and have not been
independently verified Copyright © Harvard Bioscience 2012 Tools to Advance Life Science
Research and Tools to Advance Life Science Research and
Regenerative Medicine
Regenerative Medicine |
 10
Molecular Biology Products
Biochrom
Spectrophotometers
Market sizes and shares are management estimates and have not been
independently verified Hoefer
Electrophoresis
Denville
Pipette Tips
Copyright © Harvard Bioscience 2012
Tools to Advance Life Science Research and
Tools to Advance Life Science Research and
Regenerative Medicine
Regenerative Medicine |
 11
Acquisitions
•
Acquisitions are a core part of our growth strategy:
•
We
focus
on
“tuck-under”
acquisitions
of
product
lines
that
are
complementary to our current ones
•
Our “sweet spot”
is $3.0-$8.0 million in revenue
•
Typically below the radar of the big companies
•
Typically immediately accretive to non-GAAP adjusted EPS
•
There are usually both revenue and cost synergies
•
We have completed 25 acquisitions in 14 years. Our most recent
acquisitions were CMA Microdialysis (July 2011), AHN
Biotechnologie (February 2012) and Modular SFC (May 2012).
Copyright © Harvard Bioscience 2012
Tools to Advance Life Science Research and
Tools to Advance Life Science Research and
Regenerative Medicine
Regenerative Medicine |
 12
•
Recent improvements:
•
Panlab and Coulbourn were restructured in Q1 2012
•
Hoefer’s San Francisco, CA facility was relocated in Q4 2011
Operational Improvement
Copyright © Harvard Bioscience 2012
Tools to Advance Life Science Research and
Tools to Advance Life Science Research and
Regenerative Medicine
Regenerative Medicine |
 13
Base Business EPS Growth Model –
3-5 Year Plan
Organic Growth
3-7%
+
Tuck under Acquisitions
10-15%
+
Operational Improvements
0-5%
=
Total Expected Average EPS Growth
15-20%
Copyright © Harvard Bioscience 2012
Tools to Advance Life Science Research and
Tools to Advance Life Science Research and
Regenerative Medicine
Regenerative Medicine |
 Regenerative
Technology for Saving Lives |
 15
Mr. Beyene is
alive and well
at 12
months**
Mr. Lyles
died of
pneumonia at
3.5 months..
Ms. Castillo is
alive and well at
4 years*
Hannah
Warren’s
surgery has
been approved
by the FDA
Ms. Tuulik is
alive and well
at 1 month
Mr. Zozula is
alive and well
at 1 month
Clinical Success with Regenerated Tracheas
Copyright © Harvard Bioscience 2012
Tools to Advance Life Science Research and
Tools to Advance Life Science Research and
Regenerative Medicine
Regenerative Medicine
*
Clinical
transplantation
of
a
tissue
engineered
airway,
Macchiarini
et
al,
The
Lancet,
November 19
th
2008
**
Tracheobronchial transplantation with a stem-cell-seeded
bioartificial nanocomposite: a
proof-of-concept
study.
Macchiarini
et
al.,
The
Lancet,
November
25
th
2011.
If patients continue to do well we will have a cure for tracheal
cancer. |
 The
Patient
was
“condemned
to
die”-
Dr.
Macchiarini
16
The patient and Prof. Macchiarini before
the surgery
CAT scan used to make the
scaffold. The 6cm tumor is in
green
The scaffold prior to seeding
with bone marrow stem cells
Seeding the cells in the
InBreath bioreactor
The seeded graft after 2 days of
culture
Mr. Beyene
after the
surgery
Copyright © Harvard Bioscience 2012
Tools to Advance Life Science Research and
Tools to Advance Life Science Research and
Regenerative Medicine
Regenerative Medicine |
 The InBreath
Bioreactor System 17
Inbreath and vented culture lid
Inbreath and sealed sterile transport lid
Inbreath inside sterile transport box
Sterile transport box
Non-sterile thermally insulated outer
transport box.
Copyright © Harvard Bioscience 2012
Tools to Advance Life Science Research and
Tools to Advance Life Science Research and
Regenerative Medicine
Regenerative Medicine |
 18
Save lives
Target life threatening conditions like tracheal and esophageal cancer,
and transplants for heart, lung, liver and kidney. Not low medical
value skin, bone or muscle. Easier to get ethics committee (IRB)
and regulatory (Humanitarian Use Device) approval for
first-in-man, greatly reducing clinical trial risk and
cost. High medical value and higher cost alternatives (donor organs
and cancer therapeutics) create high per procedure revenue
potential. Medical devices, not cell therapy
Easier, less expensive regulatory pathway.
Bioreactors are 510k exempt, injectors are 510k and scaffolds (for
tracheal cancer) are orphan device PMA.
Collaborate with the best
Prof. Macchiarini at the Karolinska Institutet is our key clinical
collaborator. Dr. Harald Ott at Massachusetts General Hospital is a
key research collaborator. We have several other research
collaborators at leading universities/hospitals. Capital
efficient Investigator led first-in-man and clinical trials
greatly reduces clinical trial cost. Revenue from 510k approved
injectors creates early cash flow. Regenerative Medicine Strategy
Copyright © Harvard Bioscience 2012
Tools to Advance Life Science Research and
Tools to Advance Life Science Research and
Regenerative Medicine
Regenerative Medicine |
 19
Tracheal Cancer –
Possible Pricing Levels
Approaches to pricing organ regeneration products:
1. avoided cost of donor organ procurement
$40-90k
2. price of cancer therapeutics*
Yervoy for melanoma
$120k per patient
Zelboraf for melanoma
$56k per treatment
Adcetris for lymphoma
$120k per patient
Hence, a price in the $50k per procedure range would likely be attractive
to payors and sustainable in the long term
* These treatments typically extend life by several months. While we do
not yet have statistically robust data, Mr. Beyene
is
alive
and
well
at
13
months
post
surgery
and
Mr.
Lyles
died
at
3.5
months
post
surgery.
Ms.
Castillo
is
alive
and
well
at
over
4
years
post
surgery
but
she
was
treated
for
an
occlusion
in
her
left
main
bronchus,
not
tracheal
cancer.
The two Russian patients had tracheal trauma and are alive and well at
1 month. Copyright © Harvard Bioscience 2012
Tools to Advance Life Science Research
and Regenerative Medicine |
 20
The lungs were regenerated in a Harvard Apparatus LB2 lung bioreactor.
The work was done at Massachusetts General Hospital in
collaboration with Dr. Harald Ott*. The regenerated transplanted
lungs showed near normal lung function, exchanging carbon dioxide
and oxygen and showing near normal pressure/volume loops. The rats
lived for 14 days off the ventilator before they were sacrificed
for research. Natural lung
Regenerated lung
Pre-clinical Success with Regenerated Lungs
Copyright © Harvard Bioscience 2012
Tools to Advance Life Science Research and
Tools to Advance Life Science Research and
Regenerative Medicine
Regenerative Medicine
Medicine,
July13th 2010
* Regeneration and orthotopic transplantation of a bioartificial lung.
Ott et al, Nature |
 Product Stage
by Clinical Indication 21
Development
Pre-Clinical
First-in-man
Tracheal Cancer
Kidney Transplant
Liver Transplant
Heart Transplant
Lung Transplant
Esophageal Cancer
Clinical Trial
Copyright © Harvard Bioscience 2012
Tools to Advance Life Science Research and
Tools to Advance Life Science Research and
Regenerative Medicine
Regenerative Medicine |
 Revenue
Opportunity 22
Clinical
Patients
Market
Indication:
per year:
Potential:
Trachea (cancer/trauma)
3,000
$150m
Esophagus (cancer)
40,000
$2,000m
Heart and lung (transplant)
12,000*
$600m
*The
12,000
procedures
does
not
account
for
patients
currently
on
the
waiting
list
due
to
a
lack
of
donor organs.
Copyright © Harvard Bioscience 2012
Tools to Advance Life Science Research and
Tools to Advance Life Science Research and
Regenerative Medicine
Regenerative Medicine |
 23
Harvard Apparatus research
syringe pump being used to
inject stem cells into a heart
infarct –
the inspiration for our
clinical stem cell injector.
Prototype of the clinical version which we expect to
submit to the regulatory agencies in 2012. The market
for high end clinical syringe pumps is approx. $80m per
year
Stem Cell Therapy Injector
Copyright © Harvard Bioscience 2012
Tools to Advance Life Science Research and
Tools to Advance Life Science Research and
Regenerative Medicine
Regenerative Medicine
Photo courtesy Brigham and Womens’ Hospital, Boston |
 24
Commitment To Stockholder Value
•
Management holds approximately 14% of shares + 16% in options
•
We believe tuck-under growth strategy can be financed with cash,
cash flow and credit line, therefore no dilution
•
Modest debt leverage helps drive EPS without undue financial risk
•
$10m stock repurchase completed. 3.1m shares (approx. 10% of shares
outstanding) bought at an average price of $3.24 per share
•
Pursuing strategic alternatives to fund the Regenerative Medicine
Devices business
-
Accelerates maximizing revenue potential
-
Provides clarity on profitability of core LSRT business
Copyright © Harvard Bioscience 2012
Tools to Advance Life Science Research and
Tools to Advance Life Science Research and
Regenerative Medicine
Regenerative Medicine |
 25
Investment Highlights
•
2011 revenue of $109m and 35c non-GAAP EPS in Core Life Science
Research Tools (LSRT) Business:
•
Profitable, mature steady growth business.
•
$115m-$120m revenue and 39-42c EPS guidance for 2012
•
17% 14-year average revenue growth
•
12% 14-year average non-GAAP adjusted EPS growth
•
Regenerative Medicine Device (RMD) Business
•
Five patients already treated with regenerated tracheal transplants,
clinical trial begun •
Heart,
lung,
kidney
and
liver
transplant
bioreactors
in
research
stage
•
Clinical stem cell injector syringe pump will be submitted for
regulatory review this year •
Investment stage business: 13c EPS investment in 2012. Exploring
strategic alternatives for funding this at a higher level
•
We believe this nascent market could potentially grow to hundreds of
millions of dollars annually •
Commitment to Stockholder Value Creation
•
Management holds 14% of shares and beneficially owns 16% in
options •
$10m stock repurchase completed in 2010 at $3.24 per share
Copyright © Harvard Bioscience 2012
Tools to Advance Life Science Research and
Tools to Advance Life Science Research and
Regenerative Medicine
Regenerative Medicine |
 NASDAQ
HBIO Tools to Advance Life Science Research
and Regenerative Medicine
Additional Information
Copyright © Harvard Bioscience 2012
|
 27
Appendix A
Copyright © Harvard Bioscience 2012
Tools to Advance Life Science Research and
Regenerative Medicine
1997
1998
1999
2000 (IPO)
2001
2002
2003
2004
2005
2006
2007
2008
2009
2010
2011
Revenues
11,464
$
12,154
$
26,178
$
30,575
$
38,088
$
47,009
$
52,024
$
64,745
$
67,431
$
76,181
$
83,407
$
88,049
$
85,772
$
108,179
$
108,864
$
Revenue fourteen -year compound annual growth rate from 1997 to
2011: 17.0% Reconciliation of US GAAP to Non-GAAP
Adjusted: 1997
1998
1999
2000
2001
2002
2003
2004
2005
2006
2007
2008
2009
2010
2011
US GAAP operating income (loss)
2,119
$
2,412
$
1,196
$
(10,438)
$
3,112
$
5,425
$
7,173
$
8,384
$
7,924
$
8,690
$
9,533
$
8,479
$
8,055
$
10,218
$
6,077
$
Restructuring and severance related expenses
-
-
-
-
-
474
-
-
302
-
-
1,771
516
498
640
Inventory write-down due to restructuring
-
-
-
-
-
-
-
-
-
-
-
252
159
79
-
Stock-based compensation expense
-
-
3,284
14,676
2,656
1,269
519
69
-
1,934
2,335
2,003
2,514
2,756
2,863
In-process research and development expense
-
-
-
-
159
-
-
-
-
-
-
-
-
-
-
Amortization of intangible assets
-
27
368
604
956
595
891
1,582
1,664
1,697
1,824
1,966
1,844
2,364
2,746
Fair value adjustments to costs of product sales
-
-
-
-
-
-
336
258
-
50
61
-
-
90
76
Accounts receivable reserve adjustment related to acquistion
-
-
-
-
-
-
-
-
-
-
-
-
-
(237)
-
Non-GAAP adjusted operating income
2,119
$
2,439
$
4,848
$
4,842
$
6,883
$
7,763
$
8,919
$
10,293
$
9,890
$
12,371
$
13,753
$
14,471
$
13,088
$
15,768
$
12,402
$
1997
1998
1999
2000
2001
2002
2003
2004
2005
2006
2007
2008
2009
2010
2011
US GAAP earnings (loss) per diluted share from continuing
operations 0.06
$
0.01
$
(5.25)
$
(6.23)
$
0.07
$
0.11
$
0.12
$
0.15
$
0.20
$
0.21
$
0.24
$
0.17
$
0.24
$
0.65
$
0.13
$
Restructuring and severance related expenses
-
-
-
-
-
0.02
-
-
0.01
-
-
0.06
0.02
0.02
0.03
Inventory write-down due to restructuring
-
-
-
-
-
-
-
-
-
-
-
0.01
0.01
-
-
Stock-based compensation expense
-
-
0.19
0.80
0.10
0.05
0.02
-
-
0.06
0.07
0.06
0.08
0.09
0.10
In-process research and development expense
-
-
-
-
0.01
-
-
-
-
-
-
-
-
-
-
Amortization of intangible assets
-
-
0.02
0.03
0.04
0.02
0.03
0.05
0.05
0.05
0.06
0.06
0.06
0.08
0.09
Fair value adjustments to costs of product sales
-
-
-
-
-
-
0.01
0.01
-
-
-
-
-
-
-
Asset write-down
-
-
-
-
-
-
-
-
-
-
-
0.02
-
-
-
Direct acquisition cots
-
-
-
-
-
-
-
-
-
-
-
0.01
0.01
0.01
0.02
Gain from adjustment of acquisition contingencies
-
-
-
-
-
-
-
-
-
-
-
-
(0.09)
(0.01)
-
Common stock warrant interest expense
0.01
0.09
1.74
2.00
-
-
-
-
-
-
-
-
-
-
-
Income taxes
-
-
(0.08)
0.01
(0.03)
(0.01)
(0.01)
(0.02)
(0.07)
(0.06)
(0.07)
(0.07)
(0.03)
(0.47)
(0.09)
Conversion of convertible preferred stock and exercise of
common stock warrants on January 1
-
-
3.55
3.54
-
-
-
-
-
-
-
-
-
-
-
Accounts receivable reserve adjustment related to acquistion
-
-
-
-
-
-
-
-
-
-
-
-
-
(0.01)
0
Non-GAAP adjusted earnings per diluted share from continuing
operations
0.07
$
0.10
$
0.17
$
0.15
$
0.19
$
0.19
$
0.17
$
0.19
$
0.19
$
0.26
$
0.30
$
0.32
$
0.30
$
0.36
$
0.28
$
For the years ended December 31,
For the years ended December 31,
For the years ended December 31,
Non-GAAP fourteen -year operating income from continuing
operations compound annual growth rate from 1997 to 2011: 14.0% |
 28
Appendix B
US GAAP operating income
8,479
$
8,055
$
2,976
$
2,372
$
1,943
$
2,927
$
1,950
$
2,519
$
220
$
1,387
$
1,229
$
1,299
$
Restructuring and severance related expenses
1,771
516
-
-
283
215
-
(28)
477
167
150
(13)
Inventory write-down due to
restructuring 252
159
-
-
-
79
-
-
-
-
-
-
Stock-based compensation
expense 2,003
2,514
558
675
759
764
552
658
853
800
697
718
Amortization of intangible
assets 1,966
1,844
531
578
593
662
621
689
706
730
678
712
Fair value adjustments to costs
of product sales -
-
-
-
27
63
-
-
57
19
36
39
Accounts receivable
reserve adjustment related to acquistion -
-
-
-
-
(237)
-
-
-
-
-
-
Non-GAAP adjusted operating income from
continuing operations 14,471
$
13,088
$
4,065
$
3,625
$
3,605
$
4,473
$
3,123
$
3,838
$
2,313
$
3,103
$
2,790
$
2,755
$
US GAAP earnings per diluted share from continuing operations
0.17
$
0.24
$
0.07
$
0.06
$
0.44
$
0.08
0.06
$
0.05
$
-
$
0.02
$
0.02
$
0.03
$
Restructuring and severance related expenses
0.06
0.02
-
-
0.01
0.01
-
-
0.02
-
0.01
-
Inventory write-down due to
restructuring 0.01
0.01
-
-
-
-
-
-
-
-
-
-
Stock-based compensation
expense 0.06
0.08
0.02
0.02
0.03
0.03
0.02
0.02
0.03
0.03
0.02
0.02
Amortization of goodwill &
intangibles* 0.06
0.06
0.02
0.02
0.02
0.02
0.02
0.02
0.02
0.02
0.02
0.02
Inventory amortization on
acquisition -
-
-
-
0.01
-
-
-
-
-
-
-
Asset write-down
0.02
-
-
-
-
-
-
-
-
-
-
-
Direct acquisition cots
0.01
0.01
-
-
0.01
-
-
0.01
-
0.01
0.01
-
Gain from adjustment of
acquisition contingencies -
(0.09)
-
(0.01)
-
-
-
-
-
-
-
-
Income taxes (1)
(0.07)
(0.03)
(0.02)
(0.02)
(0.44)
(0.02)
(0.03)
(0.02)
(0.02)
(0.01)
(0.02)
(0.01)
Accounts receivable reserve adjustment related to
acquistion -
-
-
-
-
(0.01)
-
-
-
-
-
-
Non-GAAP adjusted earnings per diluted share
from continuing operations
0.32
$
0.30
$
0.09
$
0.08
$
0.08
$
0.11
$
0.07
$
0.08
$
0.05
$
0.07
$
0.06
$
0.06
$
* Due to rounding, quarterly numbers do not add to total year
(1) Income taxes includes the tax effect of adjusting for the
reconciling items, utilization of certain deferred tax assets that had a full valuation allowance and in the third quarter of 2010 it included the effect
of reversing valuation allowances on certain deferred tax assets as a
reconciling item. It also includes the tax effect from the reversal of the liability related to the uncertain tax positions and the
corresponding accrued interest.
March 31,
June 30,
Sept 30,
Dec 31,
March 31,
June 30,
Sept 30,
Dec 31,
March 31,
June 30,
2008
2009
2010
2010
2010
2010
2011
2011
2011
2011
2012
2012
Revenues
88,049
$
85,772
$
26,300
$
25,905
$
26,453
$
29,521
$
26,312
$
27,143
$
26,381
$
29,027
$
28,322
$
28,496
$
For the years ended
For the quarters ended
Reconciliation of US GAAP to Non-GAAP Adjusted:
Copyright © Harvard Bioscience 2012
Tools to Advance Life Science Research and
Tools to Advance Life Science Research and
Regenerative Medicine
Regenerative Medicine |
 29
Appendix C
Low
Estimate
High
Estimate
Low
Estimate
High
Estimate
Non-GAAP adjusted diluted earnings per common share
from continuing operations (A)
$
0.05
(a)
$
0.07
(b)
$
0.26
(c)
$
0.29
(d)
Less the impact of:
Amortization of intangible assets
(0.02)
(e)
(0.02)
(e)
(0.09)
(e)
(0.09)
(e)
Stock-based compensation (FASB ASC Topic 718)
(0.03)
(e)
(0.03)
(e)
(0.10)
(f)
(0.10)
(f)
Tax
(B)
0.02
(e)
0.02
(e)
0.06
(e)
0.06
(e)
GAAP diluted earnings per common share from
continuing operations (A)
$
0.02
$
0.04
$
0.13
$
0.16
Reconciliation of Guidance for Non-GAAP Adjusted Diluted Earnings per
Common Share From Continuing Operations to US GAAP Diluted Earnings
per Common Share (unaudited)
Three Months Ending
September 30, 2012
Year Ending
December 31, 2012
(e)-
Represents amounts related to Life Science Research Tools
business (f) -
Includes expense of $0.09 from Life Science Research Tools business
and $0.01 from Regenerative Medicine Device business. B
-
Includes the tax impact of above mentioned items.
(b) -
Includes income of $0.10 from Life Science Research Tools business and
loss of $0.03 from Regenerative Medicine Device business.
(c) -
Includes income of $0.39 from Life Science Research Tools business and
loss of $0.13 from Regenerative Medicine Device business.
(d) -
Includes income of $0.42 from Life Science Research Tools business and
loss of $0.13 from Regenerative Medicine Device business.
(a) -
Includes income of $0.09 from Life Science Research Tools business and
loss of $0.04 from Regenerative Medicine Device business.
A
-
Assumes no additional acquisitions.
Copyright © Harvard Bioscience 2012
Tools to Advance Life Science Research and
Regenerative Medicine |
 30
Appendix D
For
the
Year
For
the
Year
Six
Months
Ended
March
31,
June
30,
Sept.
30,
Dec.
31,
Dec.
31,
March
31,
June
30,
Sept.
30,
Dec. 31,
Dec.
31,
March
31,
June
30,
June 30,
2010
2010
2010
2010
2010
2011
2011
2011
2011
2011
2012
2012
2012
Organic growth
4.3%
11.0%
4.6%
6.8%
6.1%
-2.1%
-1.6%
-6.3%
-4.4%
-3.8%
4.2%
2.2%
3.2%
Acquisitions
29.9%
36.1%
24.7%
2.3%
21.5%
1.3%
2.8%
4.2%
2.9%
2.9%
4.4%
4.9%
4.7%
Foreign
exchange effect
3.7%
-3.6%
-3.3%
-2.3%
-1.5%
0.9%
3.6%
1.8%
-0.2%
1.5%
-1.0%
-2.1%
-1.6%
Total revenue
growth
37.9%
43.5%
26.0%
6.8%
26.1%
0.1%
4.8%
-0.3%
-1.7%
0.6%
7.6%
5.0%
6.3%
Three Months
Ended
Reconciliation of Changes In Total Revenue Compared to the Same Period
of the Prior Year (Continuing Operations) (unaudited)
Three Months Ended
Three Months Ended
Copyright © Harvard Bioscience 2012
Tools to Advance Life Science Research and
Tools to Advance Life Science Research and
Regenerative Medicine
Regenerative Medicine |