Attached files
| file | filename |
|---|---|
| 8-K - FORM 8-K - Carlyle Group Inc. | d392253d8k.htm |
Exhibit 99.1

For Immediate Release
August 8, 2012
The Carlyle Group Announces Second Quarter 2012 Earnings Results
| • | Strong pace of realizations continues with $3.0 billion in realized proceeds generated for fund investors in 2Q 2012 |
| • | Distributable Earnings of $115 million, up 29% year over year |
| • | $0.32 per common unit in pro forma Distributable Earnings in 2Q 2012 |
| • | Declare first quarterly distribution of $0.11 per unit to common unit holders |
| • | $3.9 billion in funds raised in 2Q and $6.0 billion raised year to date |
| • | $1.4 billion in equity invested in 2Q with new deal acceleration in July |
| • | U.S. GAAP net loss attributable to The Carlyle Group L.P. of ($10) million, or a loss of ($0.26) per common unit; ($14.0) million net loss on a pro forma basis, or a loss of ($0.39) per common unit |
Washington, DC – Global alternative asset manager The Carlyle Group L.P. (NASDAQ: CG), today reported its unaudited second quarter 2012 results.
David M. Rubenstein, Co-Chief Executive Officer of Carlyle, said, “Our firm, portfolio and funds are in very good shape, despite a quarter marked by significant volatility in global equity markets and continued uncertainty in Europe. Distributable earnings, the metric that we believe best represents the results of our long term approach to value creation, was $785 million over the last twelve months, a 39% increase over the prior LTM period of $567 million. The nearly $4 billion in new capital we raised this quarter reflects the expected pick-up in fundraising as our sixth U.S. buyout fund began to close on new commitments.”
William E. Conway, Jr., Co-Chief Executive Officer of Carlyle, said, “We deployed $1.4 billion across our portfolio in the second quarter, and since the beginning of July we have agreed to invest a
Page | 1
minimum of $1.6 billion in new transactions that are expected to close in coming quarters. We have made some of our best investments during uncertain times, and our recent investments reflect the choice opportunities we see today as well as our long-term investment horizon. Additionally, we realized $3 billion in proceeds from 32 carry funds for our fund investors, a strong pace that reflects our diverse global platform.”
U.S. GAAP results for the second quarter 2012 included income before provision for income taxes of $186 million and a net loss attributable to The Carlyle Group L.P. of ($10) million, or a loss of ($0.26) per common unit. For the second quarter 2011, Carlyle was still a private partnership, and income before provision for income taxes was $317 million and net income attributable to Carlyle Holdings was $372 million. Total revenue was $248 million, compared with $756 million in the second quarter 2011. Pro forma net loss per common unit was ($0.39) for the second quarter 2012. Total balance sheet assets were $29.6 billion as of June 30, 2012 compared with $24.7 billion as of December 31, 2011.
Second Quarter Distribution
The Board of Directors has declared a quarterly distribution of $0.11 to common unit holders of record at the close of business on August 20, 2012, payable on August 31, 2012. The $0.11 per common unit distribution is a prorated amount based on the pricing of The Carlyle Group L.P.’s initial public offering, which occurred on May 2, 2012.
Carlyle intends to distribute $0.16 per quarter to common unit holders in each of the first three quarters of the calendar year, with a catch-up distribution announced with its fourth quarter earnings release. As noted in Carlyle’s Registration Statement on Form S-1, Carlyle intends to make the year-end catch up distribution in an amount that, taken together with the other quarterly distributions, represents substantially all of its Distributable Earnings in excess of the amount determined by the General Partner to be necessary or appropriate to provide for the conduct of its business, to make appropriate investments in its business and its funds or to comply with applicable law or any of its financing agreements. Carlyle anticipates that the aggregate amount of its distributions for most years will be less than its total Distributable Earnings for that year. The declaration and payment of any distribution is at the sole discretion of the General Partner, which may change the distribution policy at any time.
Page | 2
The Carlyle Engine
Carlyle evaluates the performance of its business on four key metrics, known as the Carlyle engine (capital raised, equity invested, fund valuations and proceeds realized for fund investors). The table below highlights the results of those metrics for the second quarter, as well as on a year-to-date (YTD) and last twelve months (LTM) basis.
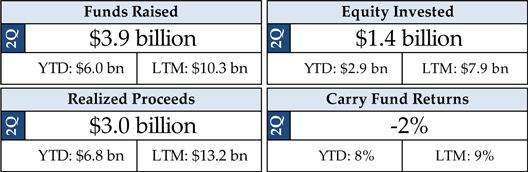
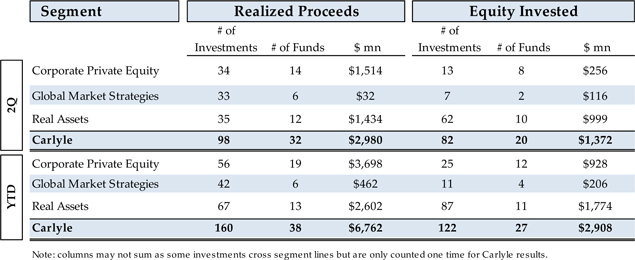
During the second quarter of 2012, Carlyle generated net proceeds of $3.0 billion arising from 98 different investments across 32 carry funds in its portfolio. Carlyle deployed $1.4 billion of equity in 2Q 2012 in 82 new or follow on investments across 20 carry funds. In addition, thus far in the third quarter Carlyle has committed to invest, at a minimum, an incremental $1.6 billion in equity across six new pending transactions that should close in the coming months.
Page | 3
Carlyle All Segment Results for Second Quarter 2012
| • | Distributable Earnings (DE): $115 million |
| • | On a pro-forma basis, pre-tax Distributable Earnings of $117 million and $0.32 per unit on a post-tax basis, compared to $189 million and $0.57 per unit, respectively, in 1Q 2012, taking into consideration changes related to the Initial Public Offering. |
| • | Fee-Related Earnings of $36 million increased 16% from $31 million in 2Q 2011 as fund management fees revenue increased while direct compensation increased at a slower pace. |
| • | Net Realized Performance Fees of $76 million increased 43% from $53 million in 2Q 2011, and were positively impacted by public equity exits in Kinder Morgan and Triumph Group. Some of the proceeds returned to fund investors during 2Q 2012 were in funds not currently realizing performance fees. |
| • | Realized Investment Income of $4 million was down from $6 million in 2Q 2011. |
| • | Economic Net Income/(Loss) (ENI): ($57) million |
| • | On a pro forma basis, Carlyle generated a pre-tax ENI loss of ($59) million, or a loss per unit of ($0.19) on a post-tax basis compared with ENI of $401 million, or $1.10 per unit in 1Q 2012, adjusting for the impact of our IPO. |
| • | Economic Net Income was negatively impacted by 2% depreciation in Carlyle’s carry fund portfolio, which excludes CLOs, hedge funds and Fund of Funds Solutions Vehicles, during 2Q 2012, with increases in Real Estate and Global Market Strategies funds, offset by decreases in Energy and Buyout funds. |
| • | Net performance fees of ($107) million were lower compared to $191 million in 2Q 2011. Year-to-date, net performance fee revenue of $228 million was 64% lower than the comparable 2011 period due to a net increase in our carry funds of 8% YTD 2012. |
| • | In general, the private portfolio was relatively flat while the public portfolio was down 10% in 2Q 2012. |
| • | As a result, Corporate Private Equity Funds and Energy Funds, which have a greater public company composition, experienced larger declines in valuation as compared to those funds with a greater percentage of investments in private companies. |
| Carlyle Group - All Segments |
Period | LTM | % Change | |||||||||||||||||||||||||||||||||
| $ in millions, except where noted | 2Q2011 | 3Q2011 | 4Q2011 | 1Q2012 | 2Q2012 | 3Q11 - 2Q12 | QoQ | YoY | YTD | |||||||||||||||||||||||||||
| Revenues |
595 | (263 | ) | 666 | 894 | 61 | 1,357 | (93 | %) | (90 | %) | (45 | %) | |||||||||||||||||||||||
| Expenses |
359 | (72 | ) | 411 | 501 | 119 | 959 | (76 | %) | (67 | %) | (37 | %) | |||||||||||||||||||||||
|
|
|
|
|
|
|
|
|
|
|
|
|
|
|
|
|
|
|
|||||||||||||||||||
| Economic Net Income |
237 | (191 | ) | 254 | 392 | (57 | ) | 398 | (115 | %) | (124 | %) | (57 | %) | ||||||||||||||||||||||
|
|
|
|
|
|
|
|
|
|
|
|
|
|
|
|
|
|
|
|||||||||||||||||||
| Fee-Related Earnings |
31 | 37 | 14 | 34 | 36 | 120 | 4 | % | 16 | % | (2 | %) | ||||||||||||||||||||||||
|
|
|
|
|
|
|
|
|
|
|
|
|
|
|
|
|
|
|
|||||||||||||||||||
| Net Performance Fees |
191 | (223 | ) | 223 | 335 | (107 | ) | 228 | (132 | %) | (156 | %) | (64 | %) | ||||||||||||||||||||||
|
|
|
|
|
|
|
|
|
|
|
|
|
|
|
|
|
|
|
|||||||||||||||||||
| Net Realized Performance Fees |
53 | 194 | 216 | 143 | 76 | 629 | (47 | %) | 43 | % | (18 | %) | ||||||||||||||||||||||||
|
|
|
|
|
|
|
|
|
|
|
|
|
|
|
|
|
|
|
|||||||||||||||||||
| Distributable Earnings |
89 | 244 | 247 | 179 | 115 | 785 | (36 | %) | 29 | % | (21 | %) | ||||||||||||||||||||||||
|
|
|
|
|
|
|
|
|
|
|
|
|
|
|
|
|
|
|
|||||||||||||||||||
| Total Assets Under Management ($ billion) |
108.0 | 148.6 | 147.0 | 159.2 | 156.2 | (2 | %) | 45 | % | |||||||||||||||||||||||||||
|
|
|
|
|
|
|
|
|
|
|
|
|
|
|
|||||||||||||||||||||||
| Fee-Earning Assets Under Management ($ billion) |
80.3 | 112.6 | 111.0 | 117.0 | 112.0 | (4 | %) | 39 | % | |||||||||||||||||||||||||||
|
|
|
|
|
|
|
|
|
|
|
|
|
|
|
|||||||||||||||||||||||
|
|
|
|||||||||||||||||||||||||||||||||||
Note: Totals may not sum due to rounding.
Page | 4
Assets Under Management and Remaining Fair Value of Capital
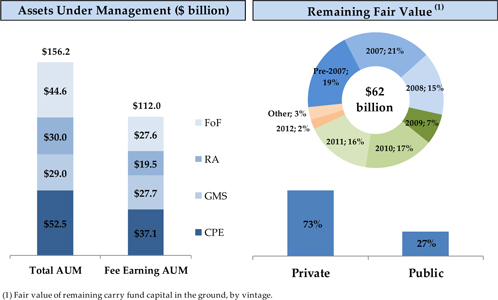
| • | Total Assets Under Management: $156.2 billion |
| • | Changes versus 1Q 2012: Net Distributions (-$4.8 billion), Foreign Exchange impact (-$2.0 billion), new capital commitments (+$2.7 billion), hedge fund subscriptions (+$659 million), and market appreciation (+$557 million). Strong market appreciation recorded for Fund of Funds owes to its standard one quarter lag on reporting market appreciation. |
| • | Increases versus 2Q 2011 were primarily due to acquisitions over the past 12 months. |
| • | Dry Powder: $40.0 billion: CPE ($15.3 billion), Global Market Strategies ($1.3 billion), Real Assets ($7.1 billion), and Fund of Funds Solutions ($16.4 billion). |
| • | Fee-Earning Assets Under Management: $112.0 billion |
| • | Changes versus 1Q 2012: Net Distributions and Outflows (-$5.8 billion), foreign exchange impact (-$2.1 billion), fee earning asset inflows (+$1.6 billion), and hedge fund subscriptions (+$654 million). |
| • | Increases versus 2Q 2011 were primarily due to acquisitions over the past 12 months. |
| • | New funds raised in Carlyle Partners VI will not increase Fee-Earning AUM until the predecessor fund (Carlyle Partners V) is substantially invested. |
| • | Remaining Fair Value of Capital (carry funds only): $62 billion |
| • | Changes versus 1Q 2012: Equity invested (+$1.4 billion), Distributions (-$4.2 billion), and Market Depreciation (-2%). |
| • | The current MOIC of remaining fair value of capital is 1.25x. |
| • | 55% of remaining fair value of capital in the ground is in investments made in 2008 or earlier. |
| • | The AUM in-carry ratio as of the second quarter end was 65%. |
| • | In addition, Carlyle and its partners manage $9.6 billion in hedge fund net assets. |
Page | 5
Pro Forma Operating Results
On a pro forma basis, taking into consideration changes related to the IPO, Carlyle’s non-GAAP results for the second quarter 2012 are provided in the table below:
Carlyle Group Pro Forma Summary
$ in millions, except per unit amounts
| Economic Net income |
Second Quarter 2012 | |||
| Economic Net Income (pre-tax) |
$ | (58.9 | ) | |
| Less (Add): Provision (Benefit) for Income Taxes(1) |
(1.2 | ) | ||
|
|
|
|||
| Pro Forma Economic Net Income, After Taxes |
(57.7 | ) | ||
|
|
|
|||
| Fully diluted units (in millions) |
304.5 | |||
| Pro Forma Economic Net Income, After Taxes per Adjusted Unit |
$ | (0.19 | ) | |
| Distributable Earnings |
||||
| Pro Forma Distributable Earnings |
$ | 116.7 | ||
| Less: Estimated foreign, state, and local taxes(2) |
14.8 | |||
|
|
|
|||
| Pro Forma Distributable Earnings, After Taxes |
101.9 | |||
|
|
|
|||
| Allocating Distributable Earnings for only public unit holders of The Carlyle Group L.P. |
||||
| Pro Forma Distributable Earnings to The Carlyle Group L.P. |
14.5 | |||
| Less: Estimated current corporate income taxes(3) |
0.8 | |||
|
|
|
|||
| Pro Forma Distributable Earnings to The Carlyle Group L.P. net of corporate income taxes |
13.7 | |||
|
|
|
|||
| Units in public float (in millions) |
43.2 | |||
| Pro Forma Distributable Earnings, net, per The Carlyle Group L.P. common unit outstanding |
$ | 0.32 | ||
|
|
|
|||
| (1) | Represents the implied provision for income taxes that was calculated using a similar methodology applied in calculating the pro forma tax provision for The Carlyle Group L.P., without any reduction for noncontrolling interests. |
| (2) | Represents the implied provision for current income taxes that was calculated using a similar methodology applied in calculating the pro forma current tax provision for The Carlyle Group L.P., without any reduction for noncontrolling interests. |
| (3) | Represents pro forma current corporate income taxes payable upon distributable earnings allocated to Carlyle Holdings I GP Inc. |
Page | 6
Corporate Private Equity (CPE)

| • | Distributable Earnings (DE): $61 million. The following components impacted Distributable Earnings in the quarter: |
| • | Fee Related Earnings of $10 million declined from $20 million in 2Q 2011 as fund management fees and portfolio advisory fee revenue were modestly lower compared to the second quarter of 2011. |
| • | Net Realized Performance Fees of $50 million increased from $19 million in 2Q 2011 as CPE funds were able to exit a number of positions in funds generating realized carry. |
| • | Realized Investment Income of $2 million compared to $0 in 2Q 2011. |
| • | Economic Net Income (ENI): ($65) million |
| • | CPE carry funds valuations declined 2% in 2Q 2012, which drove negative economic net income in the CPE segment. |
| • | Net performance fees of ($80) million compared to $135 million in 2Q 2011, driven by the decline in the CPE carry funds. |
| • | Assets Under Management: $52.5 billion |
| • | Total AUM declined 1% versus 1Q 2012 while Fee-Earning AUM of $37.1 billion fell 2% versus 1Q 2012. |
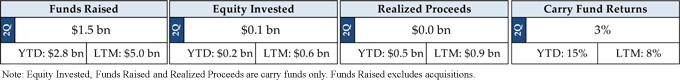
| • | Funds Raised of $2.4 billion was driven by the first close in Carlyle Partners VI. Year-to-date, funds raised of $2.7 billion compares to $0.8 billion in the first half of 2011. |
| • | New funds raised in Carlyle Partners VI will not increase Fee-Earning AUM until the predecessor fund (Carlyle Partners V) is substantially invested. |
| Corporate Private Equity (Actual results) |
Period | LTM | % Change | |||||||||||||||||||||||||||||||||
| $ in millions, except where noted | 2Q2011 | 3Q2011 | 4Q2011 | 1Q2012 | 2Q2012 | 3Q11 - 2Q12 | QoQ | YoY | YTD | |||||||||||||||||||||||||||
| Economic Net Income |
163 | (185 | ) | 162 | 244 | (65 | ) | 156 | (126 | %) | (140 | %) | (67 | %) | ||||||||||||||||||||||
|
|
|
|
|
|
|
|
|
|
|
|
|
|
|
|
|
|
|
|||||||||||||||||||
| Net Performance Fees |
135 | (186 | ) | 152 | 215 | (80 | ) | 101 | (137 | %) | (159 | %) | (70 | %) | ||||||||||||||||||||||
|
|
|
|
|
|
|
|
|
|
|
|
|
|
|
|
|
|
|
|||||||||||||||||||
| Net Realized Performance Fees |
19 | 157 | 130 | 105 | 50 | 442 | (53 | %) | 165 | % | (13 | %) | ||||||||||||||||||||||||
|
|
|
|
|
|
|
|
|
|
|
|
|
|
|
|
|
|
|
|||||||||||||||||||
| Distributable Earnings |
39 | 173 | 134 | 120 | 61 | 488 | (49 | %) | 58 | % | (30 | %) | ||||||||||||||||||||||||
|
|
|
|
|
|
|
|
|
|
|
|
|
|
|
|
|
|
|
|||||||||||||||||||
| Total Assets Under Management ($ in billions) |
55.8 | 51.0 | 51.1 | 53.3 | 52.5 | (1 | %) | (6 | %) | |||||||||||||||||||||||||||
|
|
|
|
|
|
|
|
|
|
|
|
|
|
|
|||||||||||||||||||||||
| Fee-Earning Assets Under Management ($ in billions) |
39.3 | 38.6 | 38.0 | 37.8 | 37.1 | (2 | %) | (6 | %) | |||||||||||||||||||||||||||
|
|
|
|
|
|
|
|
|
|
|
|
|
|
|
|||||||||||||||||||||||
|
|
|
|||||||||||||||||||||||||||||||||||
Note: Totals may not sum due to rounding.
Page | 7
Global Market Strategies (GMS)
| • | Distributable Earnings (DE): $23 million. The following components impacted Distributable Earnings in the quarter: |
| • | Fee Related Earnings of $20 million increased from $11 million in 2Q 2011 as fee revenue of $60 million increased from $45 million on higher fee earning asset values, partially offset by higher compensation. |
| • | Net Realized Performance Fees of $1 million declined from $27 million in 2Q 2011 as volatile global capital markets muted realization opportunities in our funds. |
| • | Realized Investment Income of $3 million declined from $5 million in 2Q 2011. |
| • | Economic Net Income (ENI): $32 million |
| • | Economic Net Income was positively impacted by a 3% appreciation in GMS carry funds, though net performance fees of $4 million were lower when compared to $24 million in 2Q 2011. |
| • | Assets Under Management: $29.0 billion |
| • | Total AUM increased 3% versus 1Q 2012 while Fee-Earning AUM of $27.7 billion also increased 3% versus 1Q 2012. |
| • | Hedge Fund net inflows continued to be strong, with $1.4 billion in year-to-date net subscriptions, resulting in total hedge fund AUM of $9.6 billion. |
| • | Raised a second new Collateralized Loan Obligation (CLO) in 2012 with $510 million in assets. |
| • | GMS Carry Fund AUM ended the quarter at $3.3 billion. |
| • | Total Structured Credit AUM ended the quarter at $16.2 billion. |
| Global Markets Strategies (Actual Results) |
Period | LTM | % Change | |||||||||||||||||||||||||||||||||
| $ in millions, except AUM where noted | 2Q2011 | 3Q2011 | 4Q2011 | 1Q2012 | 2Q2012 | 3Q11 - 2Q12 | QoQ | YoY | YTD | |||||||||||||||||||||||||||
| Economic Net Income |
43 | 34 | 22 | 38 | 32 | 126 | (16 | %) | (26 | %) | (33 | %) | ||||||||||||||||||||||||
|
|
|
|
|
|
|
|
|
|
|
|
|
|
|
|
|
|
|
|||||||||||||||||||
| Net Performance Fees |
24 | 11 | 3 | 18 | 4 | 36 | (75 | %) | (82 | %) | (62 | %) | ||||||||||||||||||||||||
|
|
|
|
|
|
|
|
|
|
|
|
|
|
|
|
|
|
|
|||||||||||||||||||
| Net Realized Performance Fees |
27 | 7 | 67 | 15 | 1 | 89 | (96 | %) | (98 | %) | (64 | %) | ||||||||||||||||||||||||
|
|
|
|
|
|
|
|
|
|
|
|
|
|
|
|
|
|
|
|||||||||||||||||||
| Distributable Earnings |
43 | 32 | 90 | 31 | 23 | 178 | (25 | %) | (46 | %) | (22 | %) | ||||||||||||||||||||||||
|
|
|
|
|
|
|
|
|
|
|
|
|
|
|
|
|
|
|
|||||||||||||||||||
| Total Assets Under Management ($ in billions) |
20.5 | 23.0 | 24.5 | 28.3 | 29.0 | 3 | % | 41 | % | |||||||||||||||||||||||||||
|
|
|
|
|
|
|
|
|
|
|
|
|
|
|
|||||||||||||||||||||||
| Fee-Earning Assets Under Management ($ in billions) |
18.4 | 21.4 | 23.2 | 26.8 | 27.7 | 3 | % | 51 | % | |||||||||||||||||||||||||||
|
|
|
|
|
|
|
|
|
|
|
|
|
|
|
|||||||||||||||||||||||
| Funds Raised, excluding hedge funds ($ in billions) |
0.1 | 0.8 | 0.0 | 0.7 | 0.8 | 2.2 | 23 | % | 507 | % | ||||||||||||||||||||||||||
|
|
|
|
|
|
|
|
|
|
|
|
|
|
|
|
|
|||||||||||||||||||||
| Hedge Fund Net Inflows ($ in billions) |
0.2 | 0.5 | 0.8 | 0.7 | 0.7 | 2.7 | (7 | %) | 304 | % | ||||||||||||||||||||||||||
|
|
|
|
|
|
|
|
|
|
|
|
|
|
|
|
|
|||||||||||||||||||||
|
|
|
|||||||||||||||||||||||||||||||||||
Note: Totals may not sum due to rounding. Funds Raised excludes the impact of acquisitions.
Page | 8
Real Assets (RA)

| • | Distributable Earnings (DE): $28 million. The following components impacted Distributable Earnings in the quarter: |
| • | Fee Related Earnings of $3 million increased from ($1) million in 2Q 2011 as fee revenue was down slightly to $38 million, but direct and indirect compensation and benefits declined $6 million versus 2Q 2011. |
| • | Net Realized Performance Fees of $26 million increased from $7 million in 2Q 2011. |
| • | Realized Investment Income of $0 compared to $1 million in 2Q 2011. |
| • | Economic Net Income (ENI): ($29) million |
| • | Real Asset carry funds depreciated 3% in 2Q 2012, which was the main driver of negative economic net income in the RA segment, with Energy funds down 5% compared to 1Q 2012 and Real Estate funds up 1%. |
| • | Net performance fees of ($33) million compared to $31 million in 2Q 2011, driven by the decline in portfolio valuation. |
| • | Assets Under Management: $30.0 billion |
| • | Total AUM declined 7% versus 1Q 2012 while Fee-Earning AUM of $19.5 billion fell 14% versus 1Q 2012. |
| • | Fee-Earning AUM declined as the latest vintage Energy fund, co-managed with Riverstone, moved out of its investment period. |
| • | There are currently no significant Real Assets funds raising capital. |
| Real Assets (Actual results) |
Period | LTM | % Change | |||||||||||||||||||||||||||||||||
| $ in millions, except where noted | 2Q2011 | 3Q2011 | 4Q2011 | 1Q2012 | 2Q2012 | 3Q11 - 2Q12 | QoQ | YoY | YTD | |||||||||||||||||||||||||||
| Economic Net Income |
31 | (48 | ) | 64 | 101 | (29 | ) | 89 | (128 | %) | (193 | %) | (43 | %) | ||||||||||||||||||||||
|
|
|
|
|
|
|
|
|
|
|
|
|
|
|
|
|
|
|
|||||||||||||||||||
| Net Performance Fees |
31 | (47 | ) | 67 | 99 | (33 | ) | 86 | (133 | %) | (205 | %) | (48 | %) | ||||||||||||||||||||||
|
|
|
|
|
|
|
|
|
|
|
|
|
|
|
|
|
|
|
|||||||||||||||||||
| Net Realized Performance Fees |
7 | 27 | 17 | 22 | 26 | 91 | 14 | % | 245 | % | 3 | % | ||||||||||||||||||||||||
|
|
|
|
|
|
|
|
|
|
|
|
|
|
|
|
|
|
|
|||||||||||||||||||
| Distributable Earnings |
7 | 27 | 14 | 22 | 28 | 91 | 30 | % | 282 | % | 14 | % | ||||||||||||||||||||||||
|
|
|
|
|
|
|
|
|
|
|
|
|
|
|
|
|
|
|
|||||||||||||||||||
| Total Assets Under Management ($ in billions) |
31.6 | 30.4 | 30.7 | 32.2 | 30.0 | (7 | %) | (5 | %) | |||||||||||||||||||||||||||
|
|
|
|
|
|
|
|
|
|
|
|
|
|
|
|||||||||||||||||||||||
| Fee-Earning Assets Under Management ($ in billions |
22.6 | 22.4 | 22.2 | 22.8 | 19.5 | (14 | %) | (14 | %) | |||||||||||||||||||||||||||
|
|
|
|
|
|
|
|
|
|
|
|
|
|
|
|||||||||||||||||||||||
|
|
|
|||||||||||||||||||||||||||||||||||
Note: Totals may not sum due to rounding.
Page | 9
Fund of Funds Solutions (FoF)
| • | Distributable Earnings (DE): $3 million. The following components impacted Distributable Earnings in the quarter: |
| • | Fee Related Earnings of $3 million declined from $5 million in 1Q 2012 as fee revenue increased to $17 million in 2Q 2012 from $16 million in 1Q 2012, while General and Administrative expenses increased $2 million from 1Q 2012. |
| • | Fee Related Earnings were negatively impacted by a step down in the basis for Fee-Earning AUM in certain Fund of Funds Vehicles. In general, Fee-Earning AUM moves to a basis of invested capital from committed capital two years after the launch of a fund. |
| • | Economic Net Income (ENI): $4 million |
| • | Total revenue of $30 million declined from $33 million in 1Q 2012, as 2Q 2012 net performance fees of $1 million declined from $4 million in 1Q 2012. |
| • | Assets Under Management: $44.6 billion |
| • | Total AUM declined 2% versus 1Q 2012 while Fee-Earning AUM of $27.6 billion fell 6% versus 1Q 2012. |
| • | The 2Q 2012 F/X impact on Fee-Earning AUM was $1.3 billion, or 4% of beginning of period assets, and accounts for a majority of the Fee-Earning AUM decline. |
| Fund of Funds Solutions (Actual Results) |
Period | LTM | % Change | |||||||||||||||||||||||||||||||||
| $ in millions, except where noted | 2Q2011 | 3Q2011 | 4Q2011 | 1Q2012 | 2Q2012 | 3Q11 - 2Q12 | QoQ | YoY | YTD | |||||||||||||||||||||||||||
| Economic Net Income |
N.A. | 7 | 6 | 9 | 4 | 27 | (56 | %) | N.A. | N.A. | ||||||||||||||||||||||||||
|
|
|
|
|
|
|
|
|
|
|
|
|
|
|
|
|
|
|
|||||||||||||||||||
| Net Performance Fees |
N.A. | (1 | ) | 1 | 4 | 1 | 5 | (65 | %) | N.A. | N.A. | |||||||||||||||||||||||||
|
|
|
|
|
|
|
|
|
|
|
|
|
|
|
|
|
|
|
|||||||||||||||||||
| Net Realized Performance Fees |
N.A. | 4 | 3 | 0 | 0 | 7 | (75 | %) | N.A. | N.A. | ||||||||||||||||||||||||||
|
|
|
|
|
|
|
|
|
|
|
|
|
|
|
|
|
|
|
|||||||||||||||||||
| Distributable Earnings |
N.A. | 12 | 9 | 6 | 3 | 29 | (52 | %) | N.A. | N.A. | ||||||||||||||||||||||||||
|
|
|
|
|
|
|
|
|
|
|
|
|
|
|
|
|
|
|
|||||||||||||||||||
| Total Assets Under Management ($ in billions) |
N.A. | 44.2 | 40.7 | 45.4 | 44.6 | (2 | %) | N.A. | N.A. | |||||||||||||||||||||||||||
|
|
|
|
|
|
|
|
|
|
|
|
|
|
|
|
|
|||||||||||||||||||||
| Fee-Earning Assets Under Management ($ in billions |
N.A. | 30.2 | 27.7 | 29.5 | 27.6 | (6 | %) | N.A. | N.A. | |||||||||||||||||||||||||||
|
|
|
|
|
|
|
|
|
|
|
|
|
|
|
|
|
|||||||||||||||||||||
|
|
|
|||||||||||||||||||||||||||||||||||
Note: Carlyle Group acquired a 60% ownership interest in AlpInvest on July 1, 2011. Totals may not sum due to rounding.
Page | 10
Balance Sheet Highlights
As of June 30, 2012, Carlyle had the following balance sheet highlights. The amounts presented below exclude the effect of consolidation eliminations on investments and accrued performance fees as well as cash and debt associated with Carlyle’s consolidated funds:
| • | Cash and Cash Equivalents of $450 million. |
| • | Investments attributable to Carlyle unitholders of $217 million. |
| • | Net accrued performance fees attributable to Carlyle unitholders of $968 million. This is comprised of Gross Accrued Performance Fees of $2,131 million less $133 million in accrued giveback obligation and $1,030 million in accrued performance fee compensation and non-controlling interest. |
| • | Loans payable of $500 million. |
| • | Carlyle has an undrawn $750 million revolving credit line. |
During the second quarter, on May 2, 2012, Carlyle priced its initial public offering of 30.5 million of its common units at $22 per unit. The common units trade on the NASDAQ Global Select Market under the symbol “CG.” The underwriters did not exercise their option to purchase additional units.
Carlyle raised $639 million in proceeds, after accounting for the underwriter discount, during the initial public offering, and used the net proceeds from the offering to repay indebtedness.
Conference Call
Carlyle will host a conference call on August 8, 2012 at 8:00 a.m. EDT to discuss the second quarter 2012 results and industry trends. Immediately following the prepared remarks, there will be a Question and Answer session for analysts and investors.
Analysts and institutional investors may listen to the call by dialing +1-800-850-2903 (international +1-253-237-1169) and mentioning “Carlyle Group Second Quarter 2012 Results Conference Call”. The conference call will be webcast simultaneously to the public through a link on the investor relations section of The Carlyle Group web site at ir.carlyle.com. An archived replay of the webcast also will be available shortly after the live event.
Page | 11
About The Carlyle Group
The Carlyle Group is a global alternative asset manager with $156 billion of assets under management in 99 active funds and 63 fund of funds vehicles as of June 30, 2012. Carlyle invests across four segments – Corporate Private Equity, Real Assets, Global Market Strategies and Fund of Funds Solutions – in Africa, Asia, Australia, Europe, the Middle East, North America and South America. Carlyle has developed expertise in various industries, including: aerospace, defense & government services, consumer & retail, energy, financial services, healthcare, industrial, technology & business services, telecommunications & media and transportation. The Carlyle Group employs more than 1,300 people in 32 offices across six continents. www.carlyle.com
| Contacts: |
||
| Public Market Investor Relations: |
Media: | |
| Daniel Harris |
Chris Ullman | |
| Managing Director, Head of Public Market |
Managing Director, Director of Global | |
| Investor Relations |
Communications | |
| Phone: 212-813-4527 |
Phone: 202-729-5385 | |
| daniel.harris@carlyle.com |
christopher.ullman@carlyle.com |
Page | 12
Forward Looking Statements
This press release may contain forward looking statements within the meaning of Section 27A of the Securities Act of 1933 and Section 21E of the Securities Exchange Act of 1934. These statements include, but are not limited to, statements related to our expectations regarding the performance of our business, our financial results, our liquidity and capital resources and other non-historical statements. You can identify these forward-looking statements by the use of words such as “outlook,” “believes,” “expects,” “potential,” “continues,” “may,” “will,” “should,” “seeks,” “approximately,” “predicts,” “intends,” “plans,” “estimates,” “anticipates” or the negative version of these words or other comparable words. These statements are subject to risks, uncertainties and assumptions, including those described under the section entitled “Risk Factors” in our prospectus dated May 2, 2012, filed with the SEC pursuant to Rule 424(b) of the Securities Act on May 4, 2012, as such factors may be updated from time to time in our periodic filings with the SEC, which are accessible on the SEC’s website at www.sec.gov. These factors should not be construed as exhaustive and should be read in conjunction with the other cautionary statements that are included in this release and in our filings with the SEC. We undertake no obligation to publicly update or review any forward-looking statements, whether as a result of new information, future developments or otherwise, except as required by applicable law.
This release does not constitute an offer for any Carlyle fund.
Page | 13
The Carlyle Group L.P.
GAAP Statement of Operations (Unaudited)
| Three Months Ended | Six Months Ended | |||||||||||||||
| June
30, 2012 |
June
30, 2011 |
June
30, 2012 |
June
30, 2011 |
|||||||||||||
| (Dollars in millions, except unit and per unit data) | (Dollars in millions, except unit and per unit data) | |||||||||||||||
| Revenues |
||||||||||||||||
| Fund management fees |
$ | 239.9 | $ | 219.2 | $ | 474.3 | $ | 447.2 | ||||||||
| Performance fees |
||||||||||||||||
| Realized |
116.7 | 92.5 | 397.3 | 494.9 | ||||||||||||
| Unrealized |
(337.1 | ) | 253.2 | 23.1 | 725.5 | |||||||||||
|
|
|
|
|
|
|
|
|
|||||||||
| Total performance fees |
(220.4 | ) | 345.7 | 420.4 | 1,220.4 | |||||||||||
| Investment income (loss) |
||||||||||||||||
| Realized |
2.4 | 9.7 | 1.6 | 42.8 | ||||||||||||
| Unrealized |
4.6 | 10.9 | 26.9 | 19.2 | ||||||||||||
|
|
|
|
|
|
|
|
|
|||||||||
| Total investment income (loss) |
7.0 | 20.6 | 28.5 | 62.0 | ||||||||||||
| Interest and other income |
2.7 | 7.2 | 5.4 | 13.1 | ||||||||||||
| Interest and other income of Consolidated Funds |
219.2 | 163.1 | 430.7 | 330.4 | ||||||||||||
|
|
|
|
|
|
|
|
|
|||||||||
| Total revenues |
248.4 | 755.8 | 1,359.3 | 2,073.1 | ||||||||||||
| Expenses |
||||||||||||||||
| Compensation and benefits |
||||||||||||||||
| Base compensation |
149.9 | 88.6 | 256.0 | 175.3 | ||||||||||||
| Equity-based compensation |
94.2 | — | 94.2 | — | ||||||||||||
| Performance fee related |
||||||||||||||||
| Realized |
32.1 | 31.8 | 66.4 | 84.8 | ||||||||||||
| Unrealized |
(97.7 | ) | 22.3 | (42.9 | ) | 57. 8 | ||||||||||
|
|
|
|
|
|
|
|
|
|||||||||
| Total compensation and benefits |
178.5 | 142.7 | 373.7 | 317.9 | ||||||||||||
| General, administrative and other expenses |
84.0 | 77.8 | 175.2 | 144.3 | ||||||||||||
| Interest |
6.2 | 15.8 | 16.6 | 32.8 | ||||||||||||
| Interest and other expenses of Consolidated Funds |
179.5 | 104.3 | 364.0 | 190.9 | ||||||||||||
| Other non-operating expense (income) |
0.7 | 5.2 | (3.4 | ) | 20.6 | |||||||||||
|
|
|
|
|
|
|
|
|
|||||||||
| Total expenses |
448.9 | 345.8 | 926.1 | 706.5 | ||||||||||||
| Other income (loss) |
||||||||||||||||
| Net investment income (losses) of Consolidated Funds |
386.6 | (92.7 | ) | 1,258.7 | (277.0 | ) | ||||||||||
|
|
|
|
|
|
|
|
|
|||||||||
| Income before provision for income taxes |
186.1 | 317.3 | 1,691.9 | 1,089.6 | ||||||||||||
| Provision for income taxes |
10.6 | 6.7 | 22.3 | 12.8 | ||||||||||||
|
|
|
|
|
|
|
|
|
|||||||||
| Net income |
175.5 | 310.6 | 1,669.6 | 1,076.8 | ||||||||||||
| Net income (loss) attributable to non-controlling interests in consolidated entities |
357.9 | (61.1 | ) | 1,222.8 | (191.1 | ) | ||||||||||
|
|
|
|
|
|
|
|
|
|||||||||
| Net income (loss) attributable to Carlyle Holdings |
(182.4 | ) | $ | 371.7 | 446.8 | $ | 1,267.9 | |||||||||
|
|
|
|
|
|||||||||||||
| Net income (loss) attributable to non-controlling interests in Carlyle Holdings |
(172.1 | ) | 457.1 | |||||||||||||
|
|
|
|
|
|||||||||||||
| Net loss attributable to The Carlyle Group L.P. |
$ | (10.3 | ) | $ | (10.3 | ) | ||||||||||
|
|
|
|
|
|||||||||||||
| Net loss attributable to The Carlyle Group L.P. per common unit |
||||||||||||||||
| Basic |
$ | (0.26 | ) | $ | (0.26 | ) | ||||||||||
|
|
|
|
|
|||||||||||||
| Diluted |
$ | (0.26 | ) | $ | (0.26 | ) | ||||||||||
|
|
|
|
|
|||||||||||||
| Weighted-average common units |
||||||||||||||||
| Basic |
40,160,245 | 40,160,245 | ||||||||||||||
|
|
|
|
|
|||||||||||||
| Diluted |
40,160,245 | 40,160,245 | ||||||||||||||
|
|
|
|
|
|||||||||||||
Page | 14
Total Segment Information (Unaudited)
The following table sets forth information in the format used by management when making resource deployment decisions and in assessing the performance of our segments. The information below is the aggregate results of our four segments.
| Three Months Ended | Twelve Months Ended | |||||||||||||||||||
| June 30, 2012 |
June 30, 2011 |
March 31, 2012 |
June 30, 2012 |
June 30, 2011 |
||||||||||||||||
| (Dollars in millions) | ||||||||||||||||||||
| Segment Revenues |
||||||||||||||||||||
| Fund level fee revenues |
||||||||||||||||||||
| Fund management fees |
$ | 235.0 | $ | 214.9 | $ | 225.4 | $ | 915.4 | $ | 797.6 | ||||||||||
| Portfolio advisory fees, net |
7.0 | 12.0 | 8.0 | 28.2 | 35.1 | |||||||||||||||
| Transaction fees, net |
3.7 | 4.1 | 2.7 | 21.7 | 41.3 | |||||||||||||||
|
|
|
|
|
|
|
|
|
|
|
|||||||||||
| Total fee revenues |
245.7 | 231.0 | 236.1 | 965.3 | 874.0 | |||||||||||||||
| Performance fees |
||||||||||||||||||||
| Realized |
110.3 | 97.6 | 281.8 | 1,194.1 | 685.4 | |||||||||||||||
| Unrealized |
(311.1 | ) | 243.8 | 349.7 | (859.5 | ) | 1,883.6 | |||||||||||||
|
|
|
|
|
|
|
|
|
|
|
|||||||||||
| Total performance fees |
(200.8 | ) | 341.4 | 631.5 | 334.6 | 2,569.0 | ||||||||||||||
| Investment income |
||||||||||||||||||||
| Realized |
4.0 | 5.6 | 2.1 | 36.3 | 46.2 | |||||||||||||||
| Unrealized |
10.0 | 9.8 | 21.2 | 14.0 | 65.5 | |||||||||||||||
|
|
|
|
|
|
|
|
|
|
|
|||||||||||
| Total investment income |
14.0 | 15.4 | 23.3 | 50.3 | 111.7 | |||||||||||||||
| Interest and other income |
2.5 | 7.6 | 2.6 | 7.1 | 26.4 | |||||||||||||||
|
|
|
|
|
|
|
|
|
|
|
|||||||||||
| Total revenues |
61.4 | 595.4 | 893.5 | 1,357.3 | 3,581.1 | |||||||||||||||
| Segment Expenses |
||||||||||||||||||||
| Compensation and benefits |
||||||||||||||||||||
| Direct base compensation |
105.8 | 97.4 | 101.2 | 415.2 | 374.8 | |||||||||||||||
| Indirect base compensation |
36.2 | 35.7 | 33.1 | 137.0 | 124.0 | |||||||||||||||
| Equity-based compensation |
0.6 | — | — | 0.6 | — | |||||||||||||||
| Performance fee related |
||||||||||||||||||||
| Realized |
34.5 | 44.6 | 139.1 | 565.0 | 330.3 | |||||||||||||||
| Unrealized |
(128.6 | ) | 106.1 | 157.6 | (458.0 | ) | 922.3 | |||||||||||||
|
|
|
|
|
|
|
|
|
|
|
|||||||||||
| Total compensation and benefits |
48.5 | 283.8 | 431.0 | 659.8 | 1,751.4 | |||||||||||||||
| General, administrative, and other indirect expenses |
64.0 | 60.0 | 60.6 | 255.9 | 195.8 | |||||||||||||||
| Interest expense |
6.1 | 14.8 | 9.8 | 43.8 | 40.1 | |||||||||||||||
|
|
|
|
|
|
|
|
|
|
|
|||||||||||
| Total expenses |
118.6 | 358.6 | 501.4 | 959.5 | 1,987.3 | |||||||||||||||
|
|
|
|
|
|
|
|
|
|
|
|||||||||||
| Economic Net Income |
$ | (57.2 | ) | $ | 236.8 | $ | 392.1 | $ | 397.8 | $ | 1,593.8 | |||||||||
|
|
|
|
|
|
|
|
|
|
|
|||||||||||
| Fee Related Earnings |
$ | 35.5 | $ | 30.7 | $ | 34.0 | $ | 119.9 | $ | 165.7 | ||||||||||
|
|
|
|
|
|
|
|
|
|
|
|||||||||||
| Net Performance Fees |
$ | (106.7 | ) | $ | 190.7 | $ | 334.8 | $ | 227.6 | $ | 1,316.4 | |||||||||
|
|
|
|
|
|
|
|
|
|
|
|||||||||||
| Realized Net Performance Fees |
$ | 75.8 | $ | 53.0 | $ | 142.7 | $ | 629.1 | $ | 355.1 | ||||||||||
|
|
|
|
|
|
|
|
|
|
|
|||||||||||
| Investment Income |
$ | 14.0 | $ | 15.4 | $ | 23.3 | $ | 50.3 | $ | 111.7 | ||||||||||
|
|
|
|
|
|
|
|
|
|
|
|||||||||||
| Distributable Earnings |
$ | 115.3 | $ | 89.3 | $ | 178.8 | $ | 785.3 | $ | 567.0 | ||||||||||
|
|
|
|
|
|
|
|
|
|
|
|||||||||||
| Pro Forma Economic Net Income(1) |
$ | (58.9 | ) | |||||||||||||||||
|
|
|
|||||||||||||||||||
| Pro Forma Fee Related Earnings(1) |
$ | 37.0 | ||||||||||||||||||
|
|
|
|||||||||||||||||||
| Pro Forma Realized Net Performance Fees(1) |
$ | 75.7 | ||||||||||||||||||
|
|
|
|||||||||||||||||||
| Pro Forma Distributable Earnings(1) |
$ | 116.7 | ||||||||||||||||||
|
|
|
|||||||||||||||||||
| (1) | The selected pro forma non-GAAP financial measures for the three months ended June 30, 2012 presents these measures giving pro forma effect to the Reorganization and Offering Transactions described in our final Prospectus dated May 2, 2012, as if such transactions had occurred on January 1, 2012. |
Page | 15
Total Segment Information (Unaudited), cont
| Three Months Ended | ||||||||||||||||||||||||||||
| Jun 30, 2012 vs. | ||||||||||||||||||||||||||||
| Jun 30, 2011 |
Sep 30, 2011 |
Dec 31, 2011 |
Mar 31, 2012 |
Jun 30, 2012 |
Jun 30, 2011 | Mar 31, 2012 | ||||||||||||||||||||||
| $ | $ | |||||||||||||||||||||||||||
| (Dollars in millions) | ||||||||||||||||||||||||||||
| Economic Net Income, |
||||||||||||||||||||||||||||
| Total Segments |
||||||||||||||||||||||||||||
| Revenues |
||||||||||||||||||||||||||||
| Segment fee revenues |
||||||||||||||||||||||||||||
| Fund management fees |
$ | 214.9 | $ | 234.4 | $ | 220.6 | $ | 225.4 | $ | 235.0 | $ | 20.1 | $ | 9.6 | ||||||||||||||
| Portfolio advisory fees, net |
12.0 | 7.5 | 5.7 | 8.0 | 7.0 | (5.0 | ) | (1.0 | ) | |||||||||||||||||||
| Transaction fees, net |
4.1 | 5.4 | 9.9 | 2.7 | 3.7 | (0.4 | ) | 1.0 | ||||||||||||||||||||
|
|
|
|
|
|
|
|
|
|
|
|
|
|
|
|||||||||||||||
| Total fee revenues |
231.0 | 247.3 | 236.2 | 236.1 | 245.7 | 14.7 | 9.6 | |||||||||||||||||||||
| Performance fees |
||||||||||||||||||||||||||||
| Realized |
97.6 | 387.4 | 414.6 | 281.8 | 110.3 | 12.7 | (171.5 | ) | ||||||||||||||||||||
| Unrealized |
243.8 | (894.7 | ) | (3.4 | ) | 349.7 | (311.1 | ) | (554.9 | ) | (660.8 | ) | ||||||||||||||||
|
|
|
|
|
|
|
|
|
|
|
|
|
|
|
|||||||||||||||
| Total performance fees |
341.4 | |
(507.3 |
) |
411.2 | 631.5 | (200.8 | ) | (542.2 | ) | (832.3 | ) | ||||||||||||||||
| Investment income |
||||||||||||||||||||||||||||
| Realized |
5.6 | 13.0 | 17.2 | 2.1 | 4.0 | (1.6 | ) | 1.9 | ||||||||||||||||||||
| Unrealized |
9.8 | (17.6 | ) | 0.4 | 21.2 | 10.0 | 0.2 | (11.2 | ) | |||||||||||||||||||
|
|
|
|
|
|
|
|
|
|
|
|
|
|
|
|||||||||||||||
| Total investment income |
15.4 | (4.6 | ) | 17.6 | 23.3 | 14.0 | (1.4 | ) | (9.3 | ) | ||||||||||||||||||
| Interest and other income |
7.6 | 1.4 | 0.6 | 2.6 | 2.5 | (5.1 | ) | (0.1 | ) | |||||||||||||||||||
|
|
|
|
|
|
|
|
|
|
|
|
|
|
|
|||||||||||||||
| Total revenues |
595.4 | (263.2 | ) | 665.6 | 893.5 | 61.4 | (534.0 | ) | (832.1 | ) | ||||||||||||||||||
| Expenses |
||||||||||||||||||||||||||||
| Compensation and benefits |
||||||||||||||||||||||||||||
| Direct base compensation |
97.4 | 107.2 | 101.0 | 101.2 | 105.8 | 8.4 | 4.6 | |||||||||||||||||||||
| Indirect base compensation |
35.7 | 34.8 | 32.9 | 33.1 | 36.2 | 0.5 | 3.1 | |||||||||||||||||||||
| Equity-based compensation |
— | — | — | — | 0.6 | 0.6 | 0.6 | |||||||||||||||||||||
| Performance fee related |
||||||||||||||||||||||||||||
| Realized |
44.6 | 193.2 | 198.2 | 139.1 | 34.5 | (10.1 | ) | (104.6 | ) | |||||||||||||||||||
| Unrealized |
106.1 | (477.2 | ) | (9.8 | ) | 157.6 | (128.6 | ) | (234.7 | ) | (286.2 | ) | ||||||||||||||||
|
|
|
|
|
|
|
|
|
|
|
|
|
|
|
|||||||||||||||
| Total compensation and benefits |
283.8 | (142.0 | ) | 322.3 | 431.0 | 48.5 | (235.3 | ) | (382.5 | ) | ||||||||||||||||||
| General, administrative, and other indirect expenses |
60.0 | 55.0 | 76.3 | 60.6 | 64.0 | 4.0 | 3.4 | |||||||||||||||||||||
| Interest expense |
14.8 | 15.1 | 12.8 | 9.8 | 6.1 | (8.7 | ) | (3.7 | ) | |||||||||||||||||||
|
|
|
|
|
|
|
|
|
|
|
|
|
|
|
|||||||||||||||
| Total expenses |
358.6 | (71.9 | ) | 411.4 | 501.4 | 118.6 | (240.0 | ) | (382.8 | ) | ||||||||||||||||||
|
|
|
|
|
|
|
|
|
|
|
|
|
|
|
|||||||||||||||
| Economic Net Income |
$ | 236.8 | $ | (191.3 | ) | $ | 254.2 | $ | 392.1 | $ | (57.2 | ) | $ | (294.0 | ) | $ | (449.3 | ) | ||||||||||
|
|
|
|
|
|
|
|
|
|
|
|
|
|
|
|||||||||||||||
| Fee Related Earnings |
$ | 30.7 | $ | 36.6 | $ | 13.8 | $ | 34.0 | $ | 35.5 | $ | 4.8 | $ | 1.5 | ||||||||||||||
|
|
|
|
|
|
|
|
|
|
|
|
|
|
|
|||||||||||||||
| Net Performance Fees |
$ | 190.7 | $ | (223.3 | ) | $ | 222.8 | $ | 334.8 | $ | (106.7 | ) | $ | (297.4 | ) | $ | (441.5 | ) | ||||||||||
|
|
|
|
|
|
|
|
|
|
|
|
|
|
|
|||||||||||||||
| Realized Net Performance Fees |
$ | 53.0 | $ | 194.2 | $ | 216.4 | $ | 142.7 | $ | 75.8 | $ | 22.8 | $ | (66.9 | ) | |||||||||||||
|
|
|
|
|
|
|
|
|
|
|
|
|
|
|
|||||||||||||||
| Investment Income |
$ | 15.4 | $ | (4.6 | ) | $ | 17.6 | $ | 23.3 | $ | 14.0 | $ | (1.4 | ) | $ | (9.3 | ) | |||||||||||
|
|
|
|
|
|
|
|
|
|
|
|
|
|
|
|||||||||||||||
| Distributable Earnings |
$ | 89.3 | $ | 243.8 | $ | 247.4 | $ | 178.8 | $ | 115.3 | $ | 26.0 | $ | (63.5 | ) | |||||||||||||
|
|
|
|
|
|
|
|
|
|
|
|
|
|
|
|||||||||||||||
Page | 16
Corporate Private Equity Segment Results (Unaudited)
| Three Months Ended | ||||||||||||||||||||||||||||
| Jun 30, 2012 vs. | ||||||||||||||||||||||||||||
| Jun 30, 2011 |
Sep 30, 2011 |
Dec 31, 2011 |
Mar 31, 2012 |
Jun 30, 2012 |
Jun 30, 2011 | Mar 31, 2012 | ||||||||||||||||||||||
| $ | $ | |||||||||||||||||||||||||||
| (Dollars in millions) | ||||||||||||||||||||||||||||
| Corporate Private Equity |
||||||||||||||||||||||||||||
| Revenues |
||||||||||||||||||||||||||||
| Segment fee revenues |
||||||||||||||||||||||||||||
| Fund management fees |
$ | 130.2 | $ | 128.1 | $ | 123.6 | $ | 123.9 | $ | 124.0 | $ | (6.2 | ) | $ | 0.1 | |||||||||||||
| Portfolio advisory fees, net |
10.4 | 4.8 | 4.3 | 7.0 | 4.9 | (5.5 | ) | (2.1 | ) | |||||||||||||||||||
| Transaction fees, net |
4.1 | 3.8 | 8.3 | 1.6 | 1.6 | (2.5 | ) | — | ||||||||||||||||||||
|
|
|
|
|
|
|
|
|
|
|
|
|
|
|
|||||||||||||||
| Total fee revenues |
144.7 | 136.7 | 136.2 | 132.5 | 130.5 | (14.2 | ) | (2.0 | ) | |||||||||||||||||||
| Performance fees |
||||||||||||||||||||||||||||
| Realized |
30.8 | 333.0 | 262.2 | 223.0 | 80.6 | 49.8 | (142.4 | ) | ||||||||||||||||||||
| Unrealized |
240.8 | (787.2 | ) | 79.7 | 241.3 | (269.7 | ) | (510.5 | ) | (511.0 | ) | |||||||||||||||||
|
|
|
|
|
|
|
|
|
|
|
|
|
|
|
|||||||||||||||
| Total performance fees |
271.6 | (454.2 | ) | 341.9 | 464.3 | (189.1 | ) | (460.7 | ) | (653.4 | ) | |||||||||||||||||
| Investment income |
||||||||||||||||||||||||||||
| Realized |
(0.1 | ) | 8.1 | 8.1 | 0.8 | 1.5 | 1.6 | 0.7 | ||||||||||||||||||||
| Unrealized |
7.2 | (14.8 | ) | 5.9 | 14.5 | 3.7 | (3.5 | ) | (10.8 | ) | ||||||||||||||||||
|
|
|
|
|
|
|
|
|
|
|
|
|
|
|
|||||||||||||||
| Total investment income |
7.1 | (6.7 | ) | 14.0 | 15.3 | 5.2 | (1.9 | ) | (10.1 | ) | ||||||||||||||||||
| Interest and other income |
4.2 | 0.3 | 1.1 | 1.4 | 1.6 | (2.6 | ) | 0.2 | ||||||||||||||||||||
|
|
|
|
|
|
|
|
|
|
|
|
|
|
|
|||||||||||||||
| Total revenues |
427.6 | (323.9 | ) | 493.2 | 613.5 | (51.8 | ) | (479.4 | ) | (665.3 | ) | |||||||||||||||||
| Expenses |
||||||||||||||||||||||||||||
| Compensation and benefits |
||||||||||||||||||||||||||||
| Direct base compensation |
62.3 | 62.8 | 63.9 | 55.3 | 54.8 | (7.5 | ) | (0.5 | ) | |||||||||||||||||||
| Indirect base compensation |
22.7 | 24.1 | 23.7 | 20.8 | 24.1 | 1.4 | 3.3 | |||||||||||||||||||||
| Equity-based compensation |
— | — | — | — | 0.4 | 0.4 | 0.4 | |||||||||||||||||||||
| Performance fee related |
||||||||||||||||||||||||||||
| Realized |
12.1 | 176.2 | 131.9 | 117.6 | 31.0 | 18.9 | (86.6 | ) | ||||||||||||||||||||
| Unrealized |
124.2 | (444.2 | ) | 58.0 | 132.0 | (140.3 | ) | (264.5 | ) | (272.3 | ) | |||||||||||||||||
|
|
|
|
|
|
|
|
|
|
|
|
|
|
|
|||||||||||||||
| Total compensation and benefits |
221.3 | (181.1 | ) | 277.5 | 325.7 | (30.0 | ) | (251.3 | ) | (355.7 | ) | |||||||||||||||||
| General, administrative, and other indirect expenses |
34.0 | 32.4 | 46.5 | 38.0 | 39.2 | 5.2 | 1.2 | |||||||||||||||||||||
| Interest expense |
9.7 | 9.8 | 7.5 | 5.9 | 3.5 | (6.2 | ) | (2.4 | ) | |||||||||||||||||||
|
|
|
|
|
|
|
|
|
|
|
|
|
|
|
|||||||||||||||
| Total expenses |
265.0 | (138.9 | ) | 331.5 | 369.6 | 12.7 | (252.3 | ) | (356.9 | ) | ||||||||||||||||||
|
|
|
|
|
|
|
|
|
|
|
|
|
|
|
|||||||||||||||
| Economic Net Income |
$ | 162.6 | $ | (185.0 | ) | $ | 161.7 | $ | 243.9 | $ | (64.5 | ) | $ | (227.1 | ) | $ | (308.4 | ) | ||||||||||
|
|
|
|
|
|
|
|
|
|
|
|
|
|
|
|||||||||||||||
| Fee Related Earnings |
$ | 20.2 | $ | 7.9 | $ | (4.3 | ) | $ | 13.9 | $ | 10.1 | $ | (10.1 | ) | $ | (3.8 | ) | |||||||||||
|
|
|
|
|
|
|
|
|
|
|
|
|
|
|
|||||||||||||||
| Net Performance Fees |
$ | 135.3 | $ | (186.2 | ) | $ | 152.0 | $ | 214.7 | $ | (79.8 | ) | $ | (215.1 | ) | $ | (294.5 | ) | ||||||||||
|
|
|
|
|
|
|
|
|
|
|
|
|
|
|
|||||||||||||||
| Realized Net Performance Fees |
$ | 18.7 | $ | 156.8 | $ | 130.3 | $ | 105.4 | $ | 49.6 | $ | 30.9 | $ | (55.8 | ) | |||||||||||||
|
|
|
|
|
|
|
|
|
|
|
|
|
|
|
|||||||||||||||
| Investment Income |
$ | 7.1 | $ | (6.7 | ) | $ | 14.0 | $ | 15.3 | $ | 5.2 | $ | (1.9 | ) | $ | (10.1 | ) | |||||||||||
|
|
|
|
|
|
|
|
|
|
|
|
|
|
|
|||||||||||||||
| Distributable Earnings |
$ | 38.8 | $ | 172.8 | $ | 134.1 | $ | 120.1 | $ | 61.2 | $ | 22.4 | $ | (58.9 | ) | |||||||||||||
|
|
|
|
|
|
|
|
|
|
|
|
|
|
|
|||||||||||||||
Page | 17
Global Market Strategies Segment Results (Unaudited)
| Three Months Ended | ||||||||||||||||||||||||||||
| Jun 30, 2012 vs. | ||||||||||||||||||||||||||||
| Jun 30, 2011 |
Sep 30, 2011 |
Dec 31, 2011 |
Mar 31, 2012 |
Jun 30, 2012 |
Jun 30, 2011 | Mar 31, 2012 | ||||||||||||||||||||||
| $ | $ | |||||||||||||||||||||||||||
| (Dollars in millions) | ||||||||||||||||||||||||||||
| Global Market Strategies |
||||||||||||||||||||||||||||
| Revenues |
||||||||||||||||||||||||||||
| Segment fee revenues |
||||||||||||||||||||||||||||
| Fund management fees |
$ | 44.4 | $ | 50.4 | $ | 44.9 | $ | 48.6 | $ | 59.5 | $ | 15.1 | $ | 10.9 | ||||||||||||||
| Portfolio advisory fees, net |
0.9 | 0.8 | 0.8 | 0.7 | 0.5 | (0.4 | ) | (0.2 | ) | |||||||||||||||||||
| Transaction fees, net |
— | — | — | — | — | — | — | |||||||||||||||||||||
|
|
|
|
|
|
|
|
|
|
|
|
|
|
|
|||||||||||||||
| Total fee revenues |
45.3 | 51.2 | 45.7 | 49.3 | 60.0 | 14.7 | 10.7 | |||||||||||||||||||||
| Performance fees |
||||||||||||||||||||||||||||
| Realized |
54.8 | 6.1 | 108.5 | 32.4 | 1.3 | (53.5 | ) | (31.1 | ) | |||||||||||||||||||
| Unrealized |
(16.1 | ) | (6.8 | ) | (101.0 | ) | 12.7 | 4.0 | 20.1 | (8.7 | ) | |||||||||||||||||
|
|
|
|
|
|
|
|
|
|
|
|
|
|
|
|||||||||||||||
| Total performance fees |
38.7 | (0.7 | ) | 7.5 | 45.1 | 5.3 | (33.4 | ) | (39.8 | ) | ||||||||||||||||||
| Investment income |
||||||||||||||||||||||||||||
| Realized |
5.0 | 3.1 | 9.3 | 1.3 | 2.8 | (2.2 | ) | 1.5 | ||||||||||||||||||||
| Unrealized |
2.8 | (2.1 | ) | (4.7 | ) | 3.7 | 4.8 | 2.0 | 1.1 | |||||||||||||||||||
|
|
|
|
|
|
|
|
|
|
|
|
|
|
|
|||||||||||||||
| Total investment income |
7.8 | 1.0 | 4.6 | 5.0 | 7.6 | (0.2 | ) | 2.6 | ||||||||||||||||||||
| Interest and other income |
1.3 | 1.4 | (0.4 | ) | 0.6 | 0.4 | (0.9 | ) | (0.2 | ) | ||||||||||||||||||
|
|
|
|
|
|
|
|
|
|
|
|
|
|
|
|||||||||||||||
| Total revenues |
93.1 | 52.9 | 57.4 | 100.0 | 73.3 | (19.8 | ) | (26.7 | ) | |||||||||||||||||||
| Expenses |
||||||||||||||||||||||||||||
| Compensation and benefits |
||||||||||||||||||||||||||||
| Direct base compensation |
15.3 | 16.9 | 13.9 | 19.7 | 25.2 | 9.9 | 5.5 | |||||||||||||||||||||
| Indirect base compensation |
4.3 | 4.0 | 3.9 | 4.9 | 4.5 | 0.2 | (0.4 | ) | ||||||||||||||||||||
| Equity-based compensation |
— | — | — | — | 0.1 | 0.1 | 0.1 | |||||||||||||||||||||
| Performance fee related |
||||||||||||||||||||||||||||
| Realized |
27.9 | (0.7 | ) | 41.8 | 17.8 | 0.7 | (27.2 | ) | (17.1 | ) | ||||||||||||||||||
| Unrealized |
(13.5 | ) | (10.7 | ) | (37.5 | ) | 9.7 | 0.2 | 13.7 | (9.5 | ) | |||||||||||||||||
|
|
|
|
|
|
|
|
|
|
|
|
|
|
|
|||||||||||||||
| Total compensation and benefits |
34.0 | 9.5 | 22.1 | 52.1 | 30.7 | (3.3 | ) | (21.4 | ) | |||||||||||||||||||
| General, administrative, and other indirect expenses |
13.5 | 6.8 | 10.1 | 8.1 | 9.7 | (3.8 | ) | 1.6 | ||||||||||||||||||||
| Interest expense |
2.2 | 2.4 | 3.0 | 1.7 | 0.9 | (1.3 | ) | (0.8 | ) | |||||||||||||||||||
|
|
|
|
|
|
|
|
|
|
|
|
|
|
|
|||||||||||||||
| Total expenses |
49.7 | 18.7 | 35.2 | 61.9 | 41.3 | (8.4 | ) | (20.6 | ) | |||||||||||||||||||
|
|
|
|
|
|
|
|
|
|
|
|
|
|
|
|||||||||||||||
| Economic Net Income |
$ | 43.4 | $ | 34.2 | $ | 22.2 | $ | 38.1 | $ | 32.0 | $ | (11.4 | ) | $ | (6.1 | ) | ||||||||||||
|
|
|
|
|
|
|
|
|
|
|
|
|
|
|
|||||||||||||||
| Fee Related Earnings |
$ | 11.3 | $ | 22.5 | $ | 14.4 | $ | 15.5 | $ | 20.0 | $ | 8.7 | $ | 4.5 | ||||||||||||||
|
|
|
|
|
|
|
|
|
|
|
|
|
|
|
|||||||||||||||
| Net Performance Fees |
$ | 24.3 | $ | 10.7 | $ | 3.2 | $ | 17.6 | $ | 4.4 | $ | (19.9 | ) | $ | (13.2 | ) | ||||||||||||
|
|
|
|
|
|
|
|
|
|
|
|
|
|
|
|||||||||||||||
| Realized Net Performance Fees |
$ | 26.9 | $ | 6.8 | $ | 66.7 | $ | 14.6 | $ | 0.6 | $ | (26.3 | ) | $ | (14.0 | ) | ||||||||||||
|
|
|
|
|
|
|
|
|
|
|
|
|
|
|
|||||||||||||||
| Investment Income |
$ | 7.8 | $ | 1.0 | $ | 4.6 | $ | 5.0 | $ | 7.6 | $ | (0.2 | ) | $ | 2.6 | |||||||||||||
|
|
|
|
|
|
|
|
|
|
|
|
|
|
|
|||||||||||||||
| Distributable Earnings |
$ | 43.2 | $ | 32.4 | $ | 90.4 | $ | 31.4 | $ | 23.4 | $ | (19.8 | ) | $ | (8.0 | ) | ||||||||||||
|
|
|
|
|
|
|
|
|
|
|
|
|
|
|
|||||||||||||||
Page | 18
Real Assets Segment Results (Unaudited)
| Three Months Ended | ||||||||||||||||||||||||||||
| Jun 30, 2012 vs. | ||||||||||||||||||||||||||||
| Jun
30, 2011 |
Sep
30, 2011 |
Dec
31, 2011 |
Mar
31, 2012 |
Jun
30, 2012 |
Jun 30, 2011 | Mar 31, 2012 | ||||||||||||||||||||||
| $ | $ | |||||||||||||||||||||||||||
| (Dollars in millions) | ||||||||||||||||||||||||||||
| Real Assets |
||||||||||||||||||||||||||||
| Revenues |
||||||||||||||||||||||||||||
| Segment fee revenues |
||||||||||||||||||||||||||||
| Fund management fees |
$ | 40.3 | $ | 37.2 | $ | 35.8 | $ | 36.6 | $ | 34.1 | $ | (6.2 | ) | $ | (2.5 | ) | ||||||||||||
| Portfolio advisory fees, net |
0.7 | 1.9 | 0.6 | 0.3 | 1.6 | 0.9 | 1.3 | |||||||||||||||||||||
| Transaction fees, net |
— | 1.6 | 1.6 | 1.1 | 2.1 | 2.1 | 1.0 | |||||||||||||||||||||
|
|
|
|
|
|
|
|
|
|
|
|
|
|
|
|||||||||||||||
| Total fee revenues |
41.0 | 40.7 | 38.0 | 38.0 | 37.8 | (3.2 | ) | (0.2 | ) | |||||||||||||||||||
| Performance fees |
||||||||||||||||||||||||||||
| Realized |
12.0 | 29.1 | 16.9 | 23.2 | 27.0 | 15.0 | 3.8 | |||||||||||||||||||||
| Unrealized |
19.1 | (78.2 | ) | 50.8 | 82.4 | (56.0 | ) | (75.1 | ) | (138.4 | ) | |||||||||||||||||
|
|
|
|
|
|
|
|
|
|
|
|
|
|
|
|||||||||||||||
| Total performance fees |
31.1 | (49.1 | ) | 67.7 | 105.6 | (29.0 | ) | (60.1 | ) | (134.6 | ) | |||||||||||||||||
| Investment income |
||||||||||||||||||||||||||||
| Realized |
0.7 | 1.8 | (0.2 | ) | — | (0.3 | ) | (1.0 | ) | (0.3 | ) | |||||||||||||||||
| Unrealized |
(0.2 | ) | (0.7 | ) | (0.8 | ) | 3.0 | 1.5 | 1.7 | (1.5 | ) | |||||||||||||||||
|
|
|
|
|
|
|
|
|
|
|
|
|
|
|
|||||||||||||||
| Total investment income |
0.5 | 1.1 | (1.0 | ) | 3.0 | 1.2 | 0.7 | (1.8 | ) | |||||||||||||||||||
| Interest and other income |
2.1 | (0.5 | ) | (0.2 | ) | 0.4 | 0.4 | (1.7 | ) | — | ||||||||||||||||||
|
|
|
|
|
|
|
|
|
|
|
|
|
|
|
|||||||||||||||
| Total revenues |
74.7 | (7.8 | ) | 104.5 | 147.0 | 10.4 | (64.3 | ) | (136.6 | ) | ||||||||||||||||||
| Expenses |
||||||||||||||||||||||||||||
| Compensation and benefits |
||||||||||||||||||||||||||||
| Direct base compensation |
19.8 | 19.4 | 17.0 | 18.2 | 16.9 | (2.9 | ) | (1.3 | ) | |||||||||||||||||||
| Indirect base compensation |
8.7 | 6.7 | 5.3 | 6.4 | 5.6 | (3.1 | ) | (0.8 | ) | |||||||||||||||||||
| Equity-based compensation |
— | — | — | — | 0.1 | 0.1 | 0.1 | |||||||||||||||||||||
| Performance fee related |
||||||||||||||||||||||||||||
| Realized |
4.6 | 2.4 | 0.3 | 0.9 | 1.5 | (3.1 | ) | 0.6 | ||||||||||||||||||||
| Unrealized |
(4.6 | ) | (4.3 | ) | 0.5 | 5.9 | 2.1 | 6.7 | (3.8 | ) | ||||||||||||||||||
|
|
|
|
|
|
|
|
|
|
|
|
|
|
|
|||||||||||||||
| Total compensation and benefits |
28.5 | 24.2 | 23.1 | 31.4 | 26.2 | (2.3 | ) | (5.2 | ) | |||||||||||||||||||
| General, administrative, and other indirect expenses |
12.5 | 12.8 | 15.2 | 12.7 | 11.8 | (0.7 | ) | (0.9 | ) | |||||||||||||||||||
| Interest expense |
2.9 | 2.9 | 2.3 | 1.9 | 1.1 | (1.8 | ) | (0.8 | ) | |||||||||||||||||||
|
|
|
|
|
|
|
|
|
|
|
|
|
|
|
|||||||||||||||
| Total expenses |
43.9 | 39.9 | 40.6 | 46.0 | 39.1 | (4.8 | ) | (6.9 | ) | |||||||||||||||||||
|
|
|
|
|
|
|
|
|
|
|
|
|
|
|
|||||||||||||||
| Economic Net Income |
$ | 30.8 | $ | (47.7 | ) | $ | 63.9 | $ | 101.0 | $ | (28.7 | ) | $ | (59.5 | ) | $ | (129.7 | ) | ||||||||||
|
|
|
|
|
|
|
|
|
|
|
|
|
|
|
|||||||||||||||
| Fee Related Earnings |
$ | (0.8 | ) | $ | (1.6 | ) | $ | (2.0 | ) | $ | (0.8 | ) | $ | 2.7 | $ | 3.5 | $ | 3.5 | ||||||||||
|
|
|
|
|
|
|
|
|
|
|
|
|
|
|
|||||||||||||||
| Net Performance Fees |
$ | 31.1 | $ | (47.2 | ) | $ | 66.9 | $ | 98.8 | $ | (32.6 | ) | $ | (63.7 | ) | $ | (131.4 | ) | ||||||||||
|
|
|
|
|
|
|
|
|
|
|
|
|
|
|
|||||||||||||||
| Realized Net Performance Fees |
$ | 7.4 | $ | 26.7 | $ | 16.6 | $ | 22.3 | $ | 25.5 | $ | 18.1 | $ | 3.2 | ||||||||||||||
|
|
|
|
|
|
|
|
|
|
|
|
|
|
|
|||||||||||||||
| Investment Income |
$ | 0.5 | $ | 1.1 | $ | (1.0 | ) | $ | 3.0 | $ | 1.2 | $ | 0.7 | $ | (1.8 | ) | ||||||||||||
|
|
|
|
|
|
|
|
|
|
|
|
|
|
|
|||||||||||||||
| Distributable Earnings |
$ | 7.3 | $ | 26.9 | $ | 14.4 | $ | 21.5 | $ | 27.9 | $ | 20.6 | $ | 6.4 | ||||||||||||||
|
|
|
|
|
|
|
|
|
|
|
|
|
|
|
|||||||||||||||
Page | 19
Fund of Funds Solutions Segment Results (Unaudited)
| Three Months Ended |
||||||||||||||||||||||||
| Jun 30, 2012 vs. | ||||||||||||||||||||||||
| Jun 30, |
Sep 30, 2011 |
Dec 31, 2011 |
Mar 31, 2012 |
Jun 30, 2012 |
Jun 30, 2011 |
Mar 31, 2012 | ||||||||||||||||||
| $ |
$ | |||||||||||||||||||||||
| (Dollars in millions) | ||||||||||||||||||||||||
| Fund of Funds Solutions |
||||||||||||||||||||||||
| Revenues |
||||||||||||||||||||||||
| Segment fee revenues |
||||||||||||||||||||||||
| Fund management fees |
n/a | $ | 18.7 | $ | 16.3 | $ | 16.3 | $ | 17.4 | n/a | $ | 1.1 | ||||||||||||
| Portfolio advisory fees, net |
n/a | — | — | — | — | n/a | — | |||||||||||||||||
| Transaction fees, net |
n/a | — | — | — | — | n/a | — | |||||||||||||||||
|
|
|
|
|
|
|
|
|
|
|
|
|
|||||||||||||
| Total fee revenues |
n/a | 18.7 | 16.3 | 16.3 | 17.4 | n/a | 1.1 | |||||||||||||||||
| Performance fees |
||||||||||||||||||||||||
| Realized |
n/a | 19.2 | 27.0 | 3.2 | 1.4 | n/a | (1.8 | ) | ||||||||||||||||
| Unrealized |
n/a | (22.5 | ) | (32.9 | ) | 13.3 | 10.6 | n/a | (2.7 | ) | ||||||||||||||
|
|
|
|
|
|
|
|
|
|
|
|
|
|||||||||||||
| Total performance fees |
n/a | (3.3 | ) | (5.9 | ) | 16.5 | 12.0 | n/a | (4.5 | ) | ||||||||||||||
| Investment income |
||||||||||||||||||||||||
| Realized |
n/a | — | — | — | — | n/a | — | |||||||||||||||||
| Unrealized |
n/a | — | — | — | — | n/a | — | |||||||||||||||||
|
|
|
|
|
|
|
|
|
|
|
|
|
|||||||||||||
| Total investment income |
n/a | — | — | — | — | n/a | — | |||||||||||||||||
| Interest and other income |
n/a | 0.2 | 0.1 | 0.2 | 0.1 | n/a | (0.1 | ) | ||||||||||||||||
|
|
|
|
|
|
|
|
|
|
|
|
|
|||||||||||||
| Total revenues |
n/a | 15.6 | 10.5 | 33.0 | 29.5 | n/a | (3.5 | ) | ||||||||||||||||
| Expenses |
||||||||||||||||||||||||
| Compensation and benefits |
||||||||||||||||||||||||
| Direct base compensation |
n/a | 8.1 | 6.2 | 8.0 | 8.9 | n/a | 0.9 | |||||||||||||||||
| Indirect base compensation |
n/a | — | — | 1.0 | 2.0 | 1.0 | ||||||||||||||||||
| Equity-based compensation |
n/a | — | — | — | — | — | ||||||||||||||||||
| Performance fee related |
||||||||||||||||||||||||
| Realized |
n/a | 15.3 | 24.2 | 2.8 | 1.3 | n/a | (1.5 | ) | ||||||||||||||||
| Unrealized |
n/a | (18.0 | ) | (30.8 | ) | 10.0 | 9.4 | n/a | (0.6 | ) | ||||||||||||||
|
|
|
|
|
|
|
|
|
|
|
|
|
|||||||||||||
| Total compensation and benefits |
n/a | 5.4 | (0.4 | ) | 21.8 | 21.6 | n/a | (0.2 | ) | |||||||||||||||
| General, administrative, and other indirect expenses |
n/a | 3.0 | 4.5 | 1.8 | 3.3 | n/a | 1.5 | |||||||||||||||||
| Interest expense |
n/a | — | — | 0.3 | 0.6 | n/a | 0.3 | |||||||||||||||||
|
|
|
|
|
|
|
|
|
|
|
|
|
|||||||||||||
| Total expenses |
n/a | 8.4 | 4.1 | 23.9 | 25.5 | n/a | 1.6 | |||||||||||||||||
|
|
|
|
|
|
|
|
|
|
|
|
|
|||||||||||||
| Economic Net Income |
n/a | $ | 7.2 | $ | 6.4 | $ | 9.1 | $ | 4.0 | n/a | $ | (5.1 | ) | |||||||||||
|
|
|
|
|
|
|
|
|
|
|
|
|
|||||||||||||
| Fee Related Earnings |
n/a | $ | 7.8 | $ | 5.7 | $ | 5.4 | $ | 2.7 | n/a | $ | (2.7 | ) | |||||||||||
|
|
|
|
|
|
|
|
|
|
|
|
|
|||||||||||||
| Net Performance Fees |
n/a | $ | (0.6 | ) | $ | 0.7 | $ | 3.7 | $ | 1.3 | n/a | $ | (2.4 | ) | ||||||||||
|
|
|
|
|
|
|
|
|
|
|
|
|
|||||||||||||
| Realized Net Performance Fees |
n/a | $ | 3.9 | $ | 2.8 | $ | 0.4 | $ | 0.1 | n/a | $ | (0.3 | ) | |||||||||||
|
|
|
|
|
|
|
|
|
|
|
|
|
|||||||||||||
| Investment Income |
n/a | $ | — | $ | — | $ | — | $ | — | n/a | $ | — | ||||||||||||
|
|
|
|
|
|
|
|
|
|
|
|
|
|||||||||||||
| Distributable Earnings |
n/a | $ | 11.7 | $ | 8.5 | $ | 5.8 | $ | 2.8 | n/a | $ | (3.0 | ) | |||||||||||
|
|
|
|
|
|
|
|
|
|
|
|
|
|||||||||||||
Page | 20
Total Assets Under Management Roll Forward (Unaudited)
| Corporate Private Equity | Global Market Strategies (8) | Real Assets | Fund of Funds (7) | Total | ||||||||||||||||||||||||||||||||||||||||||||||||||||||||
| Available Capital |
Fair Value of Capital |
Total AUM |
Available Capital |
Fair Value of Capital |
Total AUM |
Available Capital |
Fair Value of Capital |
Total AUM |
Available Capital |
Fair Value of Capital |
Total AUM |
Available Capital |
Fair Value of Capital |
Total AUM |
||||||||||||||||||||||||||||||||||||||||||||||
| (USD in millions) |
||||||||||||||||||||||||||||||||||||||||||||||||||||||||||||
| Balance, As of March 31, 2012 |
$ | 13,362 | $ | 39,902 | $ | 53,264 | $ | 1,116 | $ | 27,176 | $ | 28,292 | $ | 7,770 | $ | 24,472 | $ | 32,242 | $ | 17,636 | $ | 27,788 | $ | 45,424 | $ | 39,884 | $ | 119,338 | $ | 159,222 | ||||||||||||||||||||||||||||||
| Acquisitions |
— | — | — | — | — | — | — | — | — | — | — | — | — | — | — | |||||||||||||||||||||||||||||||||||||||||||||
| Commitments (1) |
2,274 | — | 2,274 | 302 | — | 302 | 87 | — | 87 | (10 | ) | — | (10 | ) | 2,653 | — | 2,653 | |||||||||||||||||||||||||||||||||||||||||||
| Capital Called, net (2) |
(348 | ) | 242 | (106 | ) | (155 | ) | 138 | (17 | ) | (879 | ) | 817 | (62 | ) | (841 | ) | 789 | (52 | ) | (2,223 | ) | 1,986 | (237 | ) | |||||||||||||||||||||||||||||||||||
| Distributions (3) |
109 | (2,042 | ) | (1,933 | ) | 18 | (133 | ) | (115 | ) | 133 | (1,481 | ) | (1,348 | ) | 106 | (1,520 | ) | (1,414 | ) | 366 | (5,176 | ) | (4,810 | ) | |||||||||||||||||||||||||||||||||||
| Subscriptions, net of Redemptions (4) |
— | — | — | — | 659 | 659 | — | — | — | — | — | — | — | 659 | 659 | |||||||||||||||||||||||||||||||||||||||||||||
| Changes in CLO collateral balances |
— | — | — | — | 114 | 114 | — | — | — | — | — | — | — | 114 | 114 | |||||||||||||||||||||||||||||||||||||||||||||
| Market Appreciation/(Depreciation) (5) |
— | (509 | ) | (509 | ) | — | 149 | 149 | — | (713 | ) | (713 | ) | — | 1,630 | 1,630 | — | 557 | 557 | |||||||||||||||||||||||||||||||||||||||||
| Foreign exchange (6) |
(105 | ) | (361 | ) | (466 | ) | — | (338 | ) | (338 | ) | (52 | ) | (150 | ) | (202 | ) | (523 | ) | (471 | ) | (994 | ) | (680 | ) | (1,320 | ) | (2,000 | ) | |||||||||||||||||||||||||||||||
|
|
|
|
|
|
|
|
|
|
|
|
|
|
|
|
|
|
|
|
|
|
|
|
|
|
|
|
|
|
|
|||||||||||||||||||||||||||||||
| Balance, As of June 30, 2012 |
$ | 15,292 | $ | 37,232 | $ | 52,524 | $ | 1,281 | $ | 27,765 | $ | 29,046 | $ | 7,059 | $ | 22,945 | $ | 30,004 | $ | 16,368 | $ | 28,216 | $ | 44,584 | $ | 40,000 | $ | 116,158 | $ | 156,158 | ||||||||||||||||||||||||||||||
|
|
|
|
|
|
|
|
|
|
|
|
|
|
|
|
|
|
|
|
|
|
|
|
|
|
|
|
|
|
|
|||||||||||||||||||||||||||||||
| Balance, As of December 31, 2011 |
$ | 13,328 | $ | 37,737 | $ | 51,065 | $ | 1,079 | $ | 23,434 | $ | 24,513 | $ | 8,278 | $ | 22,394 | $ | 30,672 | $ | 14,840 | $ | 25,879 | $ | 40,719 | $ | 37,525 | $ | 109,444 | $ | 146,969 | ||||||||||||||||||||||||||||||
| Acquisitions |
— | — | — | — | 2,903 | 2,903 | — | — | — | — | — | — | — | 2,903 | 2,903 | |||||||||||||||||||||||||||||||||||||||||||||
| Commitments (1) |
2,588 | — | 2,588 | 414 | — | 414 | 141 | — | 141 | 3,283 | — | 3,283 | 6,426 | — | 6,426 | |||||||||||||||||||||||||||||||||||||||||||||
| Capital Called, net (2) |
(993 | ) | 761 | (232 | ) | (231 | ) | 203 | (28 | ) | (1,768 | ) | 1,805 | 37 | (1,714 | ) | 1,857 | 143 | (4,706 | ) | 4,626 | (80 | ) | |||||||||||||||||||||||||||||||||||||
| Distributions (3) |
424 | (3,570 | ) | (3,146 | ) | 19 | (500 | ) | (481 | ) | 425 | (2,653 | ) | (2,228 | ) | 170 | (2,801 | ) | (2,631 | ) | 1,038 | (9,524 | ) | (8,486 | ) | |||||||||||||||||||||||||||||||||||
| Subscriptions, net of Redemptions (4) |
— | — | — | — | 1,369 | 1,369 | — | — | — | — | — | — | — | 1,369 | 1,369 | |||||||||||||||||||||||||||||||||||||||||||||
| Changes in CLO collateral balances |
— | — | — | — | 358 | 358 | — | — | — | — | — | — | — | 358 | 358 | |||||||||||||||||||||||||||||||||||||||||||||
| Market Appreciation/(Depreciation) (5) |
— | 2,515 | 2,515 | — | 239 | 239 | — | 1,446 | 1,446 | — | 2,927 | 2,927 | — | 7,127 | 7,127 | |||||||||||||||||||||||||||||||||||||||||||||
| Foreign exchange (6) |
(55 | ) | (211 | ) | (266 | ) | — | (241 | ) | (241 | ) | (17 | ) | (47 | ) | (64 | ) | (211 | ) | 354 | 143 | (283 | ) | (145 | ) | (428 | ) | |||||||||||||||||||||||||||||||||
|
|
|
|
|
|
|
|
|
|
|
|
|
|
|
|
|
|
|
|
|
|
|
|
|
|
|
|
|
|
|
|||||||||||||||||||||||||||||||
| Balance, As of June 30, 2012 |
$ | 15,292 | $ | 37,232 | $ | 52,524 | $ | 1,281 | $ | 27,765 | $ | 29,046 | $ | 7,059 | $ | 22,945 | $ | 30,004 | $ | 16,368 | $ | 28,216 | $ | 44,584 | $ | 40,000 | $ | 116,158 | $ | 156,158 | ||||||||||||||||||||||||||||||
|
|
|
|
|
|
|
|
|
|
|
|
|
|
|
|
|
|
|
|
|
|
|
|
|
|
|
|
|
|
|
|||||||||||||||||||||||||||||||
| (1) | Represents capital raised by our carry funds and fund of funds vehicles, net of expired available capital. |
| (2) | Represents capital called by our carry funds and fund of funds vehicles, net of fund fees and expenses. Equity Invested amounts may vary from Capital Called due to timing differences between investment acquisition and capital call dates. |
| (3) | Represents distributions from our carry funds and fund of funds vehicles, net of amounts recycled. Distributions are based on when proceeds are actually distributed to investors, which may differ from when they are realized. |
| (4) | Represents the net result of subscriptions to and redemptions from our hedge funds and open-end structured credit funds. |
| (5) | Market Appreciation/(Depreciation) represents realized and unrealized gains (losses) on portfolio investments and changes in the net asset value of our hedge funds. |
| (6) | Represents the impact of foreign exchange rate fluctuations on the translation of our non-U.S. dollar denominated funds. Activity during the period is translated at the average rate for the period. Ending balances are translated at the spot rate as of the period end. |
| (7) | The fair market values for AlpInvest primary fund investments and secondary investment funds are based on the latest available valuations of the underlying limited partnership interests (in most cases as of March 31, 2012) as provided by their general partners, plus the net cash flows since the latest valuation, up to June 30, 2012. |
| (8) | Ending balance is comprised of approximately $16.2 billion from our structured credit funds (including $0.1 billion of Available Capital), $9.6 billion in our hedge funds, and $3.3 billion (including $1.2 billion of Available Capital) in our carry funds. |
Page | 21
Fee Earning Assets Under Management Roll Forward (Unaudited)
| For the Three Months Ended June 30, 2012 | ||||||||||||||||||||
| (USD in millions) | Corporate Private Equity |
Global Market Strategies |
Real Assets(6) | Fund of Funds Solutions |
Total | |||||||||||||||
| Fee-Earning AUM |
||||||||||||||||||||
| Balance, Beginning of Period |
$ | 37,833 | $ | 26,803 | $ | 22,848 | $ | 29,514 | $ | 116,998 | ||||||||||
| Acquisitions |
— | — | — | — | — | |||||||||||||||
| Inflows, including Commitments(1) |
276 | 309 | 340 | 679 | 1,604 | |||||||||||||||
| Outflows, including Distributions(2) |
(584 | ) | (51 | ) | (3,514 | ) | (1,607 | ) | (5,756 | ) | ||||||||||
| Subscriptions, net of Redemptions(3) |
— | 654 | — | — | 654 | |||||||||||||||
| Changes in CLO collateral balances |
— | 270 | — | — | 270 | |||||||||||||||
| Market Appreciation/(Depreciation)(4) |
— | 85 | — | 248 | 333 | |||||||||||||||
| Foreign exchange and other(5) |
(396 | ) | (330 | ) | (146 | ) | (1,258 | ) | (2,130 | ) | ||||||||||
|
|
|
|
|
|
|
|
|
|
|
|||||||||||
| Balance, End of Period |
$ | 37,129 | $ | 27,740 | $ | 19,528 | $ | 27,576 | $ | 111,973 | ||||||||||
|
|
|
|
|
|
|
|
|
|
|
|||||||||||
| For the Six Months Ended June 30, 2012 | ||||||||||||||||||||
| (USD in millions) | Corporate Private Equity |
Global Market Strategies |
Real Assets(6) | Fund
of Funds Solutions |
Total | |||||||||||||||
| Fee-Earning AUM |
||||||||||||||||||||
| Balance, Beginning of Period |
$ | 37,996 | $ | 23,186 | $ | 22,172 | $ | 27,671 | $ | 111,025 | ||||||||||
| Acquisitions |
— | 2,866 | — | — | 2,866 | |||||||||||||||
| Inflows, including Commitments(1) |
413 | 502 | 1,177 | 3,198 | 5,290 | |||||||||||||||
| Outflows, including Distributions(2) |
(1,038 | ) | (382 | ) | (3,779 | ) | (3,617 | ) | (8,816 | ) | ||||||||||
| Subscriptions, net of Redemptions(3) |
— | 1,371 | — | — | 1,371 | |||||||||||||||
| Changes in CLO collateral balances |
— | 504 | — | — | 504 | |||||||||||||||
| Market Appreciation/(Depreciation)(4) |
— | (69 | ) | — | 679 | 610 | ||||||||||||||
| Foreign exchange and other(5) |
(242 | ) | (238 | ) | (42 | ) | (355 | ) | (877 | ) | ||||||||||
|
|
|
|
|
|
|
|
|
|
|
|||||||||||
| Balance, End of Period |
$ | 37,129 | $ | 27,740 | $ | 19,528 | $ | 27,576 | $ | 111,973 | ||||||||||
|
|
|
|
|
|
|
|
|
|
|
|||||||||||
| (1) | Inflows represent limited partner capital raised by our carry funds and fund of funds vehicles and capital invested by our carry funds and fund of funds vehicles outside the investment period. |
| (2) | Outflows represent limited partner distributions from our carry funds and fund of funds vehicles and changes in basis for our carry funds and fund of funds vehicles where the investment period has expired. |
| (3) | Represents the net result of subscriptions to and redemptions from our hedge funds and open-end structured credit funds. |
| (4) | Market Appreciation/(Depreciation) represents changes in the net asset value of our hedge funds and of our fund of funds vehicles based on the lower of cost or fair value. |
| (5) | Represents the impact of foreign exchange rate fluctuations on the translation of our non-U.S. dollar denominated funds. Activity during the period is translated at the average rate for the period. Ending balances are translated at the spot rate as of the period end. |
| (6) | Carlyle/Riverstone Global Energy and Power, L.P., Carlyle/Riverstone Global Energy and Power II, L.P. Carlyle/Riverstone Global Energy and Power III, L.P., Riverstone/Carlyle Global Energy and Power IV, L.P., Carlyle/Riverstone Renewable Energy Infrastructure, L.P. and Riverstone/Carlyle Renewable Energy Infrastructure II, L.P. (collectively, the “Energy Funds”), are managed with Riverstone Holdings LLC and its affiliates. Affiliates of both Carlyle and Riverstone act as investment advisers to each of the Energy Funds. With the exception of Riverstone/Carlyle Global Energy and Power IV, L.P. and Riverstone/Carlyle Renewable Energy Infrastructure II, L.P., where Carlyle has a minority representation on the funds’ management committees, management of each of the Energy Funds is vested in committees with equal representation by Carlyle and Riverstone, and the consent of representatives of both Carlyle and Riverstone are required for investment decisions. As of June 30, 2012, the Energy Funds had, in the aggregate, approximately $16 billion in AUM and $9 billion in fee-earning AUM, respectively. |
Page | 22
Corporate Private Equity and Real Assets Fund Performance (Unaudited)
The fund return information reflected in this discussion and analysis is not indicative of the performance of The Carlyle Group L.P. and is also not necessarily indicative of the future performance of any particular fund. An investment in The Carlyle Group L.P. is not an investment in any of our funds. There can be no assurance that any of our funds or our other existing and future funds will achieve similar returns.
| TOTAL INVESTMENTS | REALIZED/PARTIALLY
REALIZED INVESTMENTS(5) |
|||||||||||||||||||||||||||||||||||||||||||
| as of June 30, 2012 | as of June 30, 2012 | |||||||||||||||||||||||||||||||||||||||||||
| Fund Inception Date(1) |
Committed Capital |
Cumulative Invested Capital(2) |
Total Fair Value(3) |
MOIC(4) | Gross IRR(7) |
Net IRR(8) |
Cumulative Invested Capital(2) |
Total Fair Value(3) |
MOIC(4) | Gross IRR(7) |
||||||||||||||||||||||||||||||||||
| (Reported in Local Currency, in Millions) | (Reported in Local Currency, in Millions) | |||||||||||||||||||||||||||||||||||||||||||
| Corporate Private Equity |
||||||||||||||||||||||||||||||||||||||||||||
| Fully InvestedFunds(6) |
|
|||||||||||||||||||||||||||||||||||||||||||
| CP II |
10/1994 | $ | 1,331.1 | $ | 1,362.4 | $ | 4,070.5 | 3.0x | 34 | % | 25 | % | $ | 1,362.4 | $ | 4,070.5 | 3.0x | 34 | % | |||||||||||||||||||||||||
| CP III |
2/2000 | $ | 3,912.7 | $ | 4,031.6 | $ | 10,093.6 | 2.5x | 27 | % | 21 | % | $ | 3,851.7 | $ | 9,915.5 | 2.6x | 27 | % | |||||||||||||||||||||||||
| CP IV |
12/2004 | $ | 7,850.0 | $ | 7,612.6 | $ | 14,605.1 | 1.9x | 15 | % | 12 | % | $ | 3,569.1 | $ | 9,040.5 | 2.5x | 24 | % | |||||||||||||||||||||||||
| CEP I |
12/1997 | € | 1,003.6 | € | 972.0 | € | 2,119.5 | 2.2x | 18 | % | 11 | % | € | 972.0 | € | 2,119.5 | 2.2x | 18 | % | |||||||||||||||||||||||||
| CEP II |
9/2003 | € | 1,805.4 | € | 2,046.5 | € | 3,672.2 | 1.8x | 39 | % | 21 | % | € | 1,016.5 | € | 2,739.3 | 2.7x | 72 | % | |||||||||||||||||||||||||
| CAP I |
12/1998 | $ | 750.0 | $ | 627.7 | $ | 2,448.6 | 3.9x | 25 | % | 18 | % | $ | 627.7 | $ | 2,448.6 | 3.9x | 25 | % | |||||||||||||||||||||||||
| CAP II |
2/2006 | $ | 1,810.0 | $ | 1,611.3 | $ | 2,524.6 | 1.6x | 11 | % | 8 | % | $ | 390.1 | $ | 1,294.5 | 3.3x | 33 | % | |||||||||||||||||||||||||
| CJP I |
10/2001 | ¥ | 50,000.0 | ¥ | 47,291.4 | ¥ | 120,941.7 | 2.6x | 61 | % | 37 | % | ¥ | 30,009.4 | ¥ | 104,486.3 | 3.5x | 72 | % | |||||||||||||||||||||||||
| All Other Funds(9) |
Various | $ | 2,828.7 | $ | 4,144.8 | 1.5x | 18 | % | 6 | % | $ | 1,964.8 | $ | 3,281.6 | 1.7x | 22 | % | |||||||||||||||||||||||||||
| Coinvestments and Other(10) |
Various | $ | 6,660.0 | $ | 16,219.5 | 2.4x | 36 | % | 33 | % | $ | 4,263.6 | $ | 13,183.6 | 3.1x | 36 | % | |||||||||||||||||||||||||||
|
|
|
|
|
|
|
|
|
|
|
|
|
|
|
|
|
|
|
|||||||||||||||||||||||||||
| Total Fully Invested Funds |
$ | 29,145.2 | $ | 62,948.6 | 2.2x | 28 | % | 21 | % | $ | 18,920.8 | $ | 50,690.6 | 2.7x | 31 | % | ||||||||||||||||||||||||||||
|
|
|
|
|
|
|
|
|
|
|
|
|
|
|
|
|
|
|
|||||||||||||||||||||||||||
| Funds in the Investment Period(6) |
||||||||||||||||||||||||||||||||||||||||||||
| CP V |
5/2007 | $ | 13,719.7 | $ | 9,219.7 | $ | 12,984.2 | 1.4x | 14 | % | 9 | % | ||||||||||||||||||||||||||||||||
| CEP III |
12/2006 | € | 5,294.9 | € | 4,072.4 | € | 4,806.8 | 1.2x | 7 | % | 3 | % | ||||||||||||||||||||||||||||||||
| CAP III |
5/2008 | $ | 2,551.6 | $ | 1,637.2 | $ | 1,675.7 | 1.0x | 1 | % | -5 | % | ||||||||||||||||||||||||||||||||
| CJP II |
7/2006 | ¥ | 165,600.0 | ¥ | 119,539.7 | ¥ | 124,415.7 | 1.0x | 1 | % | -4 | % | ||||||||||||||||||||||||||||||||
| CGFSP I |
9/2008 | $ | 1,100.2 | $ | 798.4 | $ | 1,044.7 | 1.3x | 16 | % | 8 | % | ||||||||||||||||||||||||||||||||
| CAGP IV |
6/2008 | $ | 1,041.4 | $ | 421.8 | $ | 524.3 | 1.2x | 14 | % | 1 | % | ||||||||||||||||||||||||||||||||
| All Other Funds(11) |
Various | $ | 1,501.8 | $ | 1,957.5 | 1.3x | 12 | % | 4 | % | ||||||||||||||||||||||||||||||||||
|
|
|
|
|
|
|
|
|
|
|
|||||||||||||||||||||||||||||||||||
| Total Funds in the Investment Period |
$ | 20,228.4 | $ | 25,826.1 | 1.3x | 11 | % | 5 | % | |||||||||||||||||||||||||||||||||||
|
|
|
|
|
|
|
|
|
|
|
|
|
|
|
|
|
|
|
|||||||||||||||||||||||||||
| TOTAL CORPORATE PRIVATE EQUITY(12) |
$ | 49,373.7 | $ | 88,774.7 | 1.8x | 26 | % | 18 | % | $ | 22,204.3 | $ | 56,331.3 | 2.5x | 31 | % | ||||||||||||||||||||||||||||
|
|
|
|
|
|
|
|
|
|
|
|
|
|
|
|
|
|
|
|||||||||||||||||||||||||||
| TOTAL INVESTMENTS | REALIZED/PARTIALLY REALIZED INVESTMENTS(5) |
|||||||||||||||||||||||||||||||||||||||||||
| as of June 30, 2012 | as of June 30, 2012 | |||||||||||||||||||||||||||||||||||||||||||
| Fund Inception Date(1) |
Committed Capital |
Cumulative Invested Capital(2) |
Total Fair Value(3) |
MOIC (4) |
Gross IRR(7) |
Net IRR(8) |
Cumulative Invested Capital(2) |
Total Fair Value(3) |
MOIC(4) | Gross IRR(7) |
||||||||||||||||||||||||||||||||||
| (Reported in Local Currency, in Millions) | (Reported in Local Currency, in Millions) | |||||||||||||||||||||||||||||||||||||||||||
| Real Assets |
||||||||||||||||||||||||||||||||||||||||||||
| Fully Invested Funds(6) |
||||||||||||||||||||||||||||||||||||||||||||
| CRP III |
11/2000 | $ | 564.1 | $ | 522.5 | $ | 1,326.0 | 2.5x | 44 | % | 30 | % | $ | 492.1 | $ | 1,297.5 | 2.6x | 46 | % | |||||||||||||||||||||||||
| CRP IV |
12/2004 | $ | 950.0 | $ | 1,186.1 | $ | 1,085.8 | 0.9x | -3 | % | -7 | % | $ | 373.3 | $ | 468.2 | 1.3x | 16 | % | |||||||||||||||||||||||||
| CRP V |
11/2006 | $ | 3,000.0 | $ | 3,122.5 | $ | 3,906.5 | 1.3x | 8 | % | 5 | % | $ | 1,486.4 | $ | 1,773.7 | 1.2x | 8 | % | |||||||||||||||||||||||||
| CEREP I |
3/2002 | € | 426.6 | € | 517.0 | € | 741.6 | 1.4x | 13 | % | 7 | % | € | 441.2 | € | 695.0 | 1.6x | 19 | % | |||||||||||||||||||||||||
| CEREP II |
4/2005 | € | 762.7 | € | 826.9 | € | 330.3 | 0.4x | -22 | % | -22 | % | € | 329.3 | € | 146.6 | 0.4x | -21 | % | |||||||||||||||||||||||||
| CEREP III |
5/2007 | € | 2,229.5 | € | 1,475.0 | € | 1,705.0 | 1.2x | 6 | % | 0 | % | € | — | € | 3.5 | n/a | n/a | ||||||||||||||||||||||||||
| Energy II |
7/2002 | $ | 1,100.0 | $ | 1,313.8 | $ | 3,628.9 | 2.8x | 82 | % | 55 | % | $ | 827.4 | $ | 3,308.4 | 4.0x | 107 | % | |||||||||||||||||||||||||
| Energy III |
10/2005 | $ | 3,800.0 | $ | 3,467.2 | $ | 6,715.5 | 1.9x | 17 | % | 13 | % | $ | 1,493.9 | $ | 4,177.4 | 2.8x | 29 | % | |||||||||||||||||||||||||
| Energy IV |
12/2007 | $ | 5,979.1 | $ | 4,698.3 | $ | 7,559.7 | 1.6x | 26 | % | 17 | % | $ | 1,345.8 | $ | 2,688.5 | 2.0x | 28 | % | |||||||||||||||||||||||||
| All Other Funds(13) |
Various | $ | 1,726.4 | $ | 1,768.5 | 1.0x | 2 | % | -6 | % | $ | 1,286.8 | $ | 1,544.8 | 1.2x | 10 | % | |||||||||||||||||||||||||||
| Coinvestments and Other(10) |
Various | $ | 3,940.0 | $ | 6,655.8 | 1.7x | 21 | % | 17 | % | $ | 1,520.7 | $ | 3,731.7 | 2.5x | 31 | % | |||||||||||||||||||||||||||
|
|
|
|
|
|
|
|
|
|
|
|
|
|
|
|
|
|
|
|||||||||||||||||||||||||||
| Total Fully Invested Funds |
$ | 23,542.9 | $ | 36,159.5 | 1.5x | 18 | % | 11 | % | $ | 9,801.1 | $ | 20,059.2 | 2.0x | 29 | % | ||||||||||||||||||||||||||||
|
|
|
|
|
|
|
|
|
|
|
|
|
|
|
|
|
|
|
|||||||||||||||||||||||||||
| Funds in the Investment Period(6) |
||||||||||||||||||||||||||||||||||||||||||||
| CRP VI(14) |
9/2010 | $ | 2,340.0 | $ | 499.5 | $ | 536.7 | 1.1x | n/m | n/m | ||||||||||||||||||||||||||||||||||
| CIP |
9/2006 | $ | 1,143.7 | $ | 733.1 | $ | 740.3 | 1.0x | 0 | % | -5 | % | ||||||||||||||||||||||||||||||||
| Renew II |
3/2008 | $ | 3,417.5 | $ | 2,417.8 | $ | 3,328.9 | 1.4x | 17 | % | 10 | % | ||||||||||||||||||||||||||||||||
| All Other Funds(15) |
Various | $ | 605.0 | $ | 567.1 | 0.9x | -3 | % | -10 | % | ||||||||||||||||||||||||||||||||||
|
|
|
|
|
|
|
|
|
|
|
|||||||||||||||||||||||||||||||||||
| Total Funds in the Investment Period |
$ | 4,255.5 | $ | 5,107.6 | 1.2x | 11 | % | 4 | % | |||||||||||||||||||||||||||||||||||
|
|
|
|
|
|
|
|
|
|
|
|
|
|
|
|
|
|
|
|||||||||||||||||||||||||||
| TOTAL REAL ASSETS(12) |
$ | 27,798.4 | $ | 41,267.1 | 1.5x | 17 | % | 10 | % | $ | 10,533.2 | $ | 21,008.6 | 2.0x | 28 | % | ||||||||||||||||||||||||||||
|
|
|
|
|
|
|
|
|
|
|
|
|
|
|
|
|
|
|
|||||||||||||||||||||||||||
Page | 23
Global Markets Strategies Carry Funds and Fund of Funds Solutions (Unaudited)
| TOTAL INVESTMENTS | ||||||||||||||||||||||||||||
| as of June 30, 2012 | Inception
to June 30, 2012 |
|||||||||||||||||||||||||||
| Fund Inception Date(1) |
Fund Size | Cumulative Invested Capital(16) |
Total Fair Value(3) |
MOIC(4) | Gross IRR(7) | Net IRR(8) | ||||||||||||||||||||||
| (Reported in Local Currency, in Millions) |
||||||||||||||||||||||||||||
| Global Market Strategies |
||||||||||||||||||||||||||||
| CSP II |
6/2007 | $ | 1,352.3 | $ | 1,352.3 | $ | 2,167.8 | 1.6x | 17 | % | 12 | % | ||||||||||||||||
| TOTAL INVESTMENTS | ||||||||||||||||||||||||||
| as of June 30, 2012 | Inception
to June 30, 2012 |
|||||||||||||||||||||||||
| Vintage Year |
Fund Size |
Cumulative Invested Capital (2)(18) |
Total Fair Value(3)(18) |
MOIC(4) | Gross IRR(7) | Net IRR(8) | ||||||||||||||||||||
| (Reported in Local Currency, in Millions) | ||||||||||||||||||||||||||
| Fund of Funds Solutions(17) |
||||||||||||||||||||||||||
| Fully Committed Funds(6) |
||||||||||||||||||||||||||
| Main Fund I – Fund Investments |
2000 | € | 5,174.6 | € | 3,992.3 | € | 6,391.3 | 1.6x | 13 | % | 12 | % | ||||||||||||||
| Main Fund II – Fund Investments |
2003 | € | 4,545.0 | € | 4,439.9 | € | 6,223.9 | 1.4x | 10 | % | 9 | % | ||||||||||||||
| Main Fund III – Fund Investments |
2005 | € | 11,500.0 | € | 9,396.7 | € | 10,689.7 | 1.1x | 5 | % | 4 | % | ||||||||||||||
| Main Fund I – Secondary Investments |
2002 | € | 519.4 | € | 470.0 | € | 888.0 | 1.9x | 55 | % | 52 | % | ||||||||||||||
| Main Fund II – Secondary Investments |
2003 | € | 998.4 | € | 939.0 | € | 1,662.6 | 1.8x | 28 | % | 27 | % | ||||||||||||||
| Main Fund III – Secondary Investments |
2006 | € | 2,250.0 | € | 2,089.4 | € | 2,704.1 | 1.3x | 9 | % | 9 | % | ||||||||||||||
| Main Fund IV – Secondary Investments |
2010 | € | 1,856.4 | € | 1,537.2 | € | 1,942.7 | 1.3x | 26 | % | 24 | % | ||||||||||||||
| Main Fund II – Co-Investments |
2003 | € | 1,090.0 | € | 885.6 | € | 2,337.4 | 2.6x | 45 | % | 43 | % | ||||||||||||||
| Main Fund III – Co-Investments |
2006 | € | 2,760.0 | € | 2,527.2 | € | 2,547.0 | 1.0x | 0 | % | -1 | % | ||||||||||||||
| Main Fund II – Mezzanine Investments |
2004 | € | 700.0 | € | 712.1 | € | 922.9 | 1.3x | 8 | % | 7 | % | ||||||||||||||
| Main Fund III – Mezzanine Investments |
2006 | € | 2,000.0 | € | 1,348.3 | € | 1,686.2 | 1.3x | 10 | % | 9 | % | ||||||||||||||
| All Other Funds(19) |
Various | € | 1,264.3 | € | 1,879.6 | 1.5x | 19 | % | 15 | % | ||||||||||||||||
|
|
|
|
|
|
|
|
|
|
|
|||||||||||||||||
| Total Fully Committed Funds |
€ | 29,602.0 | € | 39,875.3 | 1.3x | 11 | % | 10 | % | |||||||||||||||||
|
|
|
|
|
|
|
|
|
|
|
|||||||||||||||||
| Funds in the Commitment Period |
||||||||||||||||||||||||||
| Main Fund IV – Fund Investments |
2009 | € | 4,880.0 | € | 931.6 | € | 915.1 | 1.0x | -2 | % | -5 | % | ||||||||||||||
| Main Fund V – Secondary Investments |
2011 | € | 2,377.3 | € | 150.2 | € | 156.0 | 1.0x | 16 | % | 8 | % | ||||||||||||||
| Main Fund IV – Co-Investments |
2010 | € | 1,575.0 | € | 1,057.6 | € | 1,047.9 | 1.0x | -1 | % | -3 | % | ||||||||||||||
| All Other Funds(19) |
Various | € | 31.7 | € | 31.4 | 1.0x | -7 | % | -16 | % | ||||||||||||||||
|
|
|
|
|
|
|
|
|
|
|
|||||||||||||||||
| Total Funds in the Commitment Period |
€ | 2,171.1 | € | 2,150.4 | 1.0x | -1 | % | -3 | % | |||||||||||||||||
|
|
|
|
|
|
|
|
|
|
|
|||||||||||||||||
| TOTAL FUND OF FUNDS SOLUTIONS |
€ | 31,773.1 | € | 42,025.7 | 1.3x | 11 | % | 10 | % | |||||||||||||||||
|
|
|
|
|
|
|
|
|
|
|
|||||||||||||||||
| TOTAL FUND OF FUNDS SOLUTIONS (USD)(20) |
$ | 40,193.7 | $ | 53,163.4 | 1.3x | |||||||||||||||||||||
|
|
|
|
|
|
|
|||||||||||||||||||||
Page | 24
| (1) | The data presented herein that provides “inception to date” performance results of our segments relates to the period following the formation of the first fund within each segment. For our Corporate Private Equity segment our first fund was formed in 1990. For our Real Assets segment our first fund was formed in 1997. For our Global Market Strategies segment, CSP II was formed in 2007. |
| (2) | Represents the original cost of all capital called for investments since inception of the fund. |
| (3) | Represents all realized proceeds combined with remaining fair value, before management fees, expenses and carried interest. |
| (4) | Multiple of invested capital (“MOIC”) represents total fair value, before management fees, expenses and carried interest, divided by cumulative invested capital. |
| (5) | An investment is considered realized when the investment fund has completely exited, and ceases to own an interest in, the investment. An investment is considered partially realized when the total amount of proceeds received in respect of such investment, including dividends, interest or other distributions and/or return of capital, represents at least 85% of invested capital and such investment is not yet fully realized. Because part of our value creation strategy involves pursuing best exit alternatives, we believe information regarding Realized/Partially Realized MOIC and Gross IRR, when considered together with the other investment performance metrics presented, provides investors with meaningful information regarding our investment performance by removing the impact of investments where significant realization activity has not yet occurred. Realized/Partially Realized MOIC and Gross IRR have limitations as measures of investment performance, and should not be considered in isolation. Such limitations include the fact that these measures do not include the performance of earlier stage and other investments that do not satisfy the criteria provided above. The exclusion of such investments will have a positive impact on Realized/Partially Realized MOIC and Gross IRR in instances when the MOIC and Gross IRR in respect of such investments are less than the aggregate MOIC and Gross IRR. Our measurements of Realized/Partially Realized MOIC and Gross IRR may not be comparable to those of other companies that use similarly titled measures. We do not present Realized/Partially Realized performance information separately for funds that are still in the investment period because of the relatively insignificant level of realizations for funds of this type. However, to the extent such funds have had realizations, they are included in the Realized/Partially Realized performance information presented for Total Corporate Private Equity and Total Real Assets. |
| (6) | Fully Invested and Fully Committed funds are past the expiration date of the investment/commitment period as defined in the respective limited partnership agreement. In instances where a successor fund has had its first capital call, the predecessor fund is categorized as fully invested. |
| (7) | Gross Internal Rate of Return (“Gross IRR”) represents the annualized IRR for the period indicated on Limited Partner invested capital based on contributions, distributions and unrealized value before management fees, expenses and carried interest. |
| (8) | Net Internal Rate of Return (“Net IRR”) represents the annualized IRR for the period indicated on Limited Partner invested capital based on contributions, distributions and unrealized value after management fees, expenses and carried interest. |
| (9) | Aggregate includes the following funds: CP I, CMG, CVP I, CVP II, CEVP, CETP I, CAVP I, CAVP II, CAGP III and Mexico. |
| (10) | Includes co-investments, prefund investments and certain other stand-alone investments arranged by us. |
| (11) | Aggregate includes the following funds: MENA, CSABF, CUSGF III, CETP II, CBPF, and CEOF I. |
| (12) | For purposes of aggregation, funds that report in foreign currency have been converted to U.S. dollars at the reporting period spot rate. |
| (13) | Aggregate includes the following funds: CRP I, CRP II, CAREP I, ENERGY I and Renew I. |
| (14) | Gross IRR and Net IRR for CRP VI are not meaningful as the investment period commenced in September 2010. |
| (15) | Aggregate includes the following funds: CAREP II and CRCP I. |
| (16) | Represents the original cost of investments net of investment level recallable proceeds which is adjusted to reflect recyclability of invested capital for the purpose of calculating the fund MOIC. |
| (17) | Includes private equity and mezzanine primary fund investments, secondary fund investments and co-investments originated by the AlpInvest team. |
| (18) | To exclude the impact of FX, all foreign currency cash flows have been converted to Euro at the reporting period spot rate. |
| (19) | Aggregate includes Main Fund I – Co-Investments, Main Fund I – Mezzanine Investments, AlpInvest CleanTech Funds and funds which are not included as part of a main fund. |
| (20) | Represents the U.S. dollar equivalent balance translated at the spot rate as of period end. |
Page | 25
The Carlyle Group L.P.
Pro Forma Consolidated Statement of Operations (Unaudited)
| Pro Forma(1) for the Three Months Ended |
||||
| June 30, 2012 |
||||
| (Dollars in millions, except unit and per unit data) |
||||
| Revenues |
||||
| Fund management fees |
$ | 239.9 | ||
| Performance fees |
||||
| Realized |
116.7 | |||
| Unrealized |
(337.1 | ) | ||
|
|
|
|||
| Total performance fees |
(220.4 | ) | ||
| Investment income |
||||
| Realized |
2.4 | |||
| Unrealized |
4.6 | |||
|
|
|
|||
| Total investment income |
7.0 | |||
| Interest and other income |
2.7 | |||
| Interest and other income of Consolidated Funds |
219.2 | |||
|
|
|
|||
| Total revenues |
248.4 | |||
| Expenses |
||||
| Compensation and benefits |
||||
| Base compensation |
164.5 | |||
| Equity-based compensation |
52.8 | |||
| Performance fee related |
||||
| Realized |
34.2 | |||
| Unrealized |
(111.3 | ) | ||
|
|
|
|||
| Total compensation and benefits |
140.2 | |||
| General, administrative and other expenses |
84.0 | |||
| Interest |
4.6 | |||
| Interest and other expenses of Consolidated Funds |
179.5 | |||
| Other non-operating expense |
0.6 | |||
|
|
|
|||
| Total expenses |
408.9 | |||
| Other income |
||||
| Net investment income (losses) of Consolidated Funds |
386.6 | |||
|
|
|
|||
| Income before provision for income taxes |
226.1 | |||
| Provision for income taxes |
9.9 | |||
|
|
|
|||
| Net income |
216.2 | |||
| Net income attributable to non-controlling interests in consolidated entities |
352.5 | |||
| Net loss attributable to non-controlling interests in Carlyle Holdings |
(122.0 | ) | ||
|
|
|
|||
| Net loss attributable to The Carlyle Group L.P. |
$ | (14.3 | ) | |
|
|
|
|||
| Net loss per common unit, basic(2) |
$ | (0.39 | ) | |
|
|
|
|||
| Net loss per common unit, diluted(2) |
$ | (0.39 | ) | |
|
|
|
|||
| (1) | The pro forma consolidated statement of operations data for the three months ended June 30, 2012 presents our consolidated results of operations giving pro forma effect to the Reorganization and Offering Transactions described in our final Prospectus dated May 2, 2012, as if such transactions had occurred on January 1, 2012. The pro forma adjustments applied to the statement of operations primarily relate to the following: (a) a change in the allocation of performance fees to our investment professionals from approximately 55% prior to the IPO to approximately 45% after the IPO; (b) the recognition of partner compensation as an expense in the pro-forma results, which was excluded from our actual results for periods prior to the IPO, when it was shown as distributions from equity; (c) pro forma stock-based compensation charges for awards issued in the IPO; (d) the reclassification of performance fees allocable to retired Carlyle partners to non-controlling interests; and (e) the reduction of interest expense associated with the pro forma repayment of debt with the IPO proceeds. The pro forma adjustments are based on available information and upon assumptions our management believes are reasonable in order to reflect, on a pro forma basis, the impact of these transactions on the historical consolidated financial information of The Carlyle Group L.P. The unaudited pro forma financial information is included for informational purposes only and does not purport to reflect the results of operations of The Carlyle Group L.P. that would have occurred had the transactions described above occurred on the dates indicated or had we operated as a public company during the periods presented or for any future period or date. |
| (2) | Common units used in these calculations are as follows: |
| Basic | Diluted | |||||||
| Weighted-average common units of The Carlyle Group L.P. outstanding |
36,232,453 | 36,232,453 | ||||||
| Dilutive effect of unvested deferred restricted common units |
— | — | ||||||
| Contingently issuable Carlyle Holdings partnership units |
— | — | ||||||
|
|
|
|
|
|||||
| Total common units |
36,232,453 | 36,232,453 | ||||||
|
|
|
|
|
|||||
The weighted-average common units outstanding was calculated assuming the Reorganization and Offering Transactions described in our final Prospectus dated May 2, 2012 had occurred on January 1, 2012. The dilutive effect of unvested deferred restricted common units and contingently issuable Carlyle Holdings partnership units have been excluded during this period as their effect would be anti-dilutive.
Page | 26
Reconciliation for Economic Net Income and Distributable Earnings (Unaudited)
| Pro Forma(1) for the Three Months Ended |
Three Months Ended | |||||||||||
| June 30, 2012 |
June 30, 2012 |
June 30, 2011 |
||||||||||
| (Dollars in Millions) | ||||||||||||
| Income before provision for income taxes |
$ | 226.1 | $ | 186.1 | $ | 317.3 | ||||||
| Adjustments: |
||||||||||||
| Partner compensation |
— | 5.6 | (168.8 | ) | ||||||||
| Equity-based compensation issued in conjunction with the IPO |
52.1 | 93.6 | — | |||||||||
| Acquisition related charges and amortization of intangibles |
21.6 | 21.5 | 19.9 | |||||||||
| Other non-operating expenses |
0.6 | 0.7 | 5.2 | |||||||||
| Net income attributable to non-controlling interests in consolidated entities |
(352.5 | ) | (357.9 | ) | 61.1 | |||||||
| Provision for income taxes attributable to non-controlling interests in consolidated entities |
(5.7 | ) | (5.7 | ) | — | |||||||
| Severance and lease terminations |
1.7 | 1.7 | 2.3 | |||||||||
| Other adjustments |
(2.8 | ) | (2.8 | ) | (0.2 | ) | ||||||
|
|
|
|
|
|
|
|||||||
| Economic Net Income |
$ | (58.9 | ) | $ | (57.2 | ) | $ | 236.8 | ||||
|
|
|
|
|
|
|
|||||||
| Net performance fees |
(109.9 | ) | (106.7 | ) | 190.7 | |||||||
| Investment income |
14.0 | 14.0 | 15.4 | |||||||||
|
|
|
|
|
|
|
|||||||
| Fee Related Earnings |
$ | 37.0 | $ | 35.5 | $ | 30.7 | ||||||
|
|
|
|
|
|
|
|||||||
| Realized performance fees, net of related compensation |
75.7 | 75.8 | 53.0 | |||||||||
| Investment income – realized |
4.0 | 4.0 | 5.6 | |||||||||
|
|
|
|
|
|
|
|||||||
| Distributable Earnings |
$ | 116.7 | $ | 115.3 | $ | 89.3 | ||||||
|
|
|
|
|
|
|
|||||||
| (1) | The selected pro forma non-GAAP financial measures for the three months ended June 30, 2012 presents these measures giving pro forma effect to the Reorganization and Offering Transactions described in our final Prospectus dated May 2, 2012, as if such transactions had occurred on January 1, 2012. |
Page | 27
Reconciliation for Economic Net income and Distributable Earnings, cont
(Unaudited)
| Pro Forma(1) for the Three Months Ended |
||||
| June 30, 2012 |
||||
| (Dollars in millions, except unit and per unit amounts) |
||||
| Pro Forma Economic Net Income |
$ | (58.9 | ) | |
| Less (Add): Provision (Benefit) for Income Taxes |
(1.2 | ) | ||
|
|
|
|||
| Pro Forma Economic Net Income, After Taxes |
$ | (57.7 | ) | |
|
|
|
|||
| Pro Forma Economic Net Income, After Taxes per Adjusted Unit(2) |
$ | (0.19 | ) | |
|
|
|
|||
| Pro Forma Distributable Earnings |
$ | 116.7 | ||
| Less: Estimated foreign, state, and local taxes |
14.8 | |||
|
|
|
|||
| Pro Forma Distributable Earnings, After Taxes |
$ | 101.9 | ||
|
|
|
|||
| Pro Forma Distributable Earnings to The Carlyle Group L.P. |
$ | 14.5 | ||
| Less: Estimated current corporate income taxes |
0.8 | |||
|
|
|
|||
| Pro Forma Distributable Earnings to The Carlyle Group L.P. net of corporate income taxes |
$ | 13.7 | ||
|
|
|
|||
| Pro Forma Distributable Earnings, net, per The Carlyle Group L.P. common unit outstanding(3) |
$ | 0.32 | ||
|
|
|
|||
| (1) | The selected pro forma non-GAAP financial measures for the three months ended June 30, 2012 presents these measures giving pro forma effect to the Reorganization and Offering Transactions described in our final Prospectus dated May 2, 2012, as if such transactions had occurred on January 1, 2012. |
| (2) | Adjusted Units were determined as follows: |
| The Carlyle Group L.P. common units outstanding |
43,221,452 | |||
| Carlyle Holdings partnership units held by the existing owners |
261,278,548 | |||
|
|
|
|||
| Total Adjusted Units |
304,500,000 | |||
|
|
|
The dilutive effect of unvested deferred restricted common units and contingently issuable Carlyle Holdings partnership units have been excluded during this period as their effect would be anti-dilutive.
| (3) | As of June 30, 2012, there are 43,221,452 outstanding common units of The Carlyle Group L.P. |
Page | 28
The Carlyle Group L.P.
GAAP for 12-Month Rolling Summary (Unaudited)
| Twelve Months Ended | ||||||||
| June 30, 2012 |
June 30, 2011 |
|||||||
| (Dollars in millions) | ||||||||
| Revenues |
||||||||
| Fund management fees |
$ | 942.6 | $ | 830.8 | ||||
| Performance fees |
||||||||
| Realized |
1,209.8 | 680.3 | ||||||
| Unrealized |
(888.2 | ) | 1,908.2 | |||||
|
|
|
|
|
|||||
| Total performance fees |
321.6 | 2,588.5 | ||||||
| Investment income |
||||||||
| Realized |
23.9 | 57.8 | ||||||
| Unrealized |
21.0 | 54.8 | ||||||
|
|
|
|
|
|||||
| Total investment income |
44.9 | 112.6 | ||||||
| Interest and other income |
8.1 | 25.6 | ||||||
| Interest and other income of Consolidated Funds |
814.3 | 552.0 | ||||||
|
|
|
|
|
|||||
| Total revenues |
2,131.5 | 4,109.5 | ||||||
| Expenses |
||||||||
| Compensation and benefits |
||||||||
| Base compensation |
455.2 | 295.4 | ||||||
| Equity-based compensation |
94.2 | — | ||||||
| Performance fee related |
||||||||
| Realized |
207.3 | 131.4 | ||||||
| Unrealized |
(223.0 | ) | 166.3 | |||||
|
|
|
|
|
|||||
| Total compensation and benefits |
533.7 | 593.1 | ||||||
| General, administrative and other expenses |
354.4 | 244.4 | ||||||
| Interest |
44.4 | 41.6 | ||||||
| Interest and other expenses of Consolidated Funds |
626.2 | 308.8 | ||||||
| Other non-operating expenses |
8.0 | 20.6 | ||||||
| Loss from early extinguishment of debt, net of related expenses |
— | 2.5 | ||||||
| Equity issued for affiliate debt financing |
— | 214.0 | ||||||
|
|
|
|
|
|||||
| Total expenses |
1,566.7 | 1,425.0 | ||||||
| Other income (loss) |
||||||||
| Net investment income (losses) of Consolidated Funds |
1,212.4 | (837.0 | ) | |||||
| Gain on business acquisition |
7.9 | — | ||||||
|
|
|
|
|
|||||
| Income before provision for income taxes |
1,785.1 | 1,847.5 | ||||||
| Provision for income taxes |
38.0 | 25.7 | ||||||
|
|
|
|
|
|||||
| Net income |
1,747.1 | 1,821.8 | ||||||
| Net income (loss) attributable to non-controlling interests in consolidated entities |
1,211.3 | (667.4 | ) | |||||
|
|
|
|
|
|||||
| Net income attributable to Carlyle Holdings |
535.8 | $ | 2,489.2 | |||||
|
|
|
|||||||
| Net income attributable to non-controlling interests in Carlyle Holdings |
546.1 | |||||||
|
|
|
|||||||
| Net loss attributable to The Carlyle Group L.P. |
$ | (10.3 | ) | |||||
|
|
|
|||||||
Page | 29
Reconciliation of Non-GAAP to GAAP for 12-Month Rolling Summary (Unaudited)
| Twelve Months Ended | ||||||||
| June 30, 2012 |
June 30, 2011 |
|||||||
| (Dollars in Millions) | ||||||||
| Income before provision for income taxes |
$ | 1,785.1 | $ | 1,847.5 | ||||
| Adjustments: |
||||||||
| Partner compensation |
(367.5 | ) | (1,213.8 | ) | ||||
| Equity-based compensation issued in conjunction with IPO |
93.6 | — | ||||||
| Acquisition related charges and amortization of intangibles |
102.6 | 45.5 | ||||||
| Gain on business acquisition |
(7.9 | ) | ||||||
| Other non-operating expenses |
8.0 | 20.6 | ||||||
| Losses associated with early extinguishment of debt |
— | 2.5 | ||||||
| Equity issued for affiliate debt financing |
— | 214.0 | ||||||
| Net income attributable to non-controlling interests in consolidated entities |
(1,211.3 | ) | 667.4 | |||||
| Provision for income taxes attributable to non-controlling interests in consolidated entities |
(5.7 | ) | — | |||||
| Severance and lease terminations |
4.3 | 9.9 | ||||||
| Other adjustments |
(3.4 | ) | 0.2 | |||||
|
|
|
|
|
|||||
| Economic Net Income |
$ | 397.8 | $ | 1,593.8 | ||||
|
|
|
|
|
|||||
| Net performance fees |
227.6 | 1,316.4 | ||||||
| Investment income |
50.3 | 111.7 | ||||||
|
|
|
|
|
|||||
| Fee Related Earnings |
$ | 119.9 | $ | 165.7 | ||||
|
|
|
|
|
|||||
| Realized performance fees, net of related compensation |
629.1 | 355.1 | ||||||
| Investment income – realized |
36.3 | 46.2 | ||||||
|
|
|
|
|
|||||
| Distributable Earnings |
$ | 785.3 | $ | 567.0 | ||||
|
|
|
|
|
|||||
Page | 30
The Carlyle Group L.P.
GAAP Balance Sheet (Unaudited)
| As of June 30, 2012 | ||||||||||||||||
| Consolidated Operating Entities |
Consolidated Funds |
Eliminations | Consolidated | |||||||||||||
| (Dollars in millions) | ||||||||||||||||
| Assets |
||||||||||||||||
| Cash and cash equivalents |
$ | 449.5 | $ | — | $ | — | $ | 449.5 | ||||||||
| Cash and cash equivalents held at Consolidated Funds |
— | 1,553.7 | — | 1,553.7 | ||||||||||||
| Restricted cash |
29.8 | — | — | 29.8 | ||||||||||||
| Restricted cash and securities of Consolidated Funds |
— | 80.7 | — | 80.7 | ||||||||||||
| Accrued performance fees |
2,130.9 | — | (11.1 | ) | 2,119.8 | |||||||||||
| Investments |
449.0 | — | (42.4 | ) | 406.6 | |||||||||||
| Investments of Consolidated Funds |
— | 23,585.3 | — | 23,585.3 | ||||||||||||
| Due from affiliates and other receivables, net |
261.2 | — | (9.9 | ) | 251.3 | |||||||||||
| Due from affiliates and other receivables of Consolidated |
— | |||||||||||||||
| Funds, net |
— | 335.9 | — | 335.9 | ||||||||||||
| Fixed assets, net |
61.1 | — | — | 61.1 | ||||||||||||
| Deposits and other |
56.7 | 3.6 | — | 60.3 | ||||||||||||
| Intangible assets, net |
594.9 | — | — | 594.9 | ||||||||||||
| Deferred tax assets |
51.6 | — | — | 51.6 | ||||||||||||
|
|
|
|
|
|
|
|
|
|||||||||
| Total assets |
$ | 4,084.7 | $ | 25,559.2 | $ | (63.4 | ) | $ | 29,580.5 | |||||||
|
|
|
|
|
|
|
|
|
|||||||||
| Liabilities and partners’ capital |
||||||||||||||||
| Loans payable |
$ | 500.0 | $ | — | $ | — | $ | 500.0 | ||||||||
| Loans payable of Consolidated Funds |
— | 12,605.5 | (40.5 | ) | 12,565.0 | |||||||||||
| Accounts payable, accrued expenses and other liabilities |
197.2 | — | — | 197.2 | ||||||||||||
| Accrued compensation and benefits |
1,204.7 | — | — | 1,204.7 | ||||||||||||
| Due to affiliates |
225.8 | 40.1 | — | 265.9 | ||||||||||||
| Deferred revenue |
57.5 | 1.8 | — | 59.3 | ||||||||||||
| Deferred tax liabilities |
69.0 | — | — | 69.0 | ||||||||||||
| Other liabilities of Consolidated Funds |
— | 1,327.9 | (11.2 | ) | 1,316.7 | |||||||||||
| Accrued giveback obligations |
133.4 | — | 133.4 | |||||||||||||
|
|
|
|
|
|
|
|
|
|||||||||
| Total liabilities |
2,387.6 | 13,975.3 | (51.7 | ) | 16,311.2 | |||||||||||
| Redeemable non-controlling interests in consolidated entities |
4.6 | 2,529.6 | — | 2,534.2 | ||||||||||||
| Total partners’ capital |
1,692.5 | 9,054.3 | (11.7 | ) | 10,735.1 | |||||||||||
|
|
|
|
|
|
|
|
|
|||||||||
| Total liabilities and partners’ capital |
$ | 4,084.7 | $ | 25,559.2 | $ | (63.4 | ) | $ | 29,580.5 | |||||||
|
|
|
|
|
|
|
|
|
|||||||||
Page | 31
The Carlyle Group L.P.
Non-GAAP Financial Information and Other Key Terms
Non-GAAP Financial Information
Carlyle discloses in this press release the following financial measures that are calculated and presented on the basis of methodologies other than in accordance with generally accepted accounting principles in the United States of America:
| • | Economic net income or “ENI,” represents segment net income which excludes the impact of income taxes, acquisition-related items including amortization of acquired intangibles and contingent consideration taking the form of earn-outs, charges associated with equity-based compensation issued in Carlyle’s initial public offering or future acquisitions, corporate actions and infrequently occurring or unusual events. Carlyle believes the exclusion of these items provides investors with a meaningful indication of its core operating performance. For segment reporting purposes, revenues and expenses, and accordingly segment net income, are presented on a basis that deconsolidates certain Carlyle funds, related co-investment entities and CLOs (referred to collectively as the “Consolidated Funds”) that Carlyle consolidates in its combined and consolidated financial statements pursuant to U.S. GAAP. For periods prior to its Initial Public Offering, ENI also reflects pro forma compensation expense for compensation to senior Carlyle professionals, which Carlyle has accounted for as distributions from equity rather than as employee compensation for periods prior to its Initial Public Offering. Total Segment ENI equals the aggregate of ENI for all segments. ENI is evaluated regularly by management in making resource deployment decisions and in assessing performance of Carlyle’s four segments and for compensation. Carlyle believes that reporting ENI is helpful to understanding its business and that investors should review the same supplemental financial measure that management uses to analyze its segment performance. |
| • | Fee Related Earnings is a component of ENI and is used to measure Carlyle’s operating profitability exclusive of performance fees, investment income from investments in Carlyle’s funds and performance fee-related compensation. Accordingly, Fee Related Earnings reflect the ability of the business to cover direct base compensation and operating expenses from fee revenues other than performance fees. For periods prior to its Initial Public Offering, Fee Related Earnings also reflects pro forma compensation expense for compensation to senior Carlyle professionals, which Carlyle has accounted for as distributions from equity rather than as employee compensation for periods prior to its Initial Public Offering. Fee Related Earnings are reported as part of Carlyle’s segment results. Carlyle uses Fee Related Earnings from operations to measure its profitability from fund management fees. |
| • | Distributable Earnings is a component of ENI representing total ENI less net performance fees and investment income plus realized net performance fees and realized investment income. Distributable Earnings is intended to show the amount of net realized earnings without the effects of consolidation of the Consolidated Funds. Distributable Earnings is derived from Carlyle’s segment reported results and is an additional measure to assess performance and amounts potentially available for distribution from Carlyle Holdings to its equity holders. |
Page | 32
Income before provision for income taxes is the GAAP financial measure most comparable to ENI, Fee Related Earnings and Distributable Earnings. Reconciliations of these non-GAAP financial measures to income before provision for income taxes are included within this press release. These non-GAAP financial measures should be considered in addition to and not as a substitute for, or superior to, financial measures presented in accordance with U.S. GAAP.
Other Key Terms
“Assets under management” or “AUM” refers to the assets managed by Carlyle. AUM equals the sum of the following:
(a) the fair value of the capital invested in Carlyle carry funds, co-investment vehicles and fund of funds vehicles plus the capital that Carlyle is entitled to call from investors in those funds and vehicles (including Carlyle commitments to those funds and vehicles and those of senior Carlyle professionals and employees) pursuant to the terms of their capital commitments to those funds and vehicles;
(b) the amount of aggregate collateral balance at par of Carlyle’s collateralized loan obligations (“CLOs”) and the reference portfolio notional amount of Carlyle’s synthetic collateralized loan obligations (“synthetic CLOs”); and
(c) the net asset value (pre-redemptions and subscriptions) of Carlyle’s long/short credit, emerging markets, multi-product macroeconomic and other hedge funds and certain structured credit funds.
AUM includes certain energy and renewable resources funds that Carlyle jointly advises with Riverstone Investment Group L.L.C. (“Riverstone”). In addition, Carlyle’s calculation of AUM (but not fee-earning AUM) includes uncalled commitments to, and the fair value of invested capital in, investment funds from Carlyle and its personnel, regardless of whether such commitments or invested capital are subject to fees.
“Available capital,” commonly known as “dry powder,” for Carlyle’s carry funds refers to the amount of capital commitments available to be called for investments. Amounts previously called may be added back to available capital following certain distributions.
“Carlyle funds,” “our funds” and “our investment funds” refer to the investment funds and vehicles advised by Carlyle.
“Carry funds” refers to those investment funds that Carlyle advises, including the buyout funds, growth capital funds, real asset funds and distressed debt and mezzanine funds (but excluding Carlyle’s structured credit funds, hedge funds and fund of funds vehicles), where Carlyle receives a special residual allocation of income, which is referred to as a “carried interest,” in the event that specified investment returns are achieved by the fund.
Page | 33
“Expired available capital” occurs when a fund has passed the investment and follow-on periods and can no longer invest capital into new or existing deals. Any remaining available capital, typically a result of either recycled distributions or specific reserves established for the follow-on period that are not drawn, can only be called for fees and expenses and is therefore removed from the total AUM calculation.
“Fee-earning assets under management” or “Fee-earning AUM” refers to the assets managed by Carlyle from which Carlyle derives recurring fund management fees. Fee-earning AUM generally equals the sum of:
(a) for carry funds and certain co-investment vehicles where the investment period has not expired, the amount of limited partner capital commitments and for fund of funds vehicles, the amount of external investor capital commitments during the commitment period;
(b) for substantially all carry funds and certain co-investment vehicles where the investment period has expired, the remaining amount of limited partner invested capital;
(c) the gross amount of aggregate collateral balance at par, adjusted for defaulted or discounted collateral, of Carlyle’s CLOs and the reference portfolio notional amount of Carlyle’s synthetic CLOs;
(d) the external investor portion of the net asset value (pre-redemptions and subscriptions) of Carlyle’s long/short credit, emerging markets, multi-product macroeconomic and other hedge funds and certain structured credit funds; and
(e) for fund of funds vehicles and certain carry funds where the investment period has expired, the lower of cost or fair value of invested capital.
Fee-earning AUM includes certain energy and renewable resources funds that Carlyle jointly advises with Riverstone.
For Carlyle’s carry funds, co-investment vehicles and fund of funds vehicles, total AUM includes the fair value of the capital invested, whereas fee-earning AUM includes the amount of capital commitments or the remaining amount of invested capital at cost, depending on whether the investment period for the fund has expired. As such, fee-earning AUM may be greater than total AUM when the aggregate fair value of the remaining investments is less than the cost of those investments.
Page | 34
“Fund of funds vehicles” refer to those funds, accounts and vehicles advised by AlpInvest Partners B.V., formerly known as AlpInvest Partners N.V.
“Net performance fees” refers to the performance fees from Carlyle funds and fund of funds vehicles net of the portion allocated to Carlyle investment professionals which is reflected as performance fee related compensation expense.
“Net realized performance fees” refers to the realized performance fees from Carlyle funds and fund of funds vehicles net of the portion allocated to Carlyle investment professionals which is reflected as realized performance fee related compensation expense.
“Performance fees” consist principally of carried interest from carry funds and fund of funds vehicles and incentive fees or allocations from certain of our Global Market Strategies funds. Carlyle is generally entitled to a 20% allocation (or 1.8% to 10% in the case of most of the fund of funds vehicles) of the net realized income or gain as a carried interest after returning the invested capital, the allocation of preferred returns of generally 8% to 9% and the return of certain fund costs (subject to catch-up provisions as set forth in the fund limited partnership agreement). Carried interest revenue, which is a component of performance fees in Carlyle’s combined and consolidated financial statements, is recognized by Carlyle upon appreciation of the valuation of the applicable funds’ investments above certain return hurdles as set forth in each respective partnership agreement and is based on the amount that would be due to Carlyle pursuant to the fund partnership agreement at each period end as if the funds were liquidated at such date.
Page | 35