Attached files
| file | filename |
|---|---|
| 8-K - ROCK-TENN COMPANY 8-K - Rock-Tenn CO | a50367999.htm |
Exhibit 99.1
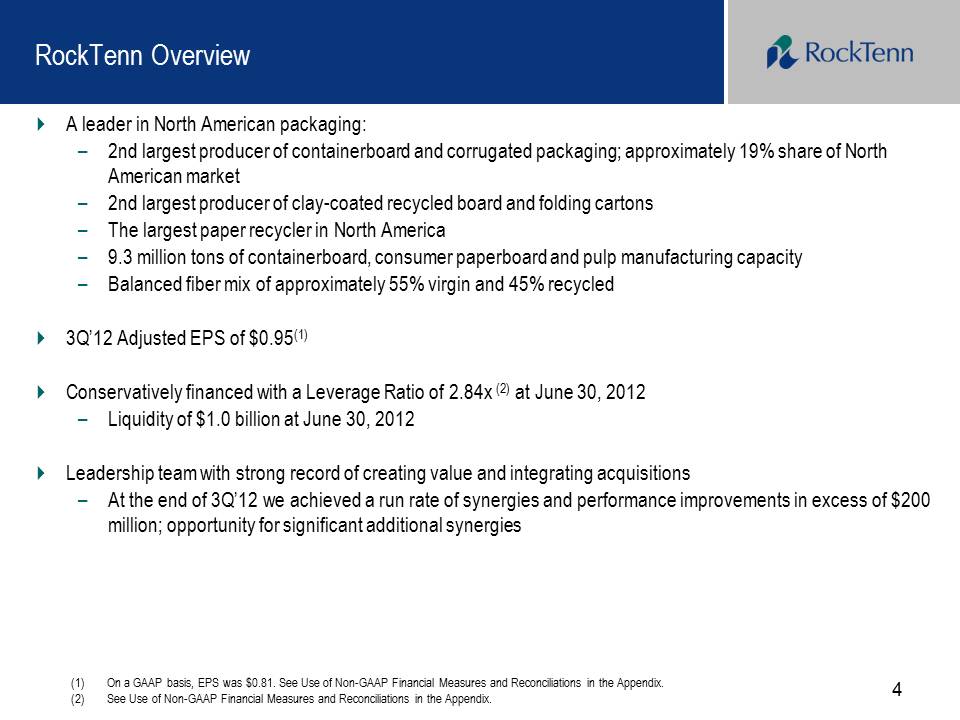
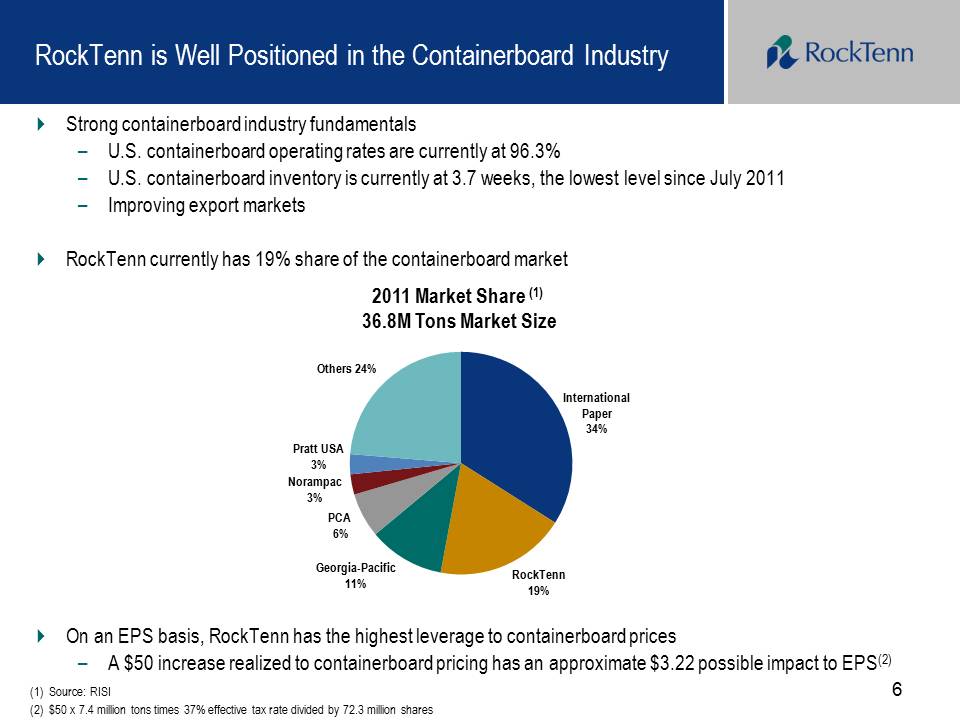
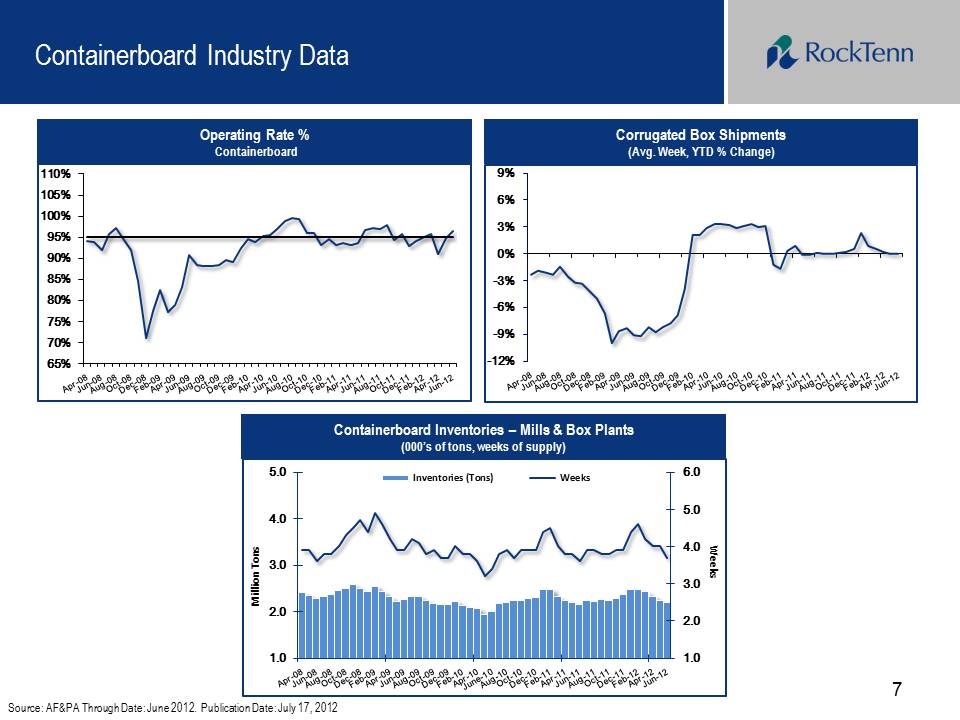
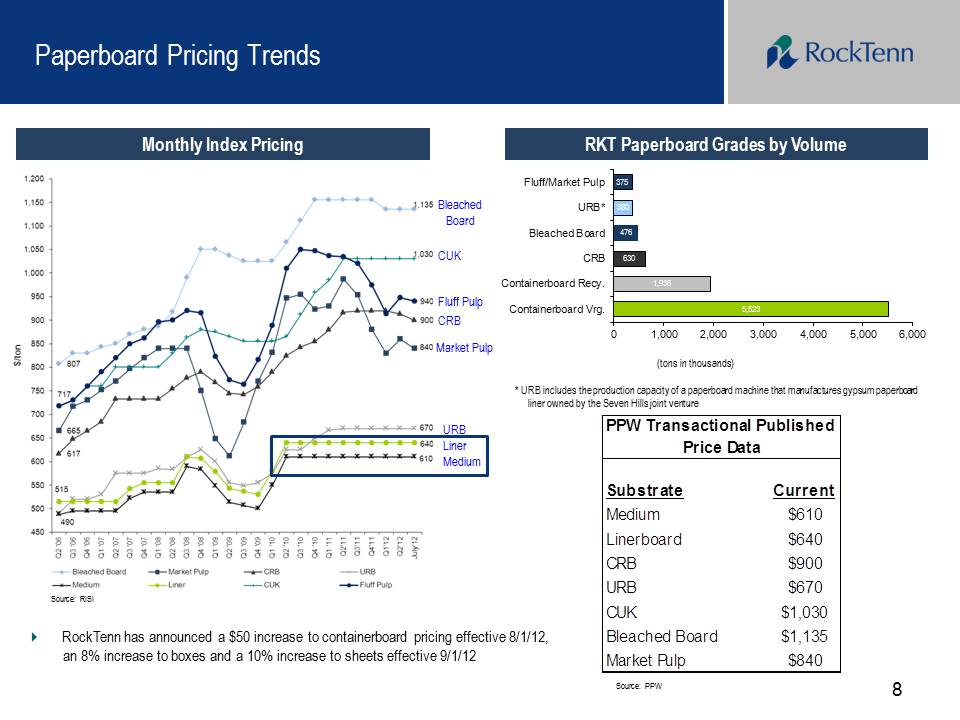


Jefferies Global Industrial and A&D Conference August 7, 2012 Statements in this presentation that do not relate strictly to historical facts are forward-looking statements within the meaning of the Private Securities Litigation Reform Act of 1995, including, without limitation, statements made on the slides entitled “RockTenn Overview,” “4Q’12 Outlook” and “Key Financial Statistics – FY12 Outlook” that give guidance for future periods in 2012. Forward-looking statements are based on our current expectations, beliefs, plans or forecasts and use words in this presentation such as “will”, “estimates”, “outlook”, and “opportunity” or refer to future time periods. Forward-looking statements are based on our current expectations, beliefs, plans or forecasts and use words in this presentation such as will, estimate, trending, or refer to future time periods. You should not place undue reliance on any forward-looking statements as such statements involve risks, uncertainties, assumptions and other factors that could cause actual results to differ materially, including the following: our belief that the Corrugated industry exhibited improving industry fundamentals as the fiscal third quarter came to a close, our ability to integrate Smurfit-Stone or to achieve benefits from the Smurfit-Stone Acquisition, including, without limitation, synergies and performance improvements; expected levels of depreciation, corporate expenses, interest expense, income tax rates, federal NOL utilization, Black Liquor and AMT tax credit utilization, pension contributions, capital expenditures, commodity costs, maintenance outages, containerboard inventory builds; the level of demand for our products; economic downtime; our ability to successfully identify and make performance improvements; anticipated returns on our capital investments; possible increases in energy, raw materials, shipping and capital equipment costs; any reduction in the supply of raw materials; fluctuations in selling prices and volumes; intense competition; the potential loss of certain customers; adverse changes in general market and industry conditions and other risks, uncertainties and factors discussed in Item 1A "Risk Factors" and under the caption "Business — Forward-Looking Information" in our 2011 Annual Report on Form 10-K and by similar disclosures in any of our subsequent SEC filings. The information contained herein speaks as of the date hereof and we do not have or undertake any obligation to update such information as future events unfold. 2 Cautionary Statement Regarding Forward-Looking Information Disclaimer and Use of Non-GAAP Financial Measures and Reconciliations We may from time to time be in possession of certain information regarding RockTenn that applicable law would not require us to disclose to the public in the ordinary course of business, but would require us to disclose if we were engaged in the purchase or sale of our securities. This presentation shall not be considered to be part of any solicitation of an offer to buy or sell RockTenn securities. This presentation also may not include all of the information regarding RockTenn that you may need to make an investment decision regarding RockTenn securities. Any such investment decision should be made on the basis of the overall mix of information regarding RockTenn that is publicly available as of the date of such decision. We have included financial measures that are not prepared in accordance with accounting principles generally accepted in the United States ("GAAP"). The non-GAAP financial measures presented are not intended to be a substitute for GAAP financial measures, and any analysis of non-GAAP financial measures should be used only in conjunction with results presented in accordance with GAAP and the reconciliations of non-GAAP financial measures to GAAP financial measures included in the Appendix to this presentation. 3 RockTenn Overview .. A leader in North American packaging: – 2nd largest producer of containerboard and corrugated packaging; approximately 19% share of North American market – 2nd largest producer of clay-coated recycled board and folding cartons – The largest paper recycler in North America – 9.3 million tons of containerboard, consumer paperboard and pulp manufacturing capacity – Balanced fiber mix of approximately 55% virgin and 45% recycled .. 3Q’12 Adjusted EPS of $0.95(1) .. Conservatively financed with a Leverage Ratio of 2.84x (2) at June 30, 2012 – Liquidity of $1.0 billion at June 30, 2012 .. Leadership team with strong record of creating value and integrating acquisitions – At the end of 3Q’12 we achieved a run rate of synergies and performance improvements in excess of $200 million; opportunity for significant additional synergies 4 (1) On a GAAP basis, EPS was $0.81. See Use of Non-GAAP Financial Measures and Reconciliations in the Appendix. (2) See Use of Non-GAAP Financial Measures and Reconciliations in the Appendix. 5 RockTenn’s Core Business Principles Providing superior paperboard, packaging and marketing solutions for consumer products companies at very low costs RockTenn’s expanded network of mills and converting plants are cost-competitive with numerous opportunities to further optimize the combined system Investing for competitive advantage RockTenn’s assets are well-capitalized, with significant opportunities identified for further profit-improving investments Maximizing the efficiency of our manufacturing processes by optimizing economies of scale RockTenn has significant opportunities for optimizing scale Systematically improving processes and reducing costs throughout the Company RockTenn’s Six Sigma continuous improvement and Lean Manufacturing methods further optimize manufacturing and administrative processes Seeking acquisitions that can dramatically improve the business RockTenn’s virgin containerboard mill system is a key strategic asset RockTenn will be the most respected company in our business by: RockTenn is Well Positioned in the Containerboard Industry 6 .. Strong containerboard industry fundamentals – U.S. containerboard operating rates are currently at 96.3% – U.S. containerboard inventory is currently at 3.7 weeks, the lowest level since July 2011 – Improving export markets .. RockTenn currently has 19% share of the containerboard market .. On an EPS basis, RockTenn has the highest leverage to containerboard prices – A $50 increase realized to containerboard pricing has an approximate $3.22 possible impact to EPS(2) (1) Source: RISI (2) $50 x 7.4 million tons times 37% effective tax rate divided by 72.3 million shares 2011 Market Share (1) 36.8M Tons Market Size International Paper 34% RockTenn 19% Georgia-Pacific 11% Norampac 3% Pratt USA 3% Others 24% PCA 6% Containerboard Industry Data 7 Source: AF&PA Through Date: June 2012. Publication Date: July 17, 2012 Corrugated Box Shipments (Avg. Week, YTD % Change) Operating Rate % Containerboard Containerboard Inventories – Mills & Box Plants (000’s of tons, weeks of supply) 1.0 2.0 3.0 4.0 5.0 6.0 1.0 2.0 3.0 4.0 5.0 Inventories (Tons) Weeks Million Tons Weeks -12% -9% -6% -3% 0% 3% 6% 9% 65% 70% 75% 80% 85% 90% 95% 100% 105% 110% Liner Paperboard Pricing Trends Monthly Index Pricing Source: RISI Source: PPW RKT Paperboard Grades by Volume (tons in thousands) * URB includes the production capacity of a paperboard machine that manufactures gypsum paperboard liner owned by the Seven Hills joint venture Bleached Board CUK CRB Market Pulp URB Medium Substrate Current Medium $610 Linerboard $640 CRB $900 URB $670 CUK $1,030 Bleached Board $1,135 Market Pulp $840 PPW Transactional Published Price Data 8 5,523 1,936 630 476 380 375 0 1,000 2,000 3,000 4,000 5,000 6,000 Containerboard Vrg. Containerboard Recy. CRB Bleached Board URB* Fluff/Market Pulp Fluff Pulp .. RockTenn has announced a $50 increase to containerboard pricing effective 8/1/12, an 8% increase to boxes and a 10% increase to sheets effective 9/1/12 $- $100 $200 $300 $400 $500 $600 Hopewell, VA Florence, SC Panama City, FL Stevenson, AL Coshocton, OH Fernandina , FL Solvay, NY Jacksonville, FL Uncasville, CT West Point, VA St. Paul, MN Hodge, LA .. RockTenn is committed to having a first quartile mill system through operational excellence and high return investments. – 72% of RockTenn’s capacity is lower than the industry cash cost average $306/ton Industry Average Source: March Qtr. 2012 Fisher Data and Management Estimates. Note: La Tuque bleached liner/SBS mill not shown on cost curve chart. La Tuque mill also not included in Industry Average or RockTenn Mill System cost per ton. Containerboard Cost Curve – March Qtr 2012 RockTenn’s Containerboard Mill System cost per ton = $290 9 RockTenn Cumulative Capacity 28% 16% 39% 100% 11% 75% 72% 59% 46% 97% 89% 79% Well-capitalized, Low-cost Containerboard Mills North American Corrugated Packaging Footprint 10 Good Balance of Virgin/Recycled Fiber Allows for Flexibility 11 Rebalancing RockTenn’s fiber sourcing to approximately 55% virgin / 45% recycled Note: Some virgin containerboard is manufactured with some recycled content Source: OBM, RISI, management estimates Wood fiber adjustments include 4 tons of wood fiber to produce 1 ton of board. OCC fiber adjustments include $20/ton for delivery costs and 1.08 tons of recycled fiber to produce 1 ton of board. Fiber Mix Historical Recycled Fiber Composite and Softwood Chips Fiber Costs(1) Virgin fiber costs have historically been less volatile than recycled fiber (OCC) (1) Adj. Softwood Chips Fiber Cost for 1Q’12 through August ‘12 are RISI forecast numbers 100% 73% 72% 73% 82% 82% 82% 45% 45% 27% 28% 27% 18% 18% 18% 55% 55% 2004 2005 2006 2007 2008 2009 2010 2011 2012 Recycled Virgin 0 25 50 75 100 125 150 175 200 225 Q1 06 Q2 06 Q3 06 Q4 06 Q1 07 Q2 07 Q3 07 Q4 07 Q1 08 Q2 08 Q3 08 Q4 08 Q1 09 Q2 09 Q3 09 Q4 09 Q1 10 Q2 10 Q3 10 Q4 10 Q1 11 Q2 11 Q3 11 Q4 11 Q1 12 Q2 12 Jul 12 Aug 12 Adj. Recycled Fiber Composite Cost Adj. Softwood Chips Fiber Cost 12 Synergies and Performance Improvements .. Run rate of synergy and performance improvements at 6/30/12 in excess of $200 million .. Implementing new box plant operational planning system .. To date, eleven box plant closures have been announced Run Rate of Savings +$200 million Mill- Hodge 10% Mill- Matane and Other Operating Improvements 28% Box Plants 15% Energy Projects 6% Procurement 24% Administrative (Corporate, IT, Other) 17% Highly Profitable Consumer Packaging Business 13 .. RockTenn has approximately 1.5 million tons of consumer paperboard manufacturing capacity .. Strong management team .. Solid operating performance and execution LTM 3Q'12 Net Sales 2,564.8 $ Segment Income 330.5 $ Segment EBITDA Margins (1) 16.6% ($ Millions, Except Percentage) (1) See Use of Non-GAAP Financial Measures and Reconciliations in the Appendix. North American Consumer Packaging Footprint 14 $3,431 $190 $64 ($918) $440 $56 $122 ($44) $3,341 $2,500 $2,750 $3,000 $3,250 $3,500 $3,750 Net Debt Reduction 90 $ Dividends 56 Pension in Excess of Expense 190 Acquisitions/Investments 122 Total 458 $ 3Q’11 Net Debt Pension in Excess of Expense Cash Restructuring Cash Generated from Operations Capital Expenditures Dividends Acquisitions & Investments Other 3Q’12 Net Debt Net Debt (1) Bridge: LTM 3Q’12 15 (1) On a GAAP basis, Total Debt was $3.36 billion and $3.48 billion in 3Q’12 and 3Q’11, respectively. See Use of Non-GAAP Financial Measures and Reconciliations in the Appendix. ($ Millions) .. Goal is to maximize long-term free cash flow returns ..Leverage Ratio of 2.84x (1) ..$1.0 billion of liquidity available to RockTenn at 6/30/12 RockTenn Capitalization Profile – 6/30/12 Debt Maturity Profile (millions) ($ Millions, except percentages) Cash $ 19 Revolver due 2016 412 6.0% Term Loans A/A2 due 2016 1,623 23.5% AR Securitization due 2014 482 7.0% 2013 Notes 81 1.2% 2019 Notes 350 5.1% 2022 Notes 400 5.8% Other Debt 14 0.2% Total Debt $ 3,361 48.7% Shareholders' Equity 3,546 51.3% Total Capitalization $ 6,907 100.0% At June 30, 2012 Above excludes unamortized bond discounts of $1.1 million and terminated swaps of $0.2 million (1) See Use of Non-GAAP Financial Measures and Reconciliations in the Appendix. Credit Ratings S&P Moody's Corporate Rating BBB- Ba1 2013 Bonds BB+ Ba1 2019 / 2022 Bonds BBB- Ba1 $- $200 $400 $600 $800 $1,000 $1,200 $1,400 $1,600 FY12 FY13 FY14 FY15 FY16 Thereafter Credit Facilities 2013 Notes 2019 Notes 2022 Notes A/R Securitization Other 16 4Q’12 Outlook .. Demand – Seasonal strengthening in containerboard and box demand – Folding Carton, SBS and CRB demand and backlogs a little soft – Some economic downtime in CRB mills .. Somewhat lower SBS and CRB selling prices .. No significant major maintenance or economic downtime planned in Containerboard mill system .. Lower recycled fiber costs .. Increased natural gas, electricity and corn starch costs 17 Conclusion .. Strong containerboard industry fundamentals .. RockTenn is well positioned as a containerboard leader – 2nd largest producer of containerboard and corrugated packaging in North America – 7.5 million tons of containerboard capacity – 19% share of North American Containerboard Industry – Balanced fiber mix of approximately 55% virgin and 45% recycled; allows for flexibility – Good mix of export and domestic sales – Still relatively early in Smurfit integration – significant opportunity to capitalize on valuable strategic assets .. Very stable and profitable Consumer Packaging business – 2nd largest producer of clay-coated recycled paperboard and folding cartons in North America – Largest paper recycler in North America .. Strong current cash flow and healthy balance sheet .. Opportunity for significant value creation from both top line and performance execution 18 Appendix 19 20 Use of Non-GAAP Financial Measures and Reconciliations Below, we define the non-GAAP financial measures, provide a reconciliation of each non-GAAP financial measure to the most directly comparable financial measure calculated in accordance with GAAP, and discuss the reasons that we believe this information is useful to management and may be useful to investors. These measures may differ from similarly captioned measures of other companies in our industry. Non-GAAP Measures Our definitions of Credit Agreement EBITDA and Segment EBITDA may differ from other similarly titled measures at other companies. Credit Agreement EBITDA (as defined) and Adjusted EBITDA (as defined) are not defined in accordance with GAAP and should not be viewed as alternatives to GAAP measures of operating results or liquidity. RockTenn management believes that net income is the most directly comparable GAAP measure to Credit Agreement EBITDA (as defined) and Segment Income is the most directly comparable GAAP measure to Segment EBITDA. 21 Non-GAAP Measures: Credit Agreement EBITDA, Segment EBITDA and Total Funded Debt (as defined) “Credit Agreement EBITDA” is calculated in accordance with the definition of “EBITDA” contained in the Company’s Credit Agreement. Credit Agreement EBITDA is generally defined as Consolidated Net Income, on a pro forma basis giving effect to the Smurfit-Stone Acquisition, plus: consolidated interest expense; consolidated tax expenses; depreciation and amortization expenses; charges and expenses for financing fees and expenses and write-offs of deferred financing fees and expenses, remaining portions of OID on prepayment of indebtedness, premiums due in respect of prepayment of indebtedness, and commitment fees in respect of financing commitments; various charges and expenses related to, or incurred in connection with, the Smurfit- Stone acquisition; costs and expenses relating to the integration of Smurfit-Stone and the achievement of synergies relating to the Smurfit-Stone acquisition; all non-cash charges; all cash charges and expenses for plant and other facility closures and other cash restructuring charges; labor disruption charges; officer payments associated with any permitted acquisitions; “black liquor” expenses; cash charges and expenses incurred in respect of the Chapter 11 bankruptcy proceeding and plan of reorganization of Smurfit-Stone; and all nonrecurring cash expenses taken in respect of any multi-employer and defined benefit pension plan obligations that are related to plant and other facilities closures. For additional information on the calculation see our Credit Agreement, dated as of May 27, 2011, filed as Exhibit 10.1 to our Form 8-K, dated May 27, 2011. “Segment EBITDA” is calculated as Segment Income plus segment depreciation and amortization. Segment EBITDA Margin is Segment EBITDA divided by segment sales. “Total Funded Debt” is calculated in accordance with the definition of “Total Funded Debt” contained in the Company’s Credit Agreement. Total Funded Debt is generally defined as aggregate debt obligations reflected in our balance sheet, less the hedge adjustments resulting from terminated and existing fair value interest rate derivatives or swaps, plus additional outstanding letters of credit not already reflected in debt, plus debt guarantees. 22 Non-GAAP Measures: Credit Agreement EBITDA, Segment EBITDA and Total Funded Debt Our management uses Credit Agreement EBITDA and Total Funded Debt to evaluate compliance with RockTenn’s debt covenants and borrowing capacity available under its Credit Agreement. Management also uses Credit Agreement EBITDA and Segment EBITDA as measures of our Company’s core operating performance. Management believes that investors also use these measures to evaluate the Company’s compliance with its debt covenants and available borrowing capacity. Management also believes that investors use Credit Agreement EBITDA and Segment EBITDA as measures of our Company’s core operating performance. Borrowing capacity is dependent upon, in addition to other measures, the “Total Funded Debt/EBITDA ratio” or the “Leverage Ratio,” which is defined as Total Funded Debt divided by Credit Agreement EBITDA. 23 Non-GAAP Measures: Net Debt We have defined the non-GAAP measure Net Debt to include the aggregate debt obligations reflected in our balance sheet, less the hedge adjustments resulting from terminated and existing fair value interest rate derivatives or swaps, the balance of our cash and cash equivalents, restricted cash (which includes the balance sheet line items restricted cash and restricted cash and marketable debt securities) and certain other investments that we consider to be readily available to satisfy such debt obligations. Our management uses Net Debt, along with other factors, to evaluate our financial condition. We believe that Net Debt is an appropriate supplemental measure of financial condition and may be useful to investors because it provides a more complete understanding of our financial condition before the impact of our decisions regarding the appropriate use of cash and liquid investments. 24 Non-GAAP Measures: Adjusted Net Income and Adjusted Earnings Per Diluted Share We also use the non-GAAP measures “adjusted net income” and “adjusted earnings per diluted share”. Management believes these non-GAAP financial measures provide our board of directors, investors, potential investors, securities analysts and others with useful information to evaluate the performance of the Company because it excludes restructuring and other costs, net, the alternative fuel mixture credit and cellulosic biofuel producer credit and other specific items that management believes are not indicative of the ongoing operating results of the business. The Company and the board of directors use this information to evaluate the Company’s performance relative to other periods. .. The Fernandina, Hopewell and West Point natural gas projects will reduce the above fuel oil usage by approximately 19.4 million gallons and increase natural gas usage by approximately 2.9 bcf. Estimated Annual Quantity Unit 3Q'12 Average Price Unit Estimated Annual Cost ($ Millions) 4Q'12 Outlook Wood Fiber 19 million tons $34.58 per ton $657 Recycled Fiber (1) 4 million tons $122.40 per ton $490 Natural Gas (2) 29 bcf $2.22 per mmbtu $63 Fuel Oil (Mill Use) (3) 26 million gallons $2.37 per gallon $62 Diesel (Freight) (4) 59 million gallons $3.95 per gallon $233 Key Inputs 25 Note: Excluding Wood Fiber 3Q’12 average prices based off of the following indices: 1. Recycled Fiber based on RockTenn weighted consumption by regional indices 2. Natural Gas: NYMEX Henry Hub Futures 3. Fuel Oil: Platts New York #6 2.2% Cargo 4. Diesel: EIA U.S. Diesel Fuel Retail Average Price, Industrial Sector . . . . . Key Financial Statistics – FY12 Outlook ($ Millions unless stated) FY12 Depreciation and Amortization: $535 Corporate Expenses (September Quarter): $28 Interest Expense (September Quarter): $28 Book Tax Rate: 37% - 38% Federal NOLs (at June 30, estimated): $471 pre-tax ($165 after-tax) Cellulosic Biofuel/Black Liquor Tax Credits: $146 AMT Credits: $69 Qualified Pension Expense (FY12 / FY13): $46/$49 Pension Contributions: $355 Capital Expenditures: $500-$525 Q4'11 A Q1'12 A Q2'12A Q3'12 Q4'12 FY12 Estimated Qualified Pension Contributions: 42 $ 81 $ 54 $ 67 $ 153 $ 355 $ Corrugated Scheduled Maintenance Total Downtime (thous. of tons): - 45 52 165 2 264 Corrugated Outage Expense, Excluding Volume: 2 $ 5 $ 7 $ 18 $ 20 $ 50 $ ($ Millions) 26 LTM 3Q'12 Corrugated Packaging Consumer Packaging Recycling and Waste Solutions Corporate / Other Consolidated Segment Sales 6,200.4 $ 2,564.8 $ 1,320.2 $ (768.1) $ 9,317.3 $ Segment Income 405.6 $ 330.5 $ 15.2 $ 751.3 $ Depreciation & Amortization 404.8 96.5 12.9 13.4 527.6 Plus: Matane Mill EBITDA(1) 6.5 Segment EBITDA 816.9 $ 427.0 $ 28.1 $ Segment EBITDA Margins 13.2% 16.6% 2.1% Segment EBITDA Margins 27 ($ Millions, except percentages) (1) For post closure loss. Adjusted EPS Reconciliation 28 ($ Millions, except per share data) 3Q'12 Net income attributable to Rock-Tenn Company Shareholders 58.2 $ Restructuring and other costs (1) 10.0 Loss on extinguishment of debt - Acquisition inventory step-up 0.2 Adjusted net income 68.4 $ Earnings per diluted share 0.81 $ Restructuring and other costs (1) 0.14 Loss on extinguishment of debt - Adjusted earnings per diluted share 0.95 $ (1) Restructuring and other costs and operating losses and transition costs due to plant closures. Net Debt Reconciliation 29 ($ Millions) June 30, 2012 June 30, 2011 Current Portion of Debt 257.7 $ 241.5 $ Long-Term Debt Due After One Year 3,102.6 3,241.9 Total Debt 3,360.3 3,483.4 Less: Hedge Adjustments Resulting From Fair Value Interest Rate Derivatives or Swaps (0.2) (0.7) 3,360.1 3,482.7 Less: Cash and Cash Equivalents (19.5) (51.6) Net Debt 3,340.6 $ 3,431.1 $ Credit Agreement EBITDA and Leverage Ratio 30 ($ Millions) 12 Months Ended 6/30/2012 Consolidated Net Income 253.6 $ Interest Expense, net 113.2 Income Taxes 141.8 Depreciation and Amortization 527.6 Additional Permitted Charges (1) 168.5 Credit Agreement EBITDA 1,204.7 $ Current Portion of Debt 257.7 $ Long-Term Debt due after one year 3,102.6 Total Debt 3,360.3 Less: Hedge Adjustments Resulting from Terminated Swaps (0.2) Total Debt Less Hedge Adjustments 3,360.1 $ Plus: Letters of Credit, Guarantees and Other Adjustments 65.0 Total Funded Debt 3,425.1 $ Leverage Ratio at June 30, 2012 2.84x (1) As specified in our Credit Agreement dated May 27, 2011. Credit Agreement EBITDA Breakout of Additional Permitted Charges 31 ($ Millions) 12 Months Ended 6/30/2012 Restructuring, Acquisition and Integration Items 85.9 $ Expenses related to the write-up of inventory 4.6 Financing Fees and Expenses 19.6 Non-cash share based compensation expense 25.9 Other 32.5 Total of Additional Permitted Charges 168.5 $