Attached files
| file | filename |
|---|---|
| 8-K - 8-K - LTC PROPERTIES INC | a12-17719_18k.htm |
| EX-99.1 - EX-99.1 - LTC PROPERTIES INC | a12-17719_1ex99d1.htm |
Exhibit 99.2
|
|
Supplemental Operating and Financial Data June 30, 2012 (Unaudited) Cincinnati, OH 144 licensed beds |
|
|
Table of Contents 2 CORPORATE Company Information 3 Additional Information 4 Forward-Looking Statements & Non-GAAP Information 5 Acquisitions & Developments 6 Proforma Definition 7 Proforma Real Estate Portfolio Summary 8 Real Estate Portfolio Metrics 9-10 Proforma Real Estate Portfolio Diversification 11-13 Proforma Top Ten Operators - Owned Portfolio 14 Market Capitalization 15 Proforma Market Capitalization 16 Proforma Lease & Mortgage Loan Receivable Maturity 17 Proforma Debt Maturity 18 Financial Data Summary 19-20 Consolidated Statements of Income 21 Consolidated Balance Sheets 22 Funds from Operations 23 Glossary 24-26 |
|
|
3 Company Information CORPORATE Andre Dimitriadis Wendy Simpson Edmund King Executive Chairman Timothy Triche, MD Boyd Hendrickson Devra Shapiro Lead Director Andre Dimitriadis Wendy Simpson Pam Kessler Executive Chairman Chief Executive Officer and President Executive Vice President and Chief Financial Officer Clint Malin Andy Stokes Executive Vice President and Chief Investment Officer Senior Vice President, Marketing & Strategic Planning Corporate Office Investor Relations www.LTCProperties.com 2829 Townsgate Road, Suite 350 Investor.Relations@LTCProperties.com (805) 981-8655 phone Westlake Village, CA 91361 (805) 981-8655 (805) 981-8663 fax Board of Directors Management Contact Information Company Founded in 1992, LTC Properties, Inc. is a self-administered real estate investment trust that primarily invests in senior housing and long-term care properties through facility lease transactions, mortgage loans, and other investments. Our primary objectives are to sustain and enhance stockholder equity value and provide current income for distribution to stockholders through real estate investments in long-term care properties and other health care related properties managed by experienced operators. To meet these objectives, we attempt to invest in properties that provide opportunity for additional value and current returns to our stockholders and diversify our investment portfolio by geographic location, operator, and form of investment. For more information on LTC Properties, Inc., visit the Company’s website at www.LTCProperties.com. |
|
|
4 CORPORATE Additional Information BMO Capital Markets Corp. J.J. B. Hilliard, W.L. Lyons, Inc. JMP Securities, LLC Richard Anderson John Roberts Peter Martin KeyBanc Capital Markets, Inc. RBC Capital Markets Corporation Sandler O'Neill + Partners, L.P. Karin Ford Mike Carroll James Milam Sidoti & Company, LLC Stifel, Nicolaus & Company, Inc. Wells Fargo Securities, LLC Peter Sicher Dan Bernstein Todd Stender Analyst Coverage Any opinions, estimates, or forecasts regarding LTC's performance made by the analysts listed above do not represent the opinions, estimates, or forecasts of LTC or its management. |
|
|
5 Forward-Looking Statements This supplemental information contains forward-looking statements within the meaning of Section 27A of the Securities Act of 1933, as amended, and Section 21E of the Securities Exchange Act of 1934, as amended, adopted pursuant to the Private Securities Litigation Reform Act of 1995. Statements that are not purely historical may be forward-looking. You can identify some of the forward-looking statements by their use of forward-looking words, such as ‘‘believes,’’ ‘‘expects,’’ ‘‘may,’’ ‘‘will,’’ ‘‘should,’’ ‘‘seeks,’’ ‘‘approximately,’’ ‘‘intends,’’ ‘‘plans,’’ ‘‘estimates’’ or ‘‘anticipates,’’ or the negative of those words or similar words. Forward- looking statements involve inherent risks and uncertainties regarding events, conditions and financial trends that may affect our future plans of operation, business strategy, results of operations and financial position. A number of important factors could cause actual results to differ materially from those included within or contemplated by such forward-looking statements, including, but not limited to, the status of the economy, the status of capital markets (including prevailing interest rates), and our access to capital; the income and returns available from investments in health care related real estate, the ability of our borrowers and lessees to meet their obligations to us, our reliance on a few major operators; competition faced by our borrowers and lessees within the health care industry, regulation of the health care industry by federal, state and local governments, (including as a result of the Patient Protection and Affordable Care Act of 2010 and the Health Care and Education Reconciliation Act of 2010), changes in Medicare and Medicaid reimbursement amounts (including due to federal and state budget constraints), compliance with and changes to regulations and payment policies within the health care industry, debt that we may incur and changes in financing terms, our ability to continue to qualify as a real estate investment trust, the relative illiquidity of our real estate investments, potential limitations on our remedies when mortgage loans default, and risks and liabilities in connection with properties owned through limited liability companies and partnerships. For a discussion of these and other factors that could cause actual results to differ from those contemplated in the forward-looking statements, please see the discussion under ‘‘Risk Factors’’ and other information contained in our Annual Report on Form 10-K for the fiscal year ended December 31, 2011 and in our publicly available filings with the Securities and Exchange Commission. We do not undertake any responsibility to update or revise any of these factors or to announce publicly any revisions to forward-looking statements, whether as a result of new information, future events or otherwise. Non-GAAP Information This supplemental information contains certain non-GAAP information including EBITDA, normalized EBITDA, FFO, normalized FFO, normalized interest coverage ratio, and normalized fixed charges coverage ratio. A reconciliation of this non-GAAP information is provided on pages 20 and 23 of this supplemental information, and additional information is available under the “Non-GAAP Financial Measures” subsection under the “Selected Financial Data” section of our website at www.LTCProperties.com. CORPORATE |
|
|
6 Acquisitions and Developments REAL ESTATE PORTFOLIO (dollar amounts in thousands) GAAP yield assumes a total purchase price of $45,000 which includes $41,000 of cash paid at closing and $4,000 paid on August 31, 2011. GAAP yield assumes $8,250 construction funding as noted in (3) below. Acquired a vacant parcel of land in Texas and entered into a commitment to fund the construction of a 120-bed skilled nursing property which will replace an existing 90-bed skilled nursing property we own. The incremental cash lease yield excludes other properties in the master lease. The cash yield including the other properties is 9.6% Acquired a vacant parcel of land in Colorado and entered into a commitment to fund the construction of a 60-unit free-standing private-pay memory care property. ACQUISITIONS DEVELOPMENT PROPERTIES LOCATION PROPERTY TYPE ESTIMATED COMPLETION DATE TOTAL COMMITMENT FUNDED TO DATE REMAINING COMMITMENT Amarillo, TX SNF 9.00% (3) April 2013 8,250 $ 115 $ 8,135 $ Littleton, CO Memory Care 9.25% (4) December 2013 7,935 150 7,785 Total 16,185 $ 265 $ 15,920 $ INCREMENTAL CASH LEASE YIELD DATE # OF PROPERTIES ASSET CLASS # BEDS/UNITS LOCATION OPERATOR DATE OF CONSTRUCTION PURCHASE PRICE ANNUAL GAAP REVENUE GAAP Lease Yield 2/28/11 2 OTHER 118 beds/93 units SC Prestige Healthcare 1965-2001 11,450 $ 1,158 $ 10.1% 3/9/11 4 SNF 524 TX Meridian Senior Properties 2007-2008 45,000 (1) 4,722 10.5% (1) 8/1/11 1 SNF 140 TX Senior Care Centers 2008 10,000 1,058 10.5% 10/11/11 1 SNF 196 TX Fundamental 2005 15,500 1,881 11.0% (2) 10/11/11 1(3) UDP (3) N/A (3) TX Under Development Property 2012(3) 844 - - (3) 11/1/11 Total 2011 3/23/12 1 10 1 SNF SNF 156 1,134 beds/93 units 144 CA TX Traditions Management Senior Care Centers 1990 2002 17,500 $ 100,294 18,600 $ 1,814 1,988 $ 10.3% 10.7% 5/14/12 1(4) UDP (4) N/A (4) CO Under Development Property 2012(4) 1,882 - - (4) 7/2/12 1 SNF 90 TX Senior Care Centers 2011 6,500 701 10.7% 7/31/12 Total 2012 Total 2 5 15 SNF 288 522 beds 1,656 beds/93 units OH Carespring Health Care Mgt 2009-2010 54,000 $ 80,982 $ 181,276 5,426 10.1% |
|
|
7 Proforma Definition REAL ESTATE PORTFOLIO Actual rolling four (4) quarters ended June 30, 2012 or Balance Sheet data as of June 30, 2012 adjusted for the following: Includes the acquisition of a 90-bed SNF in Brownwood, TX for $6.5M and a 10.7% GAAP yield. Includes the acquisition of two skilled nursing facilities with a total of 288 licensed beds for $54.0M and a 10.1% GAAP yield. One property located in Cincinnati, Ohio was built in 2009 and the other property, located in Dayton, Ohio, was built in 2010. Includes the private placement debt financing of $85.8M Senior Unsecured Notes at 5.03% maturing in July 2024. Net proceeds, after property acquisitions and estimated transaction costs, of $24.6M were used to pay down our unsecured line of credit. |
|
|
8 Proforma Real Estate Portfolio Summary REAL ESTATE PORTFOLIO (dollar amounts in thousands) We have two properties under development: 120-bed skilled nursing property in Texas which will replace an existing 90-bed skilled nursing property we own and 60-unit free-standing memory care property in Colorado. Dayton, OH 144 licensed beds Type of Property Gross Investments % of Investments Rental Income Interest Income % of Revenues # of Properties No. of SNF Beds No. of ALF Units No. of ILF Units Skilled Nursing $ 462,593 54.2% $ 26,925 $ 1,511 55.6% 90 10,515 - - $43.99 Assisted Living 308,534 36.1% 16,546 1,277 34.8% 102 - 4,365 - $70.68 Other Senior Housing 67,685 7.9% 3,915 175 8.0% 14 913 330 423 $40.63 Schools 12,236 1.4% 796 - 1.6% 2 - - - Under Development (1) 2,995 0.4% - - - - - - - Total $ 854,043 100.0% $ 48,182 $2,963 100.0% 208 11,428 4,695 423 Real Estate Portfolio Snapshot Six Months Ended June 30, 2012 Investment per Bed/Unit |
|
|
9 “Same Property Portfolio” Statistics (1) Real Estate Portfolio Metrics REAL ESTATE PORTFOLIO “Same Property Portfolio” Quality Mix Owned Properties 1Q12 4Q11 1Q12 4Q11 1Q12 4Q11 Assisted Living (2) 78.1% 78.7% 1.39 1.38 1.61 1.60 Assisted Living (3) 88.2% 88.5% 1.45 1.43 1.71 1.68 Skilled Nursing 78.6% 79.1% 1.86 2.01 2.56 2.71 Other Senior Housing 87.4% 86.5% 1.36 1.43 1.77 1.85 (1) (2) (3) Includes properties leased to Assisted Living Concepts, Inc. (ALC) Excludes properties leased to Assisted Living Concepts, Inc. (ALC) Occupancy EBITDAR Coverage EBITDARM Coverage Information is for the trailing twelve months through March 31, 2012 and December 31, 2011 and is from property level operator financial statements which are unaudited and have not been independently verified by us. For the Three Months Ended Owned Properties Payor Source (1) March 31, 2012 Private Pay 59.8% Medicare 13.8% Medicaid 26.3% (1) Quality mix for our skilled nursing portfolio, for the period presented, is 25.6% Private Pay, 25.3% Medicare, and 49.1% Medicaid. |
|
|
10 Real Estate Portfolio Metrics Historical Portfolio Snapshot (1) REAL ESTATE PORTFOLIO Data from property level operator financial statements which are unaudited and have not been independently verified by us. Coverage is based on the trailing twelve months for each period presented. The Centers for Medicare & Medicaid Services (or CMS) annually updates Medicare skilled nursing facility prospective payment system rates and other policies. In 4Q2010 CMS implemented the Resource Utilization Groups, version four (or RUG-IV) patient classification system. Although the implementation of RUG-IV was intended to be budget-neutral, according to CMS, this change in case-mix classification methodology resulted in a significant increase in Medicare expenditures, in part because the proportion of patients grouped in the highest-paying RUG therapy categories greatly exceeded CMS expectations. In July 2011, CMS issued its final rule updating skilled nursing facility rates for fiscal year 2012, which began in 4Q2011. The final rule included a recalibration of the case-mix indexes that form RUG-IV and reduced average aggregate Medicare reimbursement to skilled nursing facilities by 11.1%. The following table represents a snapshot of our historical portfolio of stabilized skilled nursing properties in 3Q2010 (prior to the implementation of RUG-IV) through 1Q2012 on a same property basis to illustrate the trend in the lease coverage as RUG-IV is implemented (4Q2010) and Medicare rates were subsequently cut (4Q2011). RUG-IV Period (2) EBITDAR Coverage EBITDARM Coverage 2Q RUG-IV 1Q2012 2.01 2.76 3Q RUG-IV 4Q2011 2.16 2.93 4Q RUG-IV 3Q2011 2.27 3.04 3Q RUG-IV 2Q2011 2.20 2.98 2Q RUG-IV 1Q2011 2.16 2.94 1Q RUG-IV 4Q2010 2.02 2.79 No RUG-IV 3Q2010 1.89 2.64 |
|
|
11 Proforma Real Estate Portfolio Diversification REAL ESTATE PORTFOLIO Property and Asset Type Diversification - Owned and Loan Portfolio We have two properties under development: 120-bed skilled nursing property in Texas which will replace an existing 90-bed skilled nursing property we own and 60-unit free-standing memory care property in Colorado. Gross Gross Property Type Investment % % Asset Type Investment % Skilled Nursing 90 462,593 $ 54.2% 28,436 $ 55.6% Real Property 803,797 $ 94.1% Assisted Living 102 308,534 36.1% 17,823 34.8% Loans Receivable 50,246 5.9% Other Senior Housing 14 67,685 7.9% 4,090 8.0% Total 854,043 $ 100.0% Schools 2 12,236 1.4% 796 1.6% Under Development (1) - 2,995 0.4% - - Total 208 854,043 $ 100.0% 51,145 $ 100.0% Properties Revenue Six Months Ended June 30, 2012 # of |
|
|
12 Proforma Real Estate Portfolio Diversification REAL ESTATE PORTFOLIO State Diversification By Property Type - Owned and Loan Portfolio Due to master leases with properties in multiple states, revenue by state is not available. Under Development Properties. See definition in the Glossary. (dollar amounts in thousands) State (1) Gross Investment % Texas 229,490 $ 26.9% Ohio 110,804 13.0% Florida 67,859 7.9% California 51,701 6.1% New Mexico 49,114 5.8% Arizona 41,212 4.8% Colorado 29,849 3.5% Virginia 29,052 3.4% Washington 27,888 3.3% Kansas 20,844 2.4% All Others 196,230 22.9% Total 854,043 $ 100.0% State (1) # of Props ALF % SNF % Other % School % UDP(2) % Gross Investment % Texas 56 $ 32,193 10.4% 187,703 $ 40.6% $ 8,632 12.8% $ - - 962$ 32.1% $ 229,490 26.9% Ohio 19 44,647 14.5% 66,157 14.3% - - - - - - 110,804 13.0% Florida 17 36,613 11.9% 17,826 3.9% 13,420 19.8% - - - - 67,859 7.9% California 5 28,071 9.1% 20,649 4.5% 2,981 4.4% - - - - 51,701 6.1% New Mexico 7 - - 49,114 10.6% - - - - - - 49,114 5.8% Arizona 7 5,120 1.7% 36,092 7.8% - - - - - - 41,212 4.8% Colorado 10 18,402 6.0% 7,407 1.6% 2,007 3.0% - - 2,033 67.9% 29,849 3.5% Virginia 4 - - 15,713 3.4% 13,339 19.7% - - - - 29,052 3.4% Washington 10 19,080 6.2% 8,808 1.9% - - - - - - 27,888 3.3% Kansas 7 6,733 2.2% 14,111 3.1% - - - - - - 20,844 2.4% All Others 66 117,675 38.0% 39,013 8.3% 27,306 40.3% 12,236 100.0% - - 196,230 22.9% Total 208 $ 308,534 100.0% 462,593 $ 100.0% $ 67,685 100.0% $ 12,236 100.0% 2,995 $ 100.0% $ 854,043 100.0% |
|
|
13 Proforma Real Estate Portfolio Diversification REAL ESTATE PORTFOLIO Operator Diversification - Owned Portfolio Operator % % Extendicare REIT and Assisted Living Concepts, Inc 37 88,034 $ 11.0% 10,963 $ 12.0% Brookdale Senior Living Communities, Inc. 35 84,210 10.5% 10,734 11.7% Preferred Care 25 77,206 9.6% 10,588 11.6% Senior Care Centers, LLC 5 63,698 7.9% 6,730 7.4% Carespring Health Care Mgt, LLC 2 54,000 6.7% 5,434 5.9% Meridian Senior Properties Fund II, LP 4 50,841 6.3% 4,742 5.2% Traditions Management 4 48,500 6.0% 5,243 5.7% Skilled Healthcare Group, Inc. 5 40,270 5.0% 4,501 4.9% Sunrise Senior Living 6 37,659 4.7% 4,614 5.0% Ensign Group, Inc. 3 28,496 3.5% 1,596 1.7% All Others 48 230,883 28.8% 26,397 28.9% Total 174 803,797 $ 100.0% 91,542 $ 100.0% Annualized GAAP Rent Gross Investment # of Properties |
|
|
Proforma Top Ten Operators – Owned Portfolio REAL ESTATE PORTFOLIO Extendicare REIT and Assisted Living Concepts, Inc (TSX: EXE.UN) operates 262 senior care facilities in Canada and in the United States with the ability to serve approximately 28,213 residents. EHSI offers a continuum of health care services, including nursing care, assisted living and related medical specialty services, such as sub-acute care and rehabilitative therapy on an inpatient and outpatient basis. ALC (NYSE: ALC) and its subsidiaries operate 211 residences which include licensed assisted living and independent living residences with capacity for 9,325 residents in 20 states. As of June 30, 2012 the LTC portfolio consisted of 37 assisted living properties in 10 states with a gross investment balance of $88.0 million. Brookdale Senior Living, Inc. (NYSE: BKD) operates 647 independent living, assisted living, and dementia-care communities and continuing care retirement centers, with the ability to serve approximately 67,000 residents. As of June 30, 2012, the LTC portfolio consisted of 35 assisted living properties in 8 states with a gross investment balance of $84.2 million. Preferred Care, Inc. (Privately held) operates 87 facilities comprised of skilled nursing, assisted living, and independent living facilities, as well as 5 specialty care facilities, in 11 states. As of June 30, 2012, the LTC portfolio consisted of 23 skilled nursing and 2 other senior housing properties in 6 states with a gross investment balance of $77.2 million. They also operate 1 skilled nursing facility under a sub-lease with another lessee we have which is not included in the Preferred Care rental revenue. Skilled Healthcare Group (NYSE: SKH) is a holding company with subsidiaries that operate skilled nursing facilities, assisted living facilities, a rehabilitation therapy business, and a hospice business. Skilled Healthcare operates in 8 states, including 74 skilled nursing facilities and 23 assisted living facilities. As of June 30, 2012, the LTC portfolio consisted of 5 skilled nursing properties in 1 state with a gross investment balance of $40.3 million. Meridian Realty Advisors, LP through its affiliates including Meridian Senior Properties Fund II, LP (Privately held) acquires and develops independent living, assisted living/memory care and skilled nursing facilities and (owns or leases) 10 skilled nursing facilities and one assisted living facility, all located in Texas. They are currently developing three new assisted living/memory care facilities and one skilled nursing facility. As of June 30, 2012, the LTC portfolio consisted of 4 skilled nursing properties in 1 state with a gross investment balance of $50.8 million. Senior Care Centers, LLC (Privately held) provides skilled nursing care, Alzheimer's care, assisted living, and independent living services in 35 facilities exclusively in Texas. As of proforma June 30, 2012, the LTC portfolio consisted of 5 skilled nursing properties in 1 state with a gross investment balance of $63.7 million. They also operate 4 skilled nursing properties under a sub-lease with Meridian Senior Properties Fund II, LP which is not included in the Senior Care Centers, LLC rental revenue. Carespring Health Care Mgmt, LLC (Privately held) provides skilled nursing, assisted living, and independent living services, and other rehabilitative and healthcare services at 13 facilities in 2 states. As of proforma June 30, 2012, the LTC portfolio consisted of 2 skilled nursing properties in 1 state with a gross investment balance of $54.0 million. Sunrise Senior Living (NYSE: SRZ) operates 311 communities in the United States, Canada and the United Kingdom, with a total capacity of approximately 31,000 units. Sunrise offers a full range of personalized senior living services, including independent living, assisted living, care for individuals with Alzheimer’s disease and other forms of memory loss, as well as Nursing and Rehabilitative services. As of June 30, 2012, the LTC portfolio consisted of 6 assisted living properties in 2 states with a gross investment balance of $37.7 million. Traditions Senior Management, Inc. (Privately held) operates 10 facilities in 4 states consisting of independent living, assisted living, and skilled nursing. As of June 30, 2012, the LTC portfolio consisted of 3 skilled nursing and 1 other senior housing properties in 3 states with a gross investment balance of $48.5 million. They also operate 2 skilled nursing properties under a sub-lease with Preferred Care, Inc. which is not included in the Traditions Management rental revenue. The Ensign Group (NASDAQ: ENSG) provides skilled nursing and assisted living services, physical, occupational and speech therapies, home health and hospice services, and other rehabilitative and healthcare services for both long-term residents and short-stay rehabilitation patients at 106 facilities in 10 states. As of June 30, 2012, the LTC portfolio consisted of 3 skilled nursing properties in 1 state with a gross investment balance of $28.5 million. |
|
|
15 Market Capitalization Includes amortization of debt issue cost. Includes letter of credit fees. Non-traded shares. Two million shares outstanding with a face rate of 8.5% and a liquidation value of $19.25 per share, convertible into common stock on a one-for-one basis. Our Series C preferred stock are not redeemable by us. Traded on NYSE. Closing price of our common stock as reported by the NYSE on June 29, 2012, the last trading of second quarter 2012. FINANCIAL (In thousands, except per share amounts and number of shares) Capitalization Bank borrowings - LIBOR + 125 bps 68,000 $ Senior unsecured notes -weighted average rate 5.24% (1) 100,000 Bonds payable - weighted average rate 2.22% (2) 2,635 Total debt 170,635 13.0% No. of shares Preferred stock -Series C (3) 38,500 2.9% Common stock (4) 30,444,774 36.28 $ (5) 1,104,536 84.1% Non-controlling interest 406 0.0% Total equity 1,143,442 87.0% 1,314,077 $ 100.0% Debt to Market Cap Debt & Preferred to Market Cap 13.0% 15.9% Equity Closing Price Market Capitalization At June 30, 2012 Debt |
|
|
16 Proforma Market Capitalization Includes amortization of debt issue cost. Includes letter of credit fees. Non-traded shares. Two million shares outstanding with a face rate of 8.5% and a liquidation value of $19.25 per share, convertible into common stock on a one-for-one basis. Our Series C preferred stock are not redeemable by us. Traded on NYSE. Closing price of our common stock as reported by the NYSE on June 29, 2012, the last trading of second quarter 2012. FINANCIAL (In thousands, except per share amounts and number of shares) Capitalization Bank borrowings - LIBOR + 125 bps 43,400 $ Senior unsecured notes -weighted average rate 5.17% (1) 185,800 Bonds payable - weighted average rate 2.22% (2) 2,635 Total debt 231,835 16.9% No. of shares Preferred stock -Series C (3) 38,500 2.8% Common stock (4) 30,444,774 36.28 $ (5) 1,104,536 80.3% Non-controlling interest 406 0.0% Total equity 1,143,442 83.1% 1,375,277 100.0% Debt to Market Cap Debt & Preferred to Market Cap At June 30, 2012 Debt 16.9% 19.7% Equity Closing Price Market Capitalization |
|
|
17 Proforma Lease and Mortgage Loan Receivable Maturity LTC’s investment portfolio has a long-term weighted roll-over maturity schedule. Over 78% of the portfolio has lease expirations after 2017. Over 23% of outstanding mortgage loans mature after 2017. FINANCIAL Investment Portfolio Maturity Schedule (as a % of total gross owned investment and mortgage loans outstanding) (dollar amounts in thousands) The lease that expired in July 2012 was replaced with a new lease expiring in July 2022. Reflects annualized contract rate of interest for loans, net of collectability reserves, if applicable. Year % of Total % of Total % of Total 2012 (1) 496 $ 0.5% 19 $ 0.4% 515 $ 0.5% 2013 453 0.5% 1,912 41.3% 2,365 2.5% 2014 12,951 14.1% 849 18.3% 13,800 14.3% 2015 2,539 2.8% 269 5.8% 2,808 2.9% 2016 2,129 2.3% 26 0.6% 2,155 2.2% 2017 1,615 1.8% 627 13.5% 2,242 2.3% 2018 11,262 12.3% 803 17.4% 12,065 12.5% 2019 1,596 1.7% 123 2.7% 1,719 1.9% 58,501 64.0% - - 58,501 60.9% Total 91,542 $ 100.0% 4,628 $ 100.0% 96,170 $ 100.0% Rental Revenue and Interest Income Maturity Annualized GAAP Rental Income Interest Income (2) Total Rental & Interest Income Thereafter |
|
|
18 Proforma Debt Maturity (in thousands) FINANCIAL (in thousands) $ - $ - $ 600 $ 600 - 4,167 635 4,802 - 29,166 1,400 30,566 43,400 16,667 - 60,067 - 14,167 - 14,167 - 14,167 - 14,167 - 11,666 - 11,666 - 95,800 - 95,800 $ 43,400 $ 185,800 $ 2,635 $ 231,835 (1) Total 2016 2017 Reflects scheduled principal payments. Thereafter 2019 Year 2018 2013 2014 Unsecured Line of Credit Senior Unsecured Notes (1) Bonds Payable (1) Total 2015 |
|
|
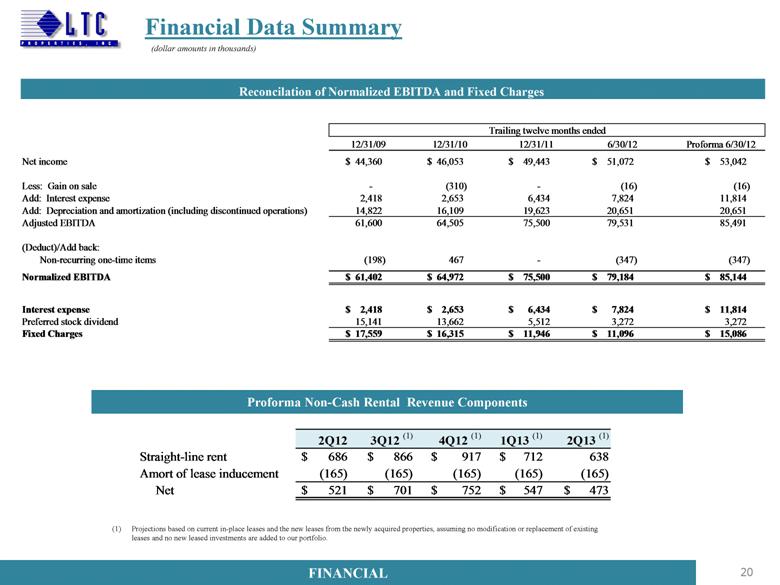
19 Financial Data Summary FINANCIAL (dollar amounts in thousands) Gross asset value represents undepreciated book value. Balance Sheet and Coverage Ratios 12/31/09 12/31/10 12/31/11 6/30/12 Net real estate assets $444,163 $515,983 $599,916 $605,652 $666,152 Total assets 490,593 561,264 647,097 654,854 722,014 Total debt 25,410 91,430 159,200 170,635 231,835 Total liabilities 36,280 103,742 178,387 189,392 250,592 Preferred stock 186,801 126,913 38,500 38,500 38,500 Total equity 454,313 457,522 468,710 465,462 471,422 Debt to gross asset value ratio (1) 4.0% 12.7% 19.3% 20.3% 25.5% Debt & preferred stock to gross asset value ratio (1) 33.4% 30.3% 24.0% 24.8% 29.7% Debt to market capitalization ratio 3.0% 9.5% 14.0% 13.0% 16.9% Debt & preferred stock to market capitalization ratio 25.1% 23.0% 17.4% 15.9% 19.7% Debt to normalized EBITDA 0.4x 1.4x 2.1x 2.2x 2.7x Normalized interest coverage ratio 25.4x 24.5x 11.8x 10.1x 7.2x Normalized fixed charge coverage ratio 3.5x 4.0x 6.4x 7.1x 5.6x Trailing twelve months ended Proforma 6/30/12 |
|
|
20 Financial
Data Summary FINANCIAL FINANCIAL (dollar amounts in thousands) Proforma
Non-Cash Rental Revenue Components Projections based on current in-place
leases and the new leases from the newly acquired properties, assuming no
modification or replacement of existing |
|
|
Consolidated Statements of Income 21 FINANCIAL FINANCIAL (dollar amounts in thousands, except per share amounts, unaudited) 2012 2011 2012 2011 Revenues Rental income 21,175 $ 19,337 $ 42,047 $ 37,519 $ Interest from mortgage loans 1,431 1,613 2,963 3,269 Interest and other income 484 230 720 645 Total revenues 23,090 21,180 45,730 41,433 Expenses Interest expense 2,004 1,543 4,037 2,647 Depreciation and amortization 5,369 4,918 10,536 9,350 Acquisition costs 141 35 182 165 Operating and other expenses 2,433 2,323 4,885 4,637 Total expenses 9,947 8,819 19,640 16,799 Income from continuing operations 13,143 12,361 26,090 24,634 Discontinued operations: Loss from discontinued operations (30) (99) (61) (218) Gain on sale of assets, net - - 16 0 Net loss from discontinued operations (30) (99) (45) (218) Net income 13,113 12,262 26,045 24,416 Income allocated to non-controlling interests (10) (48) (21) (96) Net income attributable to LTC Properties, Inc. 13,103 12,214 26,024 24,320 Income allocated to participating securities (91) (85) (185) (174) Income allocated to preferred stockholders (818) (818) (1,636) (7,442) Net income available to common stockholders 12,194 $ 11,311 $ 24,203 $ 16,704 $ Basic earnings per common share: $0.40 $0.38 $0.80 $0.59 Diluted earnings per common share: $0.40 $0.37 $0.80 $0.59 Weighted average shares used to calculate earnings per common share Basic 30,213 30,135 30,201 28,233 Diluted 30,258 30,168 30,246 28,264 June 30, Six Months Ended Three Months Ended June 30, |
|
|
Consolidated Balance Sheets 22 FINANCIAL FINANCIAL (amounts in thousands) June 30, 2012 December 31, 2011 June 30, 2012 December 31, 2011 (unaudited) (unaudited) ASSETS LIABILITIES Real estate investments: Bank borrowings 68,000 $ 56,000 $ Land 60,362 $ 57,059 $ Senior unsecured notes 100,000 100,000 Buildings and improvements 677,297 659,453 Bonds payable 2,635 3,200 Accumulated depreciation and amortization (186,394) (175,933) Accrued interest 1,156 1,356 Net operating real estate property 551,265 540,579 Earn-out liabilities 6,524 6,305 Accrued expenses and other liabilities 10,938 11,314 Properties held-for-sale, net of accumulated depreciation Accrued expenses and other liabilities related to and amortization: 2012 - $613; 2011 - $2,263 5,025 6,256 properties held-for-sale 139 212 Net real estate property 556,290 546,835 Total liabilities 189,392 178,387 Mortgage loans receivable, net of allowance for doubtful accounts: 2012 - $884; 2011 - $921 49,362 53,081 Real estate investments, net 605,652 599,916 EQUITY Preferred stock (1) 38,500 38,500 Other assets: Common stock (2) 304 303 Cash and cash equivalents 10,313 4,408 Capital in excess of par value 507,752 507,343 Debt issue costs, net 2,698 2,301 Cumulative net income 698,767 672,743 Interest receivable 1,062 1,494 Other 169 199 Straight-line rent receivable, net of allowance Cumulative distributions (780,436) (752,340) for doubtful accounts: 2012 - $688; 2011 - $680 25,089 23,772 Total LTC Properties, Inc. stockholders' equity 465,056 466,748 Prepaid expenses and other assets 7,341 7,851 Other assets related to properties held-for-sale, net of Non-controlling interests 406 1,962 allowance for doubtful accounts: 2012 - $839; 2011 - $839 52 53 Notes receivable 2,647 817 Total equity 465,462 468,710 Marketable securities - 6,485 Total assets 654,854 $ 647,097 $ Total liabilities and equity 654,854 $ 647,097 $ (1) Preferred stock $0.01 par value; 15,000 shares authorized; shares issued and outstanding: 2012 - 2,000; 2011 - 2,000 (2) Common stock $0.01 par value; 60,000 shares authorized; shares issued and outstanding: 2012 - 30,445; 2011 - 30,346 |
|
|
Funds from Operations 23 FINANCIAL FINANCIAL (dollar amounts in thousands, except per share amounts)) 2012 2011 2012 2011 Net income available to common stockholders $ 12,194 $ 11,311 $ 24,203 $ 16,704 Add: Depreciation and amortization (continuing and discontinued operations) 5,369 4,987 10,536 9,508 Less: Gain on sale of real estate, net - - (16) - FFO available to common stockholders 17,563 16,298 34,723 26,212 Add: Preferred stock redemption charge - - - 3,566 (1) Add: Preferred stock redemption dividend - - - 472 (2) Add: Non-cash interest related to earn-out liabilities 110 177 220 177 Add: Non-recurring one time items (347) (3) - (347) (3) - Normalized FFO available to common stockholders 17,326 16,475 34,596 30,427 Less: Non-cash rental income (521) (750) (1,003) (1,356) Normalized adjusted FFO (AFFO) 16,805 15,725 33,593 29,071 Add: Non-cash compensation charges 458 363 910 721 Normalized funds available for distribution (FAD) $ 17,263 $ 16,088 $ 34,503 $ 29,792 $0.57 $0.53 $1.13 $0.92 $0.56 $0.54 $1.12 $1.06 $0.55 $0.51 $1.09 $1.01 $0.56 $0.52 $1.12 $1.04 (1) (2) (3) Represents the dividends on the Series F preferred stock up to the redemption date. Diluted FFO available to common stockholders per share Diluted normalized FFO available to common stockholders per share Diluted normalized AFFO per share Respresents revenue from the Sunwest bankruptcy settlement distribution. FFO Reconciliation Six Months Ended June 30, June 30, Three Months Ended Represents the original issue costs related to the redemption of the remaining Series F preferred stock. Diluted normalized FAD per share |
|
|
24 GLOSSARY Glossary Adjusted Funds From Operations (“AFFO”): FFO excluding the effects of non-cash rental income. Assisted Living Properties (“ALF”): Senior housing properties serving elderly persons who require assistance with activities of daily living, but do not require the constant supervision skilled nursing properties provide. Services are usually available 24 hours a day and include personal supervision and assistance with eating, bathing, grooming and administering medication. The facilities provide a combination of housing, supportive services, personalized assistance and health care designed to respond to individual needs. Contractual Lease Rent: Rental revenue as defined by the lease agreement between us and the operator for the lease year. EBITDA: Earnings before interest, taxes, depreciation and amortization. EBITDAR Coverage: From the operator financial statements, the trailing twelve month’s earnings before interest, taxes, depreciation, amortization, and rent divided by the operator’s contractual lease rent. Management fees are imputed at 5% of revenues. EBITDARM Coverage: From the operator financial statements, the trailing twelve month’s earnings before interest, taxes, depreciation, amortization, rent and management fees divided by the operator’s contractual lease rent. Funds Available for Distribution (“FAD”): FFO excluding the effects of non-cash rental income and non-cash compensation charges. Funds From Operations (“FFO”): A s defined by the National Association of Real Estate Investment Trusts (“NAREIT”), net income available to common stockholders (computed in accordance with U.S. GAAP) excluding gains or losses on the sale of real estate and impairment write-downs of depreciable real estate plus real estate depreciation and amortization, and after adjustments for unconsolidated partnerships and joint ventures. GAAP Lease Yield: GAAP rent divided by the purchase price. GAAP Rent: Total rent we will receive as a fixed amount over the life of the lease and recognized evenly over that life. GAAP rent recorded in the early years of a lease is higher than the cash rent received and during the later years of the lease, the cash rent received is higher than GAAP rent recognized. GAAP rent is commonly referred to as straight-line rental income. Gross Asset Value: Represents undepreciated book value. Gross Investment: Original price paid for an asset plus capital improvements funded by LTC Properties, Inc. (“LTC”), without any depreciation deductions. Gross Investment is commonly referred to as undepreciated book value. Independent Living Properties (“ILF”) : Senior housing properties offer ing numerous levels of service, such as laundry, housekeeping, dining options/meal plans, exercise and wellness programs, transportation, social, cultural and recreational activities, on-site security and emergency response programs. Many offer on-site conveniences like beauty/barber shops, fitness facilities, game rooms, libraries and activity centers. ILFs are also known as retirement communities or senior apartments. |
|
|
25 GLOSSARY Glossary Interest Income: Represents interest income from mortgage loans. Licensed Beds/Units: The number of beds and/or units that an operator is authorized to operate at a senior housing property Licensed beds and/or units may differ from the number of beds and/or units in service at any given time. Net Real Estate Assets: Gross investment less accumulated depreciation. Net Real Estate Asset is commonly referred to as Net Book Value (“NBV”). Non-cash Rental Income: Straight-line rental income and amortization of lease inducement. Non-cash C ompens ation C harges: Vesting expense relating to stock option s and restricted stock. Normalized AFFO: FFO adjusted for non-recurring, infrequent or unusual items and excludes the non-cash rental income. Normalized FAD: FFO adjusted for non-recurring, infrequent or unusual items and excludes the non-cash rental income and non-cash compensation charges. Normalized FFO: FFO adjusted for non-recurring, infrequent or unusual items. Occupancy: The weighted average percentage of all beds and/or units that are occupied at a given time. The calculation uses the trailing twelve months and is based on licensed beds and/or units which may differ from the number of beds and/or units in service at any given time. Operator Fin ancial Statements: Property level operator financial statements are unaudited and have not been independently verified by us. Other Senior Housing: Senior housing p roperties consisting of independent living properties and properties providing any combination of skilled nursing, assisted living and/or independent living services. Private Pay: Private pay includes private insurance, HMO, VA, and other payors. Purchase Price: Represent s the fair value price of an asset that is exchanged in an orderly transaction between market participants at the measurement date. An orderly transaction is a transaction that assumes exposure to the market for a period prior to the measurement date to a llow for marketing activities that are usual and customary for transactions involving such assets; it is not a forced transaction (for example, a forced liquidation or distress sale). Quality Mix: LTC revenue by operator underlying payor source for the quarter presented. LTC is not a Medicaid or a Medicare recipient. Statistics represent LTC's rental revenues times operators' underlying payor source revenue percentage. Underlying payor source revenue percentage is calculated from property level operator financial statements which are unaudited and have not been independently verified by us. Rental Income: Represents GAAP rent net of amortized lease inducement cost from continuing and discontinued operations. |
|
|
26 GLOSSARY Glossary Same Property Portfolio (“SPP”): Same property statistics allow management to evaluate the performance of LTC’s leased property portfolio under a consistent population, which eliminates the changes in the composition of our portfolio of properties. We identify our same property portfolio as stabilized properties that are, and remained, in operations for the duration of the quarter-over quarter comparison periods presented. Accordingly, it takes a stabilized property a minimum of 12 months in operations to be included in our same property portfolio. Schools: An institution for educating students which include private and charter schools. Private schools are not administered by local, state or national governments; therefore, funded in whole or part by student tuition rather than government funded. Charter schools provide an alternative to the traditional public school. Charter schools are generally autonomous entities authorized by the state or locality to conduct operations independent from the surrounding public school district. Laws vary by state, but generally charters are granted by state boards of education either directly or in conjunction with local school districts or public universities. Operators are granted charters to establish and operate schools based on the goals and objectives set forth in the charter. Upon receipt of a charter, schools receive an annuity from the state for each student enrolled. Skilled Nursing Properties (“SNF”): Senior housing properties providing restorative, rehabilitative and nursing care for people not requiring the more extensive and sophisticated treatment available at acute care hospitals. Many SNFs provide ancillary services that include occupational, speech, physical, respiratory and IV therapies, as well as sub-acute care services which are paid either by the patient, the patient’s family, private health insurance, or through the federal Medicare or state Medicaid programs. Stabilized: Newly acquired operating assets are generally considered sta bilized at the earlier of lease-up (typically when occupancy reaches 80% at a SNF or 90% at an ALF) or 12 months from the acquisition date. Newly completed developments, including redevelopments, major renovations, and property additions, are considered stabilized at the earlier of lease-up or 24 months from the date the property is placed in service. Under Development Properties (“UDP”): Development projects to construct senior living properties. |