Attached files
| file | filename |
|---|---|
| 8-K - FORM 8-K - FAIRPOINT COMMUNICATIONS INC | d391112d8k.htm |
 August
2012 Investor Presentation
Exhibit 99.1 |
 Notices
and
Safe
Harbors
2 |
 Company
Overview •
Incumbent communications provider in ME,
NH and VT (“Northern New England”)
Over 1 million access line equivalent
Significant organic growth opportunity,
especially in business market
Ubiquitous, next-generation network
Over 14,000 route miles of fiber attracts
sustainable, IP/Ethernet based revenues and
lowers network operating cost
85% average broadband availability
•
Serving the communications needs of rural
communities in 15 other states (“Telecom
Group”)
263k access line equivalents
Less competition
Local presence and workforce
90% average broadband availability
49% broadband penetration
•
$1 billion LTM revenue and ~3,400 employees
Service Territory
Telecom Group
Northern New England
Access Line Equivalents
(1)
Switched access lines plus broadband subscribers as of June 30, 2012
(2)
UNE-P and Resale lines. Excludes UNE-L and Special Access circuits
(3)
Broadband subscribers as a percentage of voice access lines
3
as of June 30, 2012
Northern
New
England
Telecom
Group
Total
Switched access lines:
Residential
490,944
128,296
619,240
Business
258,718
47,964
306,682
Wholesale
2
69,375
NM
69,375
Total switched access lines
819,037
176,260
995,297
Broadband subscribers
234,308
86,504
320,812
Total access line equivalents
1,053,345
262,764
1,316,109
1
3 |
 Path to
Increasing Shareholder Value 4
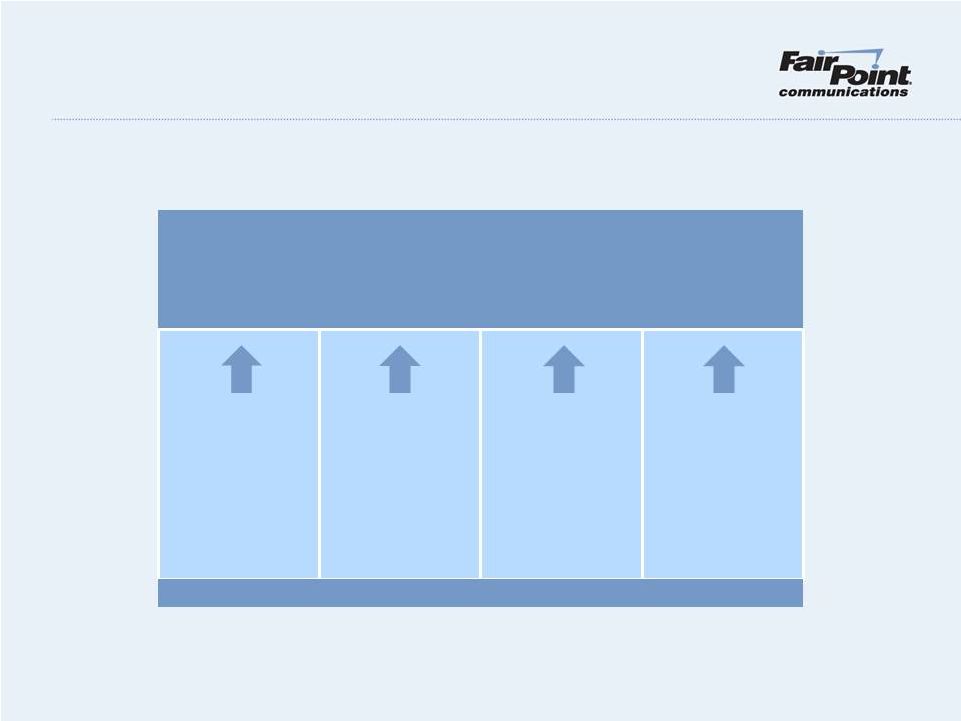
Four Pillar Strategy for
Increasing Free Cash Flow
Improve
Operations
Change
Regulatory
Environment
Transform
and Grow
Revenue
Execute
Human
Resource
Strategy |
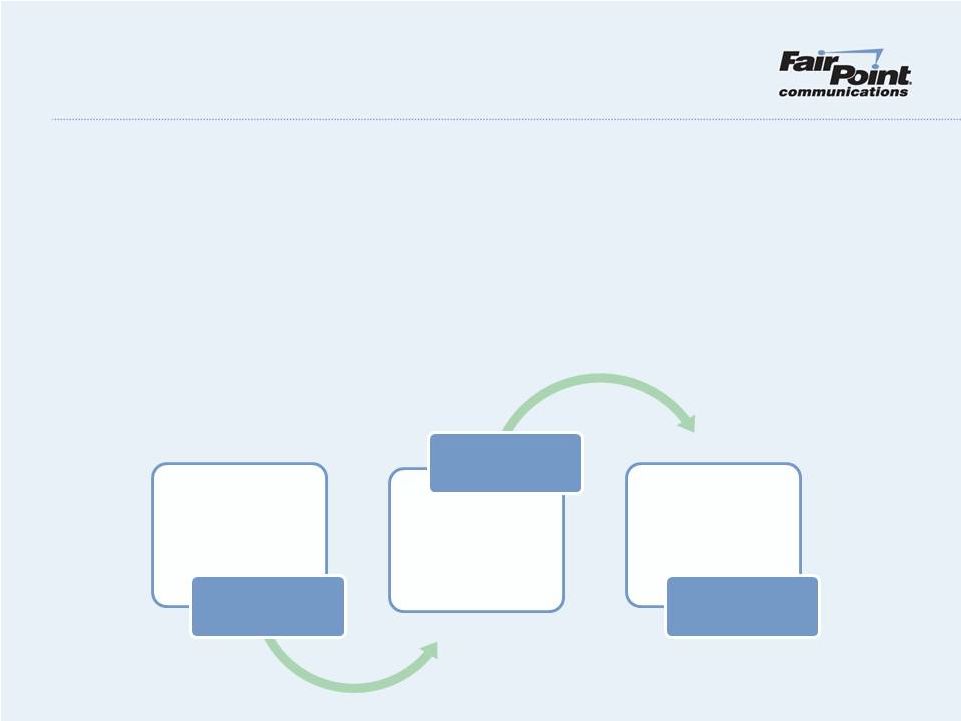
 Established Track
Record for Three Pillars 5
Execute HR
Strategy
Improve
Operations
Change
Regulatory
Environment
Transform &
Grow
Revenue
Proven
Complex project
management
Improved service
quality
Maintain service
quality after
reductions in force
Proven
Executing
2012-2013 Focus
Level playing field
Legislation in Maine
and New Hampshire;
Vermont IRP
FCC ICC/USF
reform
IBEW 2011 Force
Adjustment Process
(FAP)
CWA 2012 FAP
executed in 30 days
Enhanced
competencies in Labor
Relations and Learning
& Development
2012: Sales force &
customer segment
alignment
2012: Revenue
transformation
2013+: Revenue
stability and growth |
 Operational
Improvements FairPoint continues to make significant operational
improvements
•
5.1% YoY broadband growth
•
Slowdown in voice access line loss, especially in
business
Business Voice Line Loss (YoY)
Broadband Subscribers
-8.5%
-8.3%
-7.8%
-6.9%
-6.3%
-5.1%
-4.0%
-3.4%
-10.0%
-9.0%
-8.0%
-7.0%
-6.0%
-5.0%
-4.0%
-3.0%
-2.0%
3Q10
4Q10
1Q11
2Q11
3Q11
4Q11
1Q12
2Q12
270k
280k
290k
300k
310k
320k
330k
3Q10
4Q10
1Q11
2Q11
3Q11
4Q11
1Q12
2Q12
(1)
Refers to Northern New England only
6
–
7.8% YoY total voice line loss
–
3.4% YoY business voice line loss
–
0.8% business voice line loss in 2Q12
•
Fiber-to-the-Tower initiative
–
800+ towers served with fiber
–
Opportunities for further expansion
–
26% YoY reduction in repair calls and
–
30% YoY reduction in repeat trouble calls
–
24% QoQ improvement in broadband
installation intervals
–
8% QoQ improvement in Ethernet
trouble reports
•
Meaningful
improvement
in
service
quality
¹
¹
installation intervals |
 Regulatory
Progress •
Regulators and legislators in Maine, New Hampshire and Vermont have responded to
FairPoint’s message of the need for a level playing field
•
Improvement in service quality and recognition of need for strong communications
infrastructure provider promotes the concept of a level playing field
•
Benefits include:
–
Increased competitiveness with unregulated providers
–
Fewer
service
quality
metrics
and
lowered
caps
in
retail
service
quality
penalties
–
Reduction in regulatory administrative burden
7
•Regulatory reform
required to fulfill
mission
•26% of Business
Market
Level Playing
Field
Sustainable
Growing Revenue
•Business
•Broadband
•Ethernet/Transport
Strong
Communications
Infrastructure
•Strong provider of last
resort
•Extension of
broadband to unserved
and underserved
regions |
 Revenue
Transformation Total
Revenue
Growth
Products
Residential
Voice
8
FairPoint plans to change the composition of its
revenue base in order to stabilize and then
grow our top line
Low market share, especially in business
market, creates opportunity for organic growth
in northern New England
Next-generation network on 14k fiber route
miles in northern New England provides
platform for growth
•
Legacy products in decline
•
Growth-oriented products
–
Residential voice
–
Revenue churn arising from:
–
copper to fiber
–
TDM to IP
–
Broadband (business and residential)
–
SMB products and services
–
Ethernet services
–
Other high-capacity/transport and management
services
Revenue Transformation |
 Human Resource
Strategy FairPoint must align its human resource assets
with the changing telecom landscape
•
15% workforce reduction since 2Q11
•
3,410 employees as of June 30, 2012
•
Increased labor relations competencies with
telecommunications focus
•
Pension & OPEB liabilities arise from
northern New England union contracts
•
New law lowers 2013 required pension
contribution
Pension & OPEB Sensitivity
(1)
Based upon liability at December 31, 2011
(2)
Please see FairPoint’s disclosure regarding the Moving Ahead for
Progress
in
the
21
which
was
furnished
with
the
SEC
on Form 8-K on July 19, 2012
Pension & OPEB GAAP Liability
($ in millions)
Pension
OPEB
Impact on liability given 1%
change in the discount rate
assumption
19%
23%
Impact on liability given 1%
increase in healthcare cost trend
assumption
N/A
$134.1
Impact on liability given 1%
decrease in healthcare cost trend
assumption
N/A
($101.1)
9
2
1
st
–
Lump sum pension distributions of $49 million
–
1,226 management
–
2,184 union (1,911 covered by CBAs with CWA
and IBEW in NNE, which expire Aug. 2014)
–
GAAP figures represent status quo into perpetuity
and reflect continuation of past practices
–
Pension and OPEB are highly sensitive to the
discount rate assumption (i.e. interest rates)
–
OPEB liability is highly sensitive to the medical
cost trend assumption
–
FairPoint’s 2012 contribution would have been
$8-10M lower, pro forma for the new law
Century Act,
($ in millions)
2010
2011
2Q12
Pension
Plan assets
$176.5
$160.3
$152.8
Projected benefit obligation
$265.8
$318.3
$308.9
Key assumptions:
Discount rate
5.56%
4.63%
4.61%
OPEB
Plan assets
Projected benefit obligation
$0.2
$344.9
$1.0
$533.2
$1.0
$556.6
Key assumptions:
Discount rate
5.65%
4.66%
4.66%
Healthcare cost trend (<65 years)
7.70%
8.40%
8.40%
Healthcare cost trend (>65 years)
8.20%
8.40%
8.40% |
 10
Tactical Outlook
2012
2013
2014
2015
Productivity gains
through process and
systems
enhancement
Regulatory
progress:
FCC, ME, VT & NH
Training and labor
relations
Transform revenue
Stabilize and grow
revenue
Productivity gains
through process and
systems
enhancement
Contingency
planning
Regulatory
FCC reform
Negotiation of labor
agreements
Stabilize operations
during negotiation
Regulatory
FCC reform
Grow revenue
Grow revenue
Productivity gains
through process
and systems
enhancement
Refinance
credit agreement |
 As of June
30, 2012: •
Liquidity of $107 million
–
$44 million unrestricted cash
–
$63 million of revolver availability, after
$12 million letters of credit
•
Leverage of 3.95x vs. 4.75x covenant
•
Interest coverage of 3.77x vs. 3.25x covenant
•
Covenant limiting capital expenditures to:
Capital Structure
Capital Structure Summary
(1)
Excludes letters of credit of $12 million and capital lease obligations of $3 million
(2)
Undrawn as of June 30, 2012, except for outstanding letters of credit of $12 million, which
reduces revolver availability (3)
Includes management restricted stock and common stock held in reserve for certain
pre-petition claims as of June 30, 2012
(in millions)
Cash and cash equivalents (unrestricted)
$44
Gross debt
$995
Revolver
$75
Amortization schedule:
2011
$0
2012
$10
2013
$10
2014
$25
2015
$38
January 24, 2016
$918
L+450, with LIBOR floor of 200
No dividends if leverage > 2.0x
Interest coverage and leverage covenants
Common stock outstanding
26.2
Warrants
(7 yr,
$48.81 strike) 3.6
¹
²
³
11
2012: $190 million + $20 million carryover
2013: $170 million
2014: $150 million
2015: $150 million |
 12
2012 Guidance:
•
Unlevered
Free
Cash
Flow
of
$90
to
$100
million
(after
pension
&
OPEB)
•
Continued focus on improving EBITDAR
•
Disciplined capital spending
•
Interest of approximately $68 million
•
Debt amortization of $10 million
Financial Results and Guidance
Financial Highlights
($ in millions)
3Q11
4Q11
1Q12
2Q12
LTM
Revenue
$257.9
$254.2
$248.5
$243.5
$1,004.0
Consolidated EBITDAR
60.5
70.0
55.3
70.2
256.0
Capital expenditures
35.2
35.1
26.3
32.1
128.6
Unlevered Free Cash Flow
2
$25.3
$34.9
$29.1
$38.1
$127.3
Cash on hand
$9.9
$17.4
$35.8
$43.8
$43.8
1
(1)
As defined in FairPoint’s credit facility. Consolidated EBITDAR is a
non-GAAP financial measure. For a reconciliation of Net Income (Loss) to Consolidated
EBITDAR, see our second
quarter
2012
earnings
release
furnished
August
2,
2012
on
Form
8-K
(2)
Unlevered Free Cash Flow means Consolidated EBITDAR minus capital
expenditures. Unlevered Free Cash Flow is a non-GAAP financial measure.
For
a
reconciliation
of
Net
Income
(Loss)
to
Unlevered
Free
Cash
Flow,
see
our
second
quarter
2012
earnings
release
furnished
August
2,
2012
on
Form
8-K |
 13
Summary
13
•
Operational improvements create foundation for transformation
–
–
–
•
Regulators and legislators are supportive of FairPoint’s need for a level playing
field –
–
•
Transforming revenue by adding sustainable, growth-oriented revenues on our
next-generation network in northern New England
–
–
–
•
Focus on increasing free cash flow to enhance shareholder value
–
–
–
–
–
–
–
–
Productivity enhancements and 15% workforce reduction
Focusing on productivity gains arising from process and systems enhancements
Deregulation in Maine and New Hampshire
Incentive Regulation Plan in Vermont
3 contiguous states with network ubiquity
14,000 fiber route miles
26% business market share
Broadband, FTTT and service quality improvements |
