Attached files
| file | filename |
|---|---|
| 8-K - 8-K - Matson, Inc. | a12-17574_18k.htm |
| EX-99.1 - EX-99.1 - Matson, Inc. | a12-17574_1ex99d1.htm |
Exhibit 99.2
|
|
Second Quarter 2012 Earnings Conference Call August 2, 2012 |
|
|
Forward-Looking Statements Statements during this call and presentation that set forth expectations, predictions, projections or are about future events are based on facts and situations that are known to us as of today, August 2, 2012. We believe that our expectations and assumptions are reasonable. Actual results may differ materially, due to risks and uncertainties, such as those described on pages 19-29 of the 2011 Form 10-K filed by Alexander & Baldwin, Inc. on February 28, 2012 and other subsequent filings by Matson with the SEC. Statements during this call and presentation are not guarantees of future performance. We do not undertake any obligation to update our forward-looking statements. |
|
|
Earnings Conference Call Agenda Opening remarks and review of operations by Matt Cox Review of financial performance and outlook by Joel Wine Summary by Matt Cox Questions and Answers |
|
|
Opening Remarks Successfully completed separation from A&B Headquarters established in Honolulu Launched Matson Foundation, our own corporate giving program Positive reception as a stand-alone company from debt and equity markets MATX began trading on NYSE Maintained operational focus |
|
|
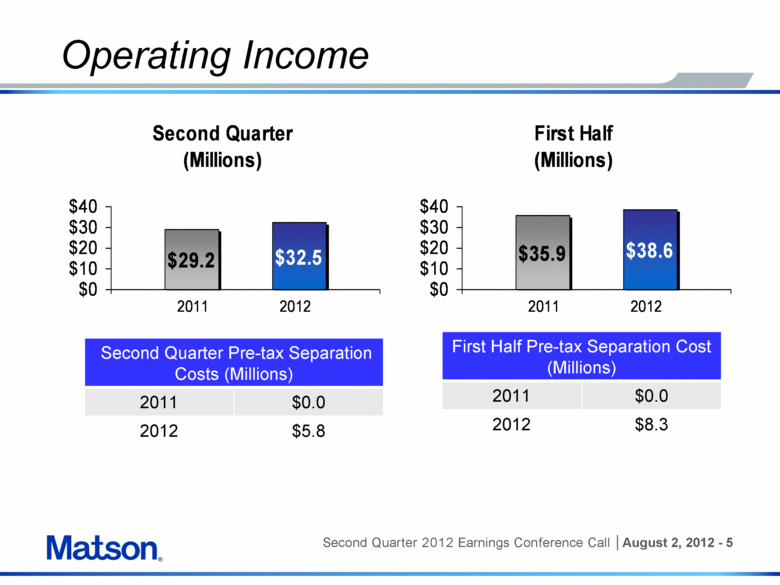
Operating Income Second Quarter Pre-tax Separation Costs (Millions) 2011 $0.0 2012 $5.8 First Half Pre-tax Separation Cost (Millions) 2011 $0.0 2012 $8.3 Second Quarter (Millions) $29.2 $32.5 $0 $10 $20 $30 $40 2011 2012 First Half (Millions) $35.9 $38.6 $0 $10 $20 $30 $40 2011 2012 |
|
|
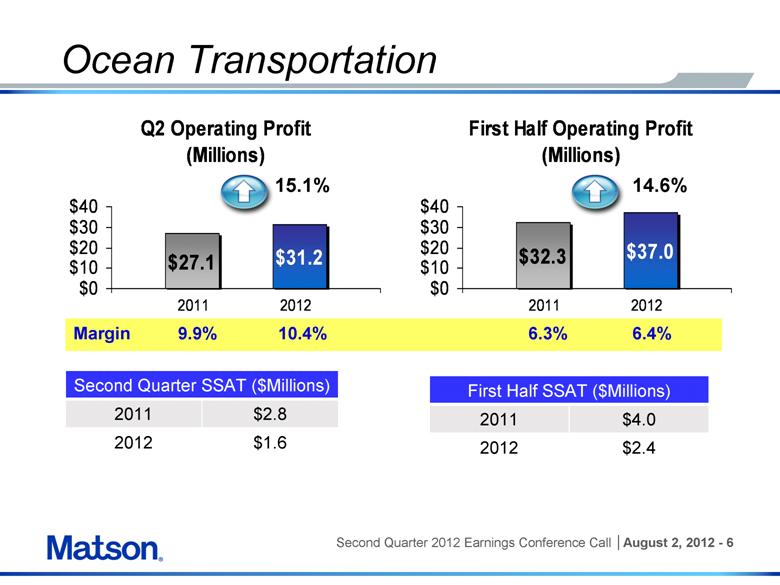
Ocean Transportation Second Quarter SSAT ($Millions) 2011 $2.8 2012 $1.6 First Half SSAT ($Millions) 2011 $4.0 2012 $2.4 6.4% 6.3% 10.4% 9.9% Margin 14.6% 15.1% Q2 Operating Profit (Millions) $27.1 $31.2 $0 $10 $20 $30 $40 2011 2012 First Half Operating Profit (Millions) $32.3 $37.0 $0 $10 $20 $30 $40 2011 2012 |
|
|
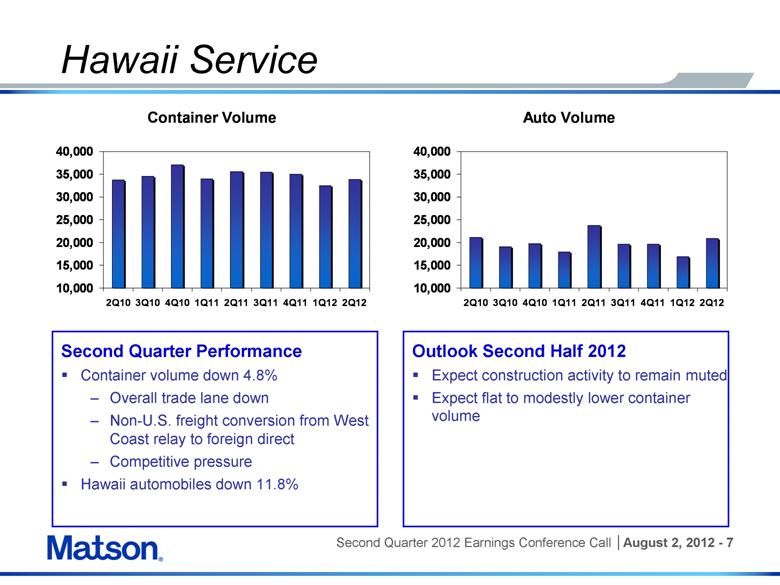
Hawaii Service Second Quarter Performance Container volume down 4.8% Overall trade lane down Non-U.S. freight conversion from West Coast relay to foreign direct Competitive pressure Hawaii automobiles down 11.8% Outlook Second Half 2012 Expect construction activity to remain muted Expect flat to modestly lower container volume Container Volume 10,000 15,000 20,000 25,000 30,000 35,000 40,000 2Q10 3Q10 4Q10 1Q11 2Q11 3Q11 4Q11 1Q12 2Q12 Auto Volume 10,000 15,000 20,000 25,000 30,000 35,000 40,000 2Q10 3Q10 4Q10 1Q11 2Q11 3Q11 4Q11 1Q12 2Q12 |
|
|
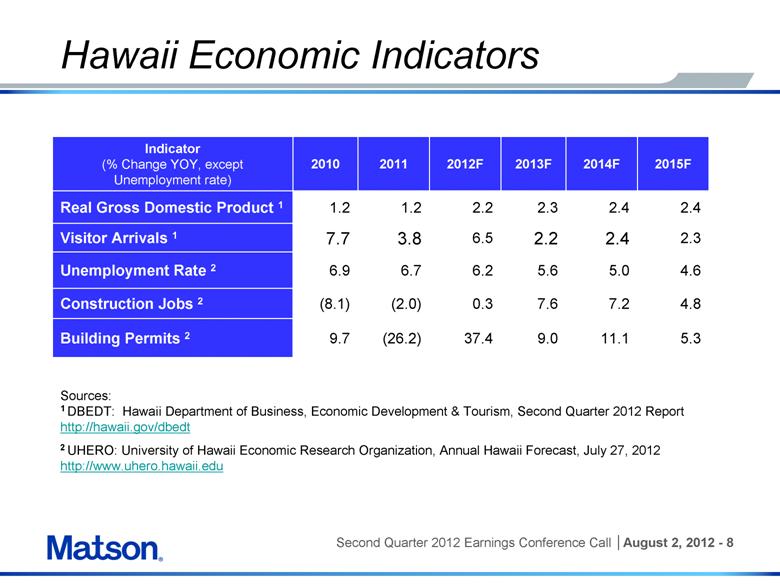
4.8 7.2 7.6 0.3 (2.0) (8.1) Construction Jobs 2 11.1 5.0 2.4 2.4 2014F 5.3 4.6 2.3 2.4 2015F 2.2 6.5 3.8 7.7 Visitor Arrivals 1 Indicator (% Change YOY, except Unemployment rate) 2010 2011 2012F 2013F Real Gross Domestic Product 1 1.2 1.2 2.2 2.3 Unemployment Rate 2 6.9 6.7 6.2 5.6 Building Permits 2 9.7 (26.2) 37.4 9.0 Sources: 1 DBEDT: Hawaii Department of Business, Economic Development & Tourism, Second Quarter 2012 Report http://hawaii.gov/dbedt 2 UHERO: University of Hawaii Economic Research Organization, Annual Hawaii Forecast, July 27, 2012 http://www.uhero.hawaii.edu Hawaii Economic Indicators Second Quarter 2012 Earnings Conference Call | August 2, 2012- 8 |
|
|
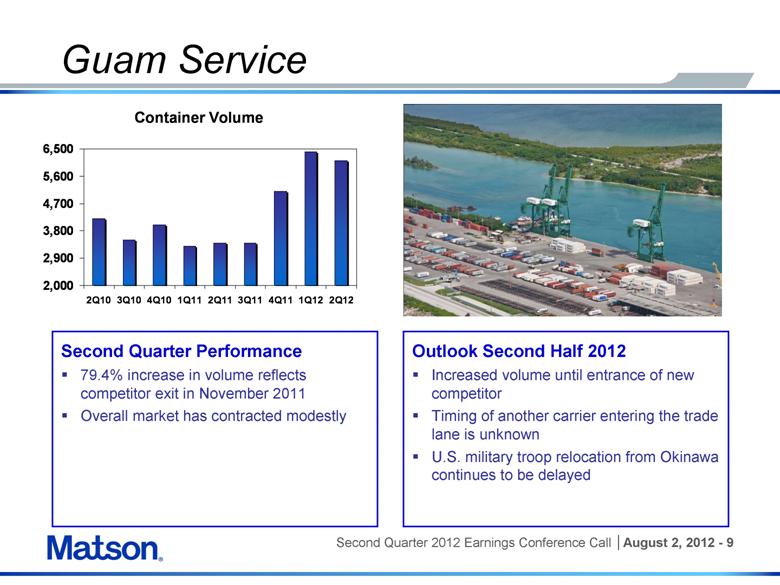
Guam Service Outlook Second Half 2012 Increased volume until entrance of new competitor Timing of another carrier entering the trade lane is unknown U.S. military troop relocation from Okinawa continues to be delayed Second Quarter Performance 79.4% increase in volume reflects competitor exit in November 2011 Overall market has contracted modestly Container Volume 2,000 2,900 3,800 4,700 5,600 6,500 2Q10 3Q10 4Q10 1Q11 2Q11 3Q11 4Q11 1Q12 2Q12 Second Quarter 2012 Earnings Conference Call | August 2, 2012- 9 |
|
|
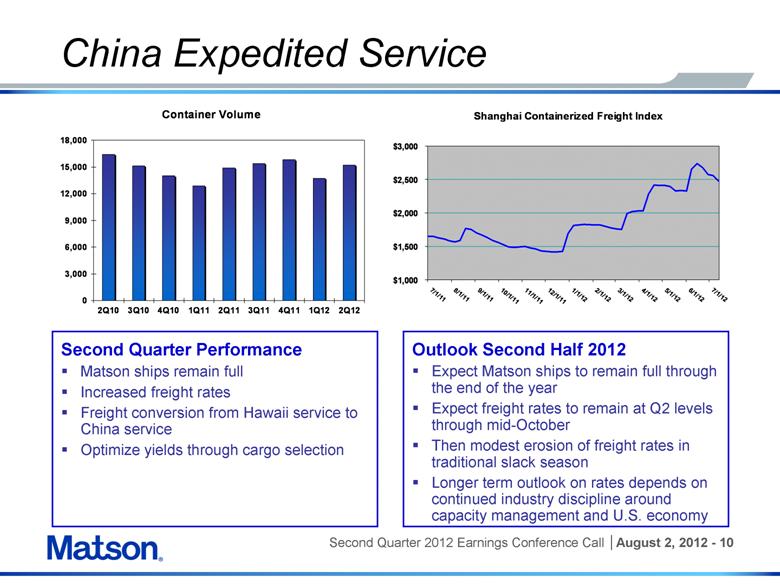
China Expedited Service Second Quarter Performance Matson ships remain full Increased freight rates Freight conversion from Hawaii service to China service Optimize yields through cargo selection Outlook Second Half 2012 Expect Matson ships to remain full through the end of the year Expect freight rates to remain at Q2 levels through mid-October Then modest erosion of freight rates in traditional slack season Longer term outlook on rates depends on continued industry discipline around capacity management and U.S. economy Shanghai Containerized Freight Index $1,000 $1,500 $2,000 $2,500 $3,000 7/1/11 8/1/11 9/1/11 10/1/11 11/1/11 12/1/11 1/1/12 2/1/12 3/1/12 4/1/12 5/1/12 6/1/12 7/1/12 Second Quarter 2012 Earnings Conference Call | August 2, 2012- 10 |
|
|
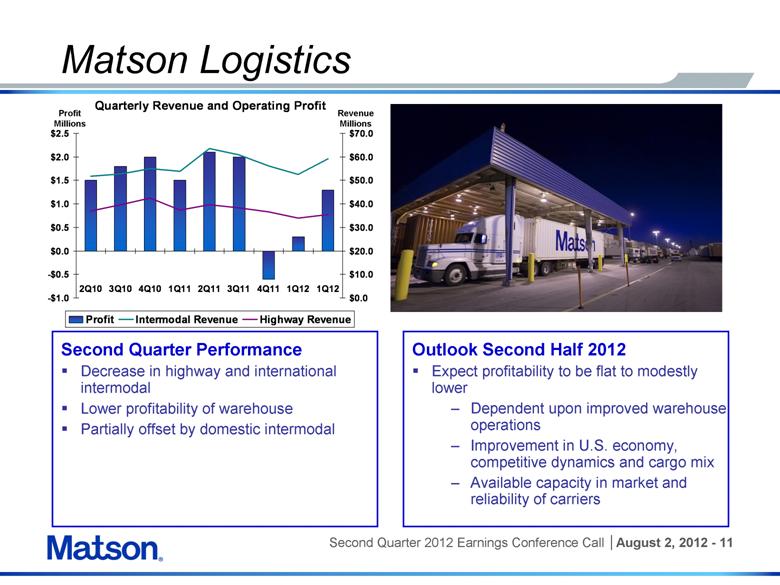
Matson Logistics Profit Millions Revenue Millions Second Quarter Performance Decrease in highway and international intermodal Lower profitability of warehouse Partially offset by domestic intermodal Outlook Second Half 2012 Expect profitability to be flat to modestly lower Dependent upon improved warehouse operations Improvement in U.S. economy, competitive dynamics and cargo mix Available capacity in market and reliability of carriers Quarterly Revenue and Operating Profit -$1.0 -$0.5 $0.0 $0.5 $1.0 $1.5 $2.0 $2.5 2Q10 3Q10 4Q10 1Q11 2Q11 3Q11 4Q11 1Q12 1Q12 $0.0 $10.0 $20.0 $30.0 $40.0 $50.0 $60.0 $70.0 Profit Intermodal Revenue Highway Revenue |
|
|
Separation Update Announced December 1, 2011 Completed June 29, 2012 Alexander & Baldwin reported as discontinued operations Separation costs in line with previous estimates $5.8 million pre-tax in Q2 $8.3 million pre-tax YTD |
|
|
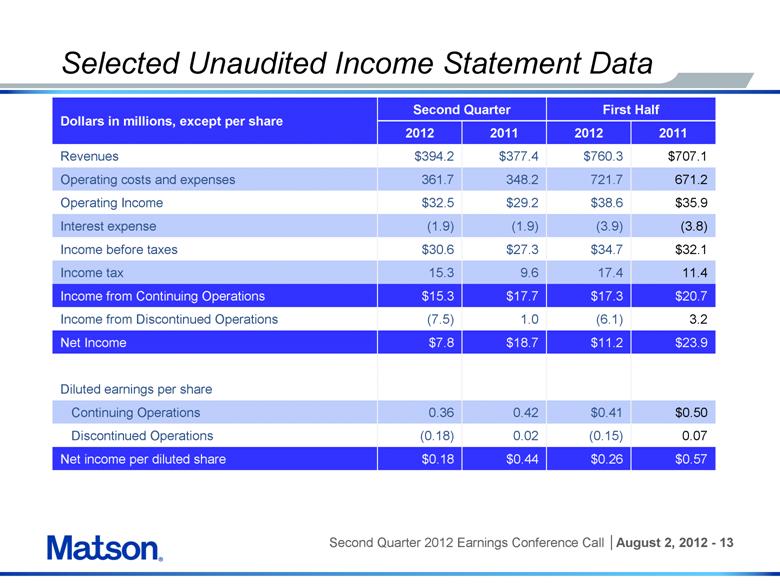
Selected Unaudited Income Statement Data 0.07 (0.15) 0.02 (0.18) Discontinued Operations $0.57 $0.26 $0.44 $0.18 Net income per diluted share 3.2 (6.1) 1.0 (7.5) Income from Discontinued Operations $23.9 $11.2 $18.7 $7.8 Net Income $32.1 $34.7 $27.3 $30.6 Income before taxes $35.9 $38.6 $29.2 $32.5 Operating Income First Half Second Quarter 0.36 $15.3 15.3 (1.9) 361.7 $394.2 2012 Dollars in millions, except per share 2011 2012 2011 Revenues $377.4 $760.3 $707.1 Operating costs and expenses 348.2 721.7 671.2 Interest expense (1.9) (3.9) (3.8) Income tax 9.6 17.4 11.4 Income from Continuing Operations $17.7 $17.3 $20.7 Diluted earnings per share Continuing Operations 0.42 $0.41 $0.50 |
|
|
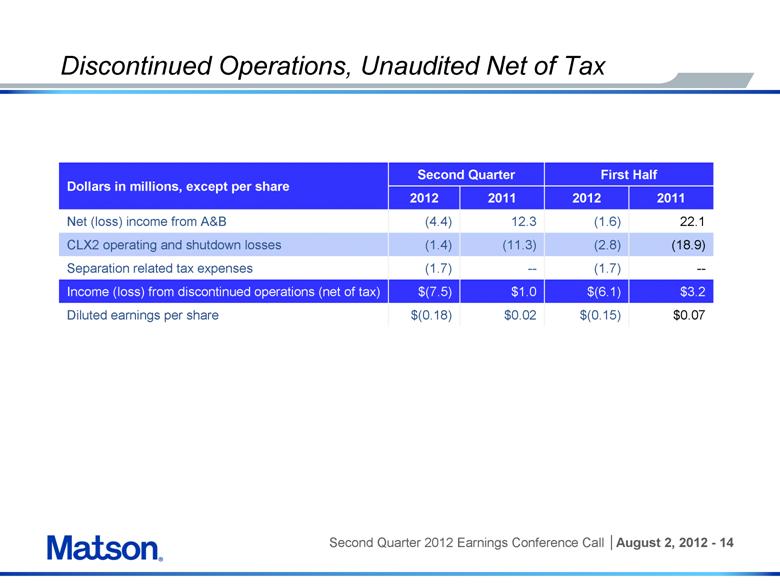
Discontinued Operations, Unaudited Net of Tax Dollars in millions, except per share Second Quarter First Half 2012 2011 2012 2011 Net (loss) income from A&B (4.4) 12.3 (1.6) 22.1 CLX2 operating and shutdown losses (1.4) (11.3) (2.8) (18.9) Separation related tax expenses (1.7) -- (1.7) -- Income (loss) from discontinued operations (net of tax) $(7.5) $1.0 $(6.1) $3.2 Diluted earnings per share $(0.18) $0.02 $(0.15) $0.07 |
|
|
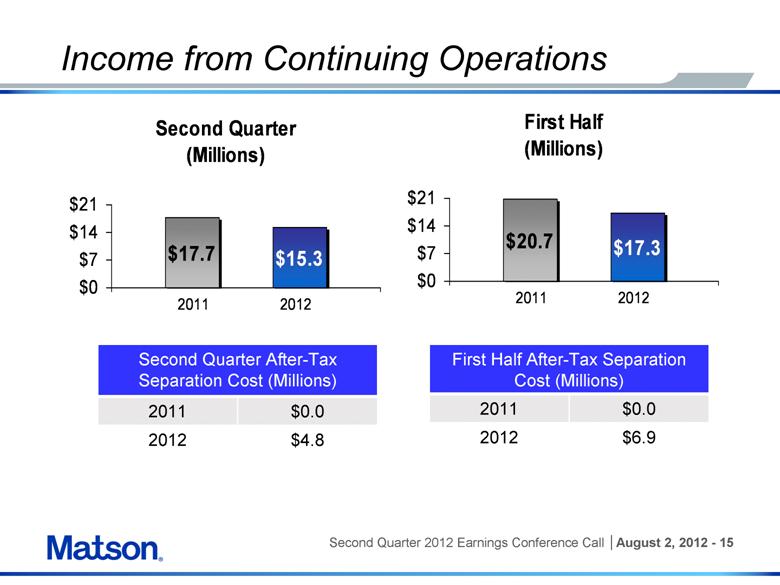
Income from Continuing Operations First Half After-Tax Separation Cost (Millions) 2011 $0.0 2012 $6.9 First Half After-Tax Separation Cost (Millions) 2011 $0.0 2012 $4.8 First Half (Millions) $20.7 $17.3 $0 $7 $14 $21 2011 2012 |
|
|
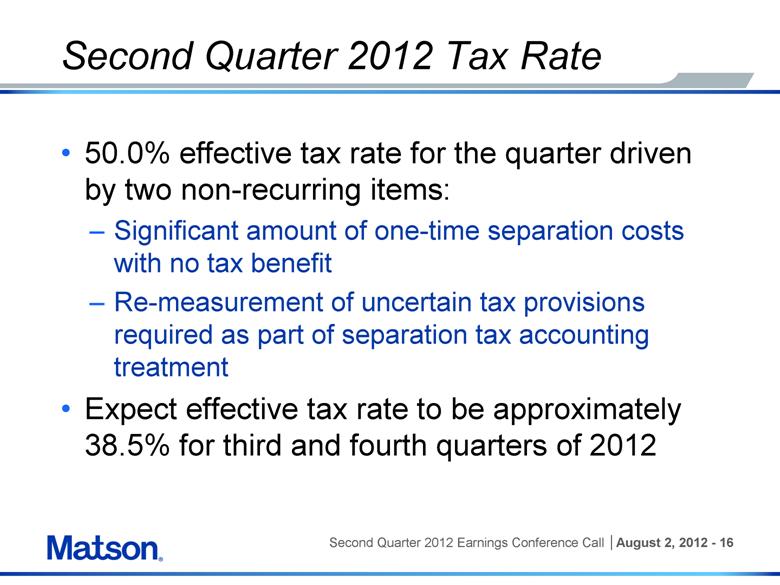
Second Quarter 2012 Tax Rate 50.0% effective tax rate for the quarter driven by two non-recurring items: Significant amount of one-time separation costs with no tax benefit Re-measurement of uncertain tax provisions required as part of separation tax accounting treatment Expect effective tax rate to be approximately 38.5% for third and fourth quarters of 2012 |
|
|
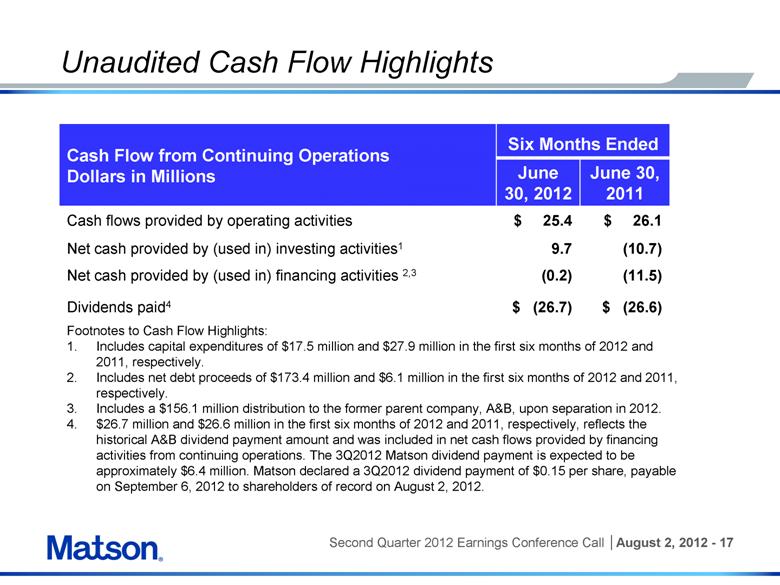
Unaudited Cash Flow Highlights Six Months Ended (10.7) (9.7) Net cash provided by (used in) investing activities1 Cash Flow from Continuing Operations Dollars in Millions June 30, 2012 June 30, 2011 Cash flows provided by operating activities $ 25.4 $ 26.1 Net cash provided by financing activities 2,3 1.7 11.5 Dividends paid4 $ (26.7) $ (26.6) Footnotes to Cash Flow Highlights: 1. Includes capital expenditures of $17.5 million and $27.9 million in the first six months of 2012 and 2011, respectively. 2. Includes net debt proceeds of $173.4 million and $6.1 million in the first six months of 2012 and 2011, respectively. 3. Includes a $156.1 million distribution to the former parent company, A&B, upon separation in 2012. 4. $26.7 million and $26.6 million in the first six months of 2012 and 2011, respectively, reflects the historical A&B dividend payment amount and was included in net cash flows provided by financing activities from continuing operations. The 3Q2012 Matson dividend payment is expected to be approximately $6.4 million. Matson declared a 3Q2012 dividend payment of $0.15 per share, payable on September 6, 2012 to shareholders of record on August 2, 2012. |
|
|
|
|
|
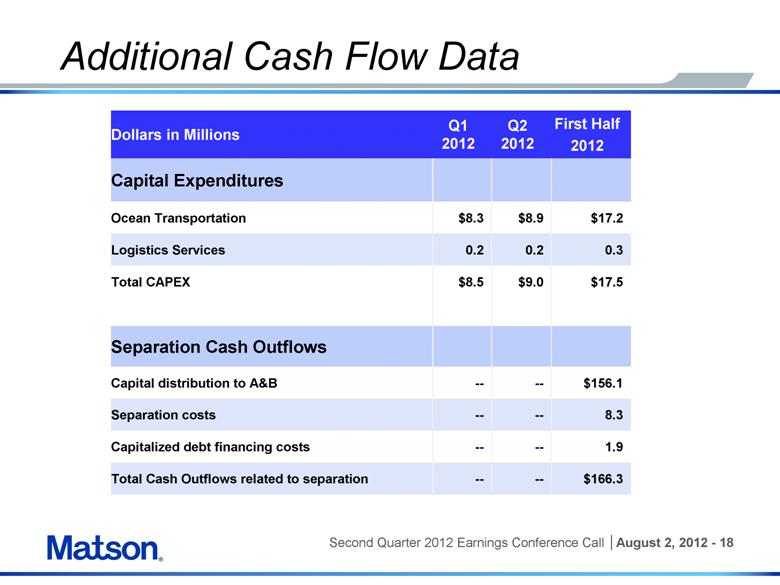
Additional Cash Flow Data Dollars in Millions Q1 2012 Q2 2012 First Half 2012 Capital Expenditures Ocean Transportation $8.3 $8.9 $17.2 Logistics Services 0.2 0.2 0.3 Total CAPEX $8.5 $9.0 $17.5 Separation Cash Outflows Capital distribution to A&B -- -- $156.1 Separation costs -- -- 8.3 Capitalized debt financing costs -- -- 1.9 Total Cash Outflows related to separation -- -- $166.3 |
|
|
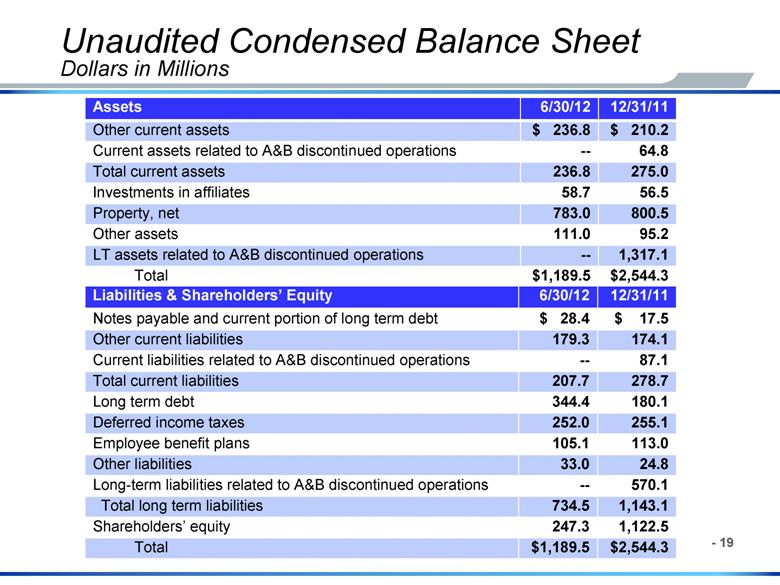
Unaudited Condensed Balance Sheet Dollars in Millions Assets 6/30/12 12/31/11 Other current assets $ 236.8 $ 210.2 Current assets related to A&B discontinued operations -- 64.8 Total current assets 236.8 275.0 Investments in affiliates 58.7 56.5 Property, net 783.0 800.5 Other assets 111.0 95.2 LT assets related to A&B discontinued operations -- 1,317.1 Total $1,189.5 $2,544.3 Liabilities & Shareholders’ Equity 6/30/12 12/31/11 Notes payable and current portion of long term debt $ 28.4 $ 17.5 Other current liabilities 179.3 174.1 Current liabilities related to A&B discontinued operations -- 87.1 Total current liabilities 207.7 278.7 Long term debt 344.4 180.1 Deferred income taxes 252.0 255.1 Employee benefit plans 105.1 113.0 Other liabilities 33.0 24.8 Long-term liabilities related to A&B discontinued operations -- 570.1 Total long term liabilities 734.5 1,143.1 Shareholders’ equity 247.3 1,122.5 Total $1,189.5 $2,544.3 |
|
|
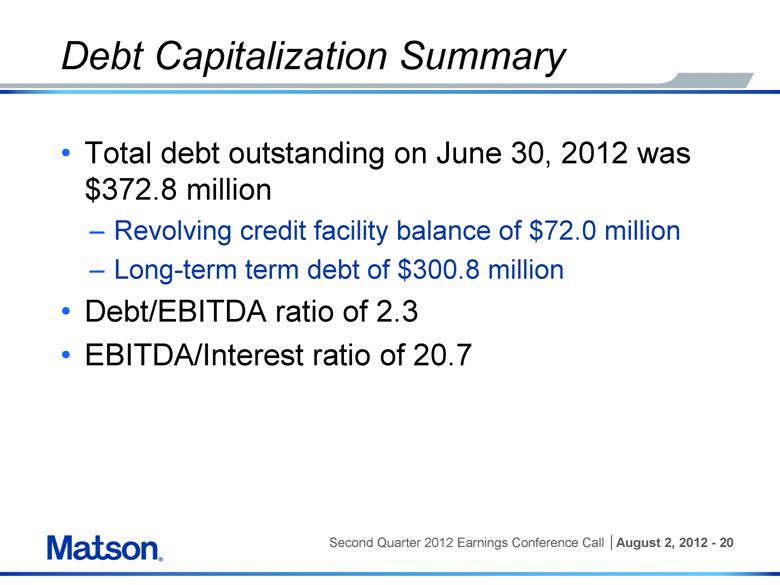
Debt Capitalization Summary Total debt outstanding on June 30, 2012 was $372.8 million Revolving credit facility balance of $72.0 million Long-term term debt of $300.8 million Debt/EBITDA ratio of 2.3 EBITDA/Interest ratio of 20.7 |
|
|
Remainder of 2012 Outlook Ocean transportation operating profit for second half of the year expected to be modestly better than last year Operating profit for Q3 will be negatively impacted by timing of dry dockings compared with last year Expect additional administrative expenses of approximately $8 to $10 million annually related directly to costs associated with operating as a publicly traded company Operating profit outlook includes the additional administrative expenses, but excludes $7.1 million of CLX2 expenses that were not classified as discontinued operations in the second half of 2011 Matson Logistics operating profit for the second half of the year is expected to be flat to modestly lower compared with last year Minimal, if any, separation costs or losses from discontinued operations expected for the rest of the year Expect effective tax rate to be approximately 38.5% for third and fourth quarters |
|
|
Summary Remarks Financial results for the quarter mixed Ocean transportation improving, but below our long-term goal to return to 10 to 12 percent operating margin Logistics operating profit below long-term expectations of 2 to 4 percent operating margin Achieved successful separation Continue to be well positioned in each market and trade lane we serve Strong balance sheet and cash flow generation |

