Attached files
| file | filename |
|---|---|
| 8-K - CURRENT REPORT - Ally Financial Inc. | v319992_8k.htm |
| EX-99.1 - EXHIBIT 99.1 - Ally Financial Inc. | v319992_ex99-1.htm |
| EX-99.2 - EXHIBIT 99.2 - Ally Financial Inc. | v319992_ex99-2.htm |

SECOND QUARTER 2012
FINANCIAL SUPPLEMENT
|
ALLY FINANCIAL INC. FORWARD-LOOKING STATEMENTS AND ADDITIONAL INFORMATION |
|
The following should be read in conjunction with the financial statements, notes and other information contained in the Company’s 2011 Annual Report on Form 10-K, Quarterly Reports on Form 10-Q, and Current Reports on Form 8-K.
This information is preliminary and based on company data available at the time of the presentation
In the presentation that follows and related comments by Ally Financial Inc. (“Ally”) management, the use of the words “expect,” “anticipate,” “estimate,” “forecast,” “initiative,” “objective,” “plan,” “goal,” “project,” “outlook,” “priorities,” “target,” “intend,” “evaluate,” “pursue,” “seek,” “may,” “would ” “could ” “should ” “believe ” “potential ” “continue ” would, could, should, believe, potential, continue, or similar expressions is intended to identify forward-looking statements. All statements herein and in related management comments, other than statements of historical fact, including without limitation, statements about future events and financial performance, are forward-looking statements that involve certain risks and uncertainties. While these statements represent our current judgment on what the future may hold, and we believe these judgments are reasonable, these statements are not guarantees of any events or financial results, and Ally’s actual results may differ materially due to numerous important factors that are described in the most recent reports on SEC Forms 10-K and 10-Q for Ally, each of which may be revised or supplemented in subsequent reports filed with the SEC. Such factors include, among others, the following: maintaining the mutually beneficial relationship between Ally and General Motors (“GM”), and Ally and Chrysler Group LLC (“Chrysler”); the profitability and financial condition of GM and Chrysler; bankruptcy court approval of the plan and settlement related to the bankruptcy filings by Residential Capital, LLC and certain of its subsidiaries; our ability to realize the anticipated benefits associated with being a bank holding company, and the increased regulation and restrictions that we are now subject to; the potential for deterioration in the residual value of off-lease vehicles; disruptions in the market in which we fund our operations, with resulting negative impact on our liquidity; changes in our accounting assumptions that may require or that result from changes in the accounting rules or their application, which could result in an impact on earnings; changes in the credit ratings of Ally, Chrysler, or GM; changes in economic conditions, currency exchange rates or political stability in the markets in which we operate; and changes in the existing or the adoption of new laws, regulations, policies or other activities of governments, agencies and similar organizations (including as a result of the Dodd-Frank Act and Basel III).
Investors are cautioned not to place undue reliance on forward-looking statements. Ally undertakes no obligation to update publicly or otherwise revise any forward-looking statements except where expressly required by law. Reconciliation of non-GAAP financial measures included within this presentation are provided in this presentation.
Use of the term “loans” describes products associated with direct and indirect lending activities of Ally’s global operations. The specific products include retail installment sales contracts, loans, lines of credit, leases or other financing products. The term “originate” refers to Ally’s purchase, acquisition or direct origination of various “loan” products.
| 2Q 2012 Preliminary Results | 2 |
|
ALLY FINANCIAL INC. TABLE OF CONTENTS |
| Page(s) | |
| Consolidated Results | |
| Consolidated Financial Highlights | 4 |
| Consolidated Income Statement | 5 |
| Consolidated Period-End Balance Sheet | 6 |
| Consolidated Average Balance Sheet | 7 |
| Segment Detail | |
| Segment Highlights | 8 |
| North American Automotive Finance | 9-10 |
| International Automotive Finance | 11-12 |
| Insurance | 13 |
| Mortgage Operations | 14 |
| Corporate and Other | 15 |
| Credit Related Information | 16-18 |
| Supplemental Detail | |
| Capital | 19 |
| Liquidity | 20 |
| Deposits | 21 |
| Ally Bank Consumer Mortgage HFI Portfolio | 22 |
| Mortgage Repurchase Outstanding Claims | 23 |
| Ownership | 24 |
| 2Q 2012 Preliminary Results | 3 |
|
ALLY FINANCIAL INC. CONSOLIDATED FINANCIAL HIGHLIGHTS |
| ($ in millions) | ||||||||||||||||||||
| QUARTERLY TRENDS | CHANGE VS. | |||||||||||||||||||
| Selected Income Statement Data | 2Q 12 | 1Q 12 | 4Q 11 | 3Q 11 | 2Q 11 | 1Q 12 | 2Q 11 | |||||||||||||
| Net financing revenue (ex. OID) | $ | 878 | $ | 777 | $ | 743 | $ | 832 | $ | 972 | $ | 101 | $ | (94) | ||||||
| Total other revenue (ex. OID) | 928 | 1,187 | 977 | 554 | 1,077 | (259) | (149) | |||||||||||||
| Total net revenue (ex. OID) | 1,806 | 1,964 | 1,720 | 1,386 | 2,049 | (158) | (243) | |||||||||||||
| Provision for loan losses | 29 | 140 | 6 | 50 | 50 | (111) | (21) | |||||||||||||
| Controllable expenses (1) | 792 | 906 | 965 | 731 | 825 | (114) | (33) | |||||||||||||
| Other noninterest expenses | 1,738 | 444 | 729 | 486 | 709 | 1,294 | 1,029 | |||||||||||||
| Core pre-tax (loss) income (2) | $ | (753) | $ | 474 | $ | 20 | $ | 119 | $ | 465 | $ | (1,226) | $ | (1,217) | ||||||
| Core OID amortization expense (3) (4) | 96 | 108 | 137 | 225 | 274 | (11) | (177) | |||||||||||||
| Income tax expense | 15 | 64 | 73 | 93 | 83 | (49) | (68) | |||||||||||||
| (Loss) income from discontinued operations | (34) | 8 | (16) | (11) | 5 | (42) | (39) | |||||||||||||
| Net (loss) income | $ | (898) | $ | 310 | $ | (206) | $ | (210) | $ | 113 | $ | (1,208) | $ | (1,011) | ||||||
| Selected Balance Sheet Data (Period-End) | ||||||||||||||||||||
| Total assets | $ | 178,560 | $ | 186,350 | $ | 184,059 | $ | 181,956 | $ | 178,889 | $ | (7,790) | $ | (329) | ||||||
| Consumer loans (5) | 77,959 | 78,004 | 74,287 | 70,815 | 70,093 | (45) | 7,866 | |||||||||||||
| Commercial loans (6) | 41,954 | 41,814 | 40,468 | 37,897 | 40,632 | 140 | 1,322 | |||||||||||||
| Allowance balance | (1,427) | (1,546) | (1,503) | (1,621) | (1,739) | 119 | 312 | |||||||||||||
| Deposits | 47,992 | 47,206 | 45,050 | 44,326 | 42,262 | 786 | 5,730 | |||||||||||||
| Common equity (7) | 11,423 | 12,727 | 12,431 | 12,792 | 13,483 | (1,304) | (2,060) | |||||||||||||
| Total equity | 18,363 | 19,667 | 19,371 | 19,732 | 20,423 | (1,304) | (2,060) | |||||||||||||
| Select Financial Ratios | ||||||||||||||||||||
| Net interest margin (8) | 2.2% | 1.9% | 1.8% | 2.1% | 2.5% | |||||||||||||||
| Return on average total equity (annualized) | -18.9% | 6.4% | -4.2% | -4.2% | 2.2% | |||||||||||||||
| Return on average assets (annualized) | -1.9% | 0.7% | -0.4% | -0.5% | 0.3% | |||||||||||||||
| Capital Ratios | ||||||||||||||||||||
| Tier 1 capital ratio | 13.7% | 13.5% | 13.7% | 14.3% | 14.6% | |||||||||||||||
| Tier 1 common capital ratio (9) | 7.3% | 7.5% | 7.6% | 8.0% | 8.4% | |||||||||||||||
| Total risk-based capital ratio | 14.7% | 14.5% | 14.7% | 15.5% | 15.9% | |||||||||||||||
| (1) | Includes employee related costs, consulting and legal fees, marketing, information technology, facility, portfolio servicing and restructuring expenses |
| (2) | Core pre-tax income (loss) is a non-GAAP financial measure. It is defined as income from continuing operations before taxes and primarily bond exchange original issue discount ("OID") amortization expense |
| (3) | Includes $20 million of accelerated OID amortization in 2Q11 |
| (4) | Core OID excludes IO and 2010 issuances |
| (5) | These amounts exclude loans held-for-sale |
| (6) | Includes notes receivable from General Motors |
| (7) | Includes common stock and paid-in capital, accumulated deficit and accumulated other comprehensive income |
| (8) | Excludes OID amortization expense. The impact of historical financial statement restatements for discontinued operations are not reflected in prior periods |
| (9) | Tier 1 common capital ratio is a non-GAAP measurement. Refer to page 19 for additional details |
| 2Q 2012 Preliminary Results | 4 |
|
ALLY FINANCIAL INC. CONSOLIDATED INCOME STATEMENT |
| ($ in millions) | ||||||||||||||||||||
| QUARTERLY TRENDS | CHANGE VS. | |||||||||||||||||||
| 2Q 12 | 1Q 12 | 4Q 11 | 3Q 11 | 2Q 11 | 1Q 12 | 2Q 11 | ||||||||||||||
| Financing revenue and other interest income | ||||||||||||||||||||
| Interest and fees on finance receivables and loans (1) | $ | 1,691 | $ | 1,678 | $ | 1,659 | $ | 1,680 | $ | 1,675 | $ | 13 | $ | 16 | ||||||
| Interest on loans held-for-sale | 36 | 73 | 76 | 86 | 86 | (37) | (50) | |||||||||||||
| Interest on trading securities | 2 | 11 | 9 | 4 | 3 | (9) | (1) | |||||||||||||
| Interest and dividends on available-for-sale investment securities | 86 | 84 | 87 | 102 | 106 | 2 | (20) | |||||||||||||
| Interest-bearing cash | 18 | 14 | 13 | 14 | 15 | 4 | 3 | |||||||||||||
| Operating leases | 579 | 540 | 515 | 530 | 598 | 39 | (19) | |||||||||||||
| Total financing revenue and other interest income | 2,412 | 2,400 | 2,359 | 2,416 | 2,483 | 12 | (71) | |||||||||||||
| Interest expense | ||||||||||||||||||||
| Interest on deposits | 184 | 186 | 184 | 179 | 171 | (2) | 13 | |||||||||||||
| Interest on short-term borrowings | 60 | 75 | 74 | 61 | 87 | (15) | (27) | |||||||||||||
| Interest on long-term debt | 1,068 | 1,177 | 1,179 | 1,293 | 1,331 | (109) | (263) | |||||||||||||
| Total interest expense | 1,312 | 1,438 | 1,437 | 1,533 | 1,589 | (126) | (277) | |||||||||||||
| Depreciation expense on operating lease assets | 318 | 293 | 316 | 276 | 176 | 25 | 142 | |||||||||||||
| Net financing revenue | 782 | 669 | 606 | 607 | 718 | 113 | 64 | |||||||||||||
| Other revenue | ||||||||||||||||||||
| Servicing fees | 216 | 310 | 325 | 335 | 341 | (94) | (125) | |||||||||||||
| Servicing asset valuation and hedge activities, net | (73) | 9 | (126) | (471) | (105) | (82) | 32 | |||||||||||||
| Total servicing income, net | 143 | 319 | 199 | (136) | 236 | (176) | (93) | |||||||||||||
| Insurance premiums and service revenue earned | 359 | 375 | 385 | 390 | 399 | (16) | (40) | |||||||||||||
| Gain on mortgage and automotive loans, net | 134 | 126 | 169 | 95 | 116 | 8 | 18 | |||||||||||||
| Loss on extinguishment of debt | - | - | - | - | (25) | - | 25 | |||||||||||||
| Other gain on investments, net | 66 | 90 | 43 | 75 | 92 | (24) | (26) | |||||||||||||
| Other income, net of losses | 226 | 277 | 181 | 130 | 239 | (51) | (13) | |||||||||||||
| Total other revenue | 928 | 1,187 | 977 | 554 | 1,057 | (259) | (129) | |||||||||||||
| Total net revenue | 1,710 | 1,856 | 1,583 | 1,161 | 1,775 | (146) | (65) | |||||||||||||
| Provision for loan losses | 29 | 140 | 6 | 50 | 50 | (111) | (21) | |||||||||||||
| Noninterest expense | ||||||||||||||||||||
| Compensation and benefits expense | 389 | 475 | 442 | 293 | 415 | (86) | (26) | |||||||||||||
| Insurance losses and loss adjustment expenses | 208 | 159 | 146 | 170 | 227 | 49 | (19) | |||||||||||||
| Other operating expenses | 1,933 | 716 | 1,106 | 754 | 892 | 1,217 | 1,041 | |||||||||||||
| Total noninterest expense | 2,530 | 1,350 | 1,694 | 1,217 | 1,534 | 1,180 | 996 | |||||||||||||
| (Loss) income from continuing operations before income tax expense (benefit) | (849) | 366 | (117) | (106) | 191 | (1,215) | (1,040) | |||||||||||||
| Income tax expense from continuing operations | 15 | 64 | 73 | 93 | 83 | (49) | (68) | |||||||||||||
| Net (loss) income from continuing operations | (864) | 302 | (190) | (199) | 108 | (1,166) | (972) | |||||||||||||
| (Loss) income from discontinued operations, net of tax | (34) | 8 | (16) | (11) | 5 | (42) | (39) | |||||||||||||
| Net (loss) income | $ | (898) | $ | 310 | $ | (206) | $ | (210) | $ | 113 | $ | (1,208) | $ | (1,011) | ||||||
| (1) | Includes other interest income, net |
| 2Q 2012 Preliminary Results | 5 |
|
ALLY FINANCIAL INC. CONSOLIDATED PERIOD-END BALANCE SHEET |
| ($ in millions) | ||||||||||||||||||||
| QUARTERLY TRENDS | CHANGE VS. | |||||||||||||||||||
| Assets | 6/30/2012 | 3/31/2012 | 12/31/2011 | 9/30/2011 | 6/30/2011 | 3/31/2012 | 6/30/2011 | |||||||||||||
| Cash and cash equivalents | ||||||||||||||||||||
| Noninterest-bearing | $ | 2,106 | $ | 2,279 | $ | 2,475 | $ | 1,517 | $ | 2,039 | $ | (173) | $ | 67 | ||||||
| Interest-bearing | 14,020 | 10,800 | 10,560 | 14,885 | 12,862 | 3,220 | 1,158 | |||||||||||||
| Total cash and cash equivalents | 16,126 | 13,079 | 13,035 | 16,402 | 14,901 | 3,047 | 1,225 | |||||||||||||
| Trading assets | - | 895 | 622 | 503 | 311 | (895) | (311) | |||||||||||||
| Investment securities | 13,366 | 14,942 | 15,135 | 13,981 | 15,961 | (1,576) | (2,595) | |||||||||||||
| Loans held-for-sale, net | 2,000 | 6,670 | 8,557 | 8,745 | 7,168 | (4,670) | (5,168) | |||||||||||||
| Finance receivables and loans, net | ||||||||||||||||||||
| Finance receivables and loans, net | 119,913 | 119,818 | 114,755 | 108,712 | 110,725 | 95 | 9,188 | |||||||||||||
| Allowance for loan losses | (1,427) | (1,546) | (1,503) | (1,621) | (1,739) | 119 | 312 | |||||||||||||
| Total finance receivables and loans, net | 118,486 | 118,272 | 113,252 | 107,091 | 108,986 | 214 | 9,500 | |||||||||||||
| Investment in operating leases, net | 11,197 | 10,048 | 9,275 | 9,052 | 9,015 | 1,149 | 2,182 | |||||||||||||
| Mortgage servicing rights | 1,105 | 2,595 | 2,519 | 2,663 | 3,701 | (1,490) | (2,596) | |||||||||||||
| Premiums receivables and other insurance assets | 1,887 | 1,876 | 1,853 | 2,026 | 2,124 | 11 | (237) | |||||||||||||
| Other assets | 14,010 | 16,965 | 18,741 | 21,540 | 16,770 | (2,955) | (2,760) | |||||||||||||
| Assets of operations held-for-sale | 383 | 1,008 | 1,070 | (47) | (48) | (625) | 431 | |||||||||||||
| Total assets | $ | 178,560 | $ | 186,350 | $ | 184,059 | $ | 181,956 | $ | 178,889 | $ | (7,790) | $ | (329) | ||||||
| Liabilities | ||||||||||||||||||||
| Deposit liabilities | ||||||||||||||||||||
| Noninterest-bearing | $ | 2,411 | $ | 2,314 | $ | 2,029 | $ | 2,704 | $ | 2,405 | $ | 97 | $ | 6 | ||||||
| Interest-bearing | 45,581 | 44,892 | 43,021 | 41,622 | 39,857 | 689 | 5,724 | |||||||||||||
| Total deposit liabilities | 47,992 | 47,206 | 45,050 | 44,326 | 42,262 | 786 | 5,730 | |||||||||||||
| Short-term borrowings | 6,010 | 7,203 | 7,680 | 5,933 | 7,130 | (1,193) | (1,120) | |||||||||||||
| Long-term debt | 91,096 | 93,990 | 92,794 | 90,546 | 91,723 | (2,894) | (627) | |||||||||||||
| Interest payable | 1,552 | 1,675 | 1,587 | 1,712 | 1,734 | (123) | (182) | |||||||||||||
| Unearned insurance premiums and service revenue | 2,631 | 2,632 | 2,576 | 2,757 | 2,845 | (1) | (214) | |||||||||||||
| Reserves for insurance losses and loss adjustment expenses | 477 | 565 | 580 | 690 | 782 | (88) | (305) | |||||||||||||
| Accrued expense and other liabilities | 10,198 | 13,089 | 14,084 | 16,260 | 11,990 | (2,891) | (1,792) | |||||||||||||
| Liabilities of operations held-for-sale | 241 | 323 | 337 | - | - | (82) | 241 | |||||||||||||
| Total liabilities | $ | 160,197 | $ | 166,683 | $ | 164,688 | $ | 162,224 | $ | 158,466 | $ | (6,486) | $ | 1,731 | ||||||
| Equity | ||||||||||||||||||||
| Common stock and paid-in capital | $ | 19,668 | $19,668 | $ | 19,668 | $ | 19,668 | $ | 19,668 | $ | 0 | $ | (0) | |||||||
| Mandatorily convertible preferred stock held by U.S. Department of Treasury | 5,685 | 5,685 | 5,685 | 5,685 | 5,685 | - | - | |||||||||||||
| Preferred stock | 1,255 | 1,255 | 1,255 | 1,255 | 1,255 | - | - | |||||||||||||
| Accumulated deficit | (8,313) | (7,215) | (7,324) | (6,918) | (6,508) | (1,098) | (1,805) | |||||||||||||
| Accumulated other comprehensive income | 68 | 274 | 86 | 42 | 323 | (206) | (255) | |||||||||||||
| Total equity | 18,363 | 19,667 | 19,371 | 19,732 | 20,423 | (1,304) | (2,060) | |||||||||||||
| Total liabilities and equity | $ | 178,560 | $ | 186,350 | $ | 184,059 | $ | 181,956 | $ | 178,889 | $ | (7,790) | $ | (329) | ||||||
| 2Q 2012 Preliminary Results | 6 |
|
ALLY FINANCIAL INC. CONSOLIDATED AVERAGE BALANCE SHEET (1) |
| ($ in millions) | ||||||||||||||||||||
| QUARTERLY TRENDS | CHANGE VS. | |||||||||||||||||||
| Assets | 6/30/2012 | 3/31/2012 | 12/31/2011 | 9/30/2011 | 6/30/2011 | 3/31/2012 | 6/30/2011 | |||||||||||||
| Interest-bearing cash and cash equivalents | $ | 12,589 | $ | 10,641 | $ | 11,187 | $ | 13,373 | $ | 11,910 | $ | 1,948 | $ | 679 | ||||||
| Trading assets | 114 | 990 | 647 | 351 | 146 | (876) | (32) | |||||||||||||
| Investment securities | 13,239 | 13,704 | 15,487 | 13,814 | 14,311 | (465) | (1,072) | |||||||||||||
| Loans held-for-sale, net | 4,310 | 7,754 | 10,588 | 9,654 | 8,320 | (3,444) | (4,010) | |||||||||||||
| Total finance receivables and loans, net (2) | 121,834 | 117,482 | 114,069 | 112,478 | 111,543 | 4,352 | 10,291 | |||||||||||||
| Investment in operating leases, net | 10,619 | 9,649 | 9,129 | 9,040 | 9,004 | 970 | 1,615 | |||||||||||||
| Total interest earning assets | 162,705 | 160,220 | 161,107 | 158,710 | 155,234 | 2,485 | 7,471 | |||||||||||||
| Noninterest-bearing cash and cash equivalents | 2,695 | 2,004 | 1,841 | 1,321 | 1,020 | 691 | 1,675 | |||||||||||||
| Other assets | 20,678 | 23,796 | 23,350 | 27,565 | 23,966 | (3,118) | (3,288) | |||||||||||||
| Allowance for loan losses | (1,496) | (1,528) | (1,609) | (1,737) | (1,816) | 32 | 320 | |||||||||||||
| Total assets | $ | 184,582 | $ | 184,492 | $ | 184,689 | $ | 185,859 | $ | 178,404 | $ | 90 | $ | 6,178 | ||||||
| Liabilities | ||||||||||||||||||||
| Interest-bearing deposit liabilities | $ | 45,329 | $ | 44,796 | $ | 43,823 | $ | 42,131 | $ | 40,386 | $ | 533 | $ | 4,943 | ||||||
| Short-term borrowings | 6,853 | 6,905 | 7,137 | 7,320 | 7,280 | (52) | (427) | |||||||||||||
| Long-term debt (3) | 94,092 | 91,558 | 91,590 | 92,313 | 90,606 | 2,534 | 3,486 | |||||||||||||
| Total interest-bearing liabilities (3) | 146,274 | 143,259 | 142,550 | 141,764 | 138,272 | 3,015 | 8,002 | |||||||||||||
| Noninterest-bearing deposit liabilities | 2,279 | 2,141 | 2,374 | 2,509 | 2,170 | 138 | 109 | |||||||||||||
| Other liabilities | 17,071 | 19,612 | 20,156 | 21,529 | 17,517 | (2,541) | (446) | |||||||||||||
| Total liabilities | $ | 165,624 | $ | 165,012 | $ | 165,080 | $ | 165,802 | $ | 157,959 | $ | 612 | $ | 7,665 | ||||||
| Equity | ||||||||||||||||||||
| Total equity | $ | 18,958 | $ | 19,480 | $ | 19,609 | $ | 20,057 | $ | 20,445 | $ | (522) | $ | (1,487) | ||||||
| Total liabilities and equity | $ | 184,582 | $ | 184,492 | $ | 184,689 | $ | 185,859 | $ | 178,404 | $ | 90 | $ | 6,178 | ||||||
Note: The impact of financial statement restatements for discontinued operations are not reflected in prior periods
| (1) | Average balances are calculated using a combination of monthly and daily average methodologies |
| (2) | Nonperforming finance receivables and loans are included in the average balances net of unearned income, unamortized premiums and discounts, and deferred fees and costs |
| (3) | Average balance includes $1,960 million related to OID at June 30, 2012 |
| 2Q 2012 Preliminary Results | 7 |
|
ALLY FINANCIAL INC. SEGMENT HIGHLIGHTS |
| ($ in millions) | ||||||||||||||||||||
| QUARTERLY TRENDS | CHANGE VS. | |||||||||||||||||||
| 2Q 12 | 1Q 12 | 4Q 11 | 3Q 11 | 2Q 11 | 1Q 12 | 2Q 11 | ||||||||||||||
| North American Automotive Finance | $ | 631 | $ | 442 | $ | 478 | $ | 551 | $ | 559 | $ | 189 | $ | 72 | ||||||
| International Automotive Finance | 72 | 45 | 21 | 89 | 69 | 27 | 3 | |||||||||||||
| Insurance | 43 | 124 | 93 | 111 | 72 | (81) | (29) | |||||||||||||
| Global Automotive Services | 746 | 611 | 592 | 751 | 700 | 135 | 46 | |||||||||||||
| Mortgage Operations (1) | 24 | 191 | (258) | (409) | (125) | (167) | 149 | |||||||||||||
| Corporate and Other (ex. OID) (2) | (1,523) | (328) | (314) | (223) | (110) | (1,195) | (1,413) | |||||||||||||
| Core pre-tax income (3) | (753) | 474 | 20 | 119 | 465 | (1,227) | (1,218) | |||||||||||||
| Core OID amortization expense (4) | 96 | 108 | 137 | 225 | 274 | (12) | (178) | |||||||||||||
| Income tax expense | 15 | 64 | 73 | 93 | 83 | (49) | (68) | |||||||||||||
| (Loss) income from discontinued operations | (34) | 8 | (16) | (11) | 5 | (42) | (39) | |||||||||||||
| Net (loss) income | $ | (898) | $ | 310 | $ | (206) | $ | (210) | $ | 113 | $ | (1,208) | $ | (1,011) | ||||||
| (1) | Mortgage Operations includes ResCap results prior to the May 14, 2012 deconsolidation |
| (2) | Corporate and Other primarily consists of centralized corporate treasury and deposit gathering activities, such as management of the cash and corporate investment securities portfolios, short and long term debt, retail and brokered deposit liabilities, derivative instruments, the amortization of the discount associated with new debt issuances and bond exchanges, most notably from the December 2008 bond exchange, and the residual impacts of our corporate funds transfer pricing (FTP) and treasury asset liability management (ALM) activities. The segment also includes our Commercial Finance Group, certain equity investments and reclassifications and eliminations between the reportable operating segments. 2Q12 Corporate and Other includes the $1,192 million charge recorded for ResCap actions |
| (3) | Core pre-tax income is a non-GAAP financial measure. It is defined as income from continuing operations before taxes and primarily bond exchange OID amortization expense |
| (4) | Includes $20 million of accelerated OID amortization in 2Q11 |
| 2Q 2012 Preliminary Results | 8 |
|
ALLY FINANCIAL INC. NORTH AMERICAN AUTO - CONDENSED FINANCIAL STATEMENTS |
| ($ in millions) | ||||||||||||||||||||
| QUARTERLY TRENDS | CHANGE VS. | |||||||||||||||||||
| Income Statement | 2Q 12 | 1Q 12 | 4Q 11 | 3Q 11 | 2Q 11 | 1Q 12 | 2Q 11 | |||||||||||||
| Net financing revenue | ||||||||||||||||||||
| Consumer | $ | 810 | $ | 763 | $ | 739 | $ | 718 | $ | 706 | $ | 47 | $ | 104 | ||||||
| Commercial (1) | 330 | 322 | 324 | 346 | 329 | 8 | 1 | |||||||||||||
| Loans held-for-sale | 6 | 5 | 5 | - | - | 1 | 6 | |||||||||||||
| Operating leases | 574 | 536 | 511 | 527 | 594 | 38 | (20) | |||||||||||||
| Other interest income | 17 | 18 | 31 | 29 | 23 | (1) | (6) | |||||||||||||
| Total financing revenue and other interest income | 1,737 | 1,644 | 1,610 | 1,620 | 1,652 | 93 | 85 | |||||||||||||
| Interest expense | 585 | 578 | 591 | 590 | 604 | 7 | (19) | |||||||||||||
| Depreciation expense on operating lease assets | 315 | 291 | 315 | 275 | 170 | 24 | 145 | |||||||||||||
| Net financing revenue | 837 | 775 | 704 | 755 | 878 | 62 | (41) | |||||||||||||
| Other revenue | ||||||||||||||||||||
| Servicing fees | 30 | 30 | 35 | 39 | 42 | - | (12) | |||||||||||||
| Gain on automotive loans, net | 39 | - | - | 33 | 15 | 39 | 24 | |||||||||||||
| Other income | 45 | 49 | 49 | 54 | 57 | (4) | (12) | |||||||||||||
| Total other revenue | 114 | 79 | 84 | 126 | 114 | 35 | - | |||||||||||||
| Total net revenue | 951 | 854 | 788 | 881 | 992 | 97 | (41) | |||||||||||||
| Provision for loan losses | 16 | 78 | (33) | 25 | 55 | (62) | (39) | |||||||||||||
| Noninterest expense | ||||||||||||||||||||
| Compensation and benefits | 108 | 119 | 115 | 92 | 111 | (11) | (3) | |||||||||||||
| Other operating expenses | 196 | 215 | 228 | 213 | 267 | (19) | (71) | |||||||||||||
| Total noninterest expense | 304 | 334 | 343 | 305 | 378 | (30) | (74) | |||||||||||||
| Income before income tax expense | $ | 631 | $ | 442 | $ | 478 | $ | 551 | $ | 559 | $ | 189 | $ | 72 | ||||||
| Balance Sheet (Period-End) | ||||||||||||||||||||
| Loans held-for-sale | $ | 623 | $ | 623 | $ | 425 | $ | 464 | $ | - | $ | - | $ | 623 | ||||||
| Finance receivables and loans, net: | ||||||||||||||||||||
| Consumer loans | 58,310 | 57,075 | 54,076 | 50,507 | 48,925 | 1,235 | 9,385 | |||||||||||||
| Commercial loans | 34,056 | 34,446 | 32,474 | 30,364 | 32,973 | (390) | 1,083 | |||||||||||||
| Allowance for loan losses | (713) | (756) | (736) | (838) | (897) | 43 | 184 | |||||||||||||
| Total finance receivables and loans, net | $ | 91,653 | $ | 90,765 | $ | 85,814 | $ | 80,033 | $ | 81,001 | $ | 888 | $ | 10,652 | ||||||
| Investment in operating leases, net | 11,095 | 9,957 | 9,198 | 8,844 | 8,751 | 1,138 | 2,344 | |||||||||||||
| Other assets | 1,556 | 1,549 | 1,534 | 1,191 | 1,191 | 7 | 365 | |||||||||||||
| Total assets | $ | 104,927 | $ | 102,894 | $ | 96,971 | $ | 90,532 | $ | 90,943 | $ | 2,033 | $ | 13,984 | ||||||
| (1) | Includes interest on notes receivable from General Motors |
| 2Q 2012 Preliminary Results | 9 |
|
ALLY FINANCIAL INC. NORTH AMERICAN AUTO - KEY STATISTICS |
| QUARTERLY TRENDS | CHANGE VS. | |||||||||||||||||||
| U.S. Market | 2Q 12 | 1Q 12 | 4Q 11 | 3Q 11 | 2Q 11 | 1Q 12 | 2Q 11 | |||||||||||||
| SAAR (units in millions) | 14.0 | 14.5 | 13.4 | 12.6 | 12.1 | (0.4) | 1.9 | |||||||||||||
| Industry light vehicle sales (units in millions) | 3.8 | 3.5 | 3.2 | 3.2 | 3.3 | 0.3 | 0.5 | |||||||||||||
| GM market share | 18.7% | 17.6% | 18.5% | 20.2% | 20.5% | |||||||||||||||
| Chrysler market share | 11.5% | 11.5% | 11.1% | 11.6% | 10.8% | |||||||||||||||
| NAO Total Consumer Originations by Type ($ in billions) | ||||||||||||||||||||
| New | $ | 7.0 | $ | 6.2 | $ | 6.5 | $ | 7.1 | $ | 6.0 | $ | 0.8 | $ | 1.0 | ||||||
| Lease | 2.1 | 1.6 | 1.3 | 1.7 | 2.1 | 0.4 | (0.0) | |||||||||||||
| Used | 2.6 | 2.7 | 2.3 | 2.4 | 2.2 | (0.1) | 0.4 | |||||||||||||
| Total NAO | $ | 11.7 | $ | 10.5 | $ | 10.1 | $ | 11.1 | $ | 10.3 | $ | 1.1 | $ | 1.4 | ||||||
| NAO Ally Consumer Penetration | ||||||||||||||||||||
| GM | 32.7% | 31.7% | 33.6% | 32.7% | 35.4% | |||||||||||||||
| Chrysler | 26.1% | 25.9% | 25.6% | 32.4% | 27.2% | |||||||||||||||
| U.S. Ally Consumer Penetration | ||||||||||||||||||||
| GM | 31.6% | 30.7% | 31.8% | 31.6% | 36.5% | |||||||||||||||
| Chrysler | 28.4% | 28.0% | 27.2% | 35.2% | 30.3% | |||||||||||||||
| U.S. Ally Consumer Originations (1) ($ in billions) | ||||||||||||||||||||
| GM new retail subvented | $ | 1.9 | $ | 1.7 | $ | 2.0 | $ | 1.5 | $ | 1.4 | $ | 0.2 | $ | 0.5 | ||||||
| GM new retail standard | 1.5 | 1.6 | 1.7 | 1.9 | 2.1 | (0.1) | (0.6) | |||||||||||||
| Chrysler new retail subvented | 0.7 | 0.5 | 0.5 | 0.9 | 0.5 | 0.2 | 0.2 | |||||||||||||
| Chrysler new retail standard | 1.1 | 1.1 | 1.0 | 1.2 | 0.9 | 0.1 | 0.3 | |||||||||||||
| Diversified new | 0.6 | 0.5 | 0.4 | 0.4 | 0.4 | 0.1 | 0.2 | |||||||||||||
| Lease (2) | 2.1 | 1.6 | 1.3 | 1.7 | 2.1 | 0.5 | 0.0 | |||||||||||||
| Used | 2.6 | 2.6 | 2.3 | 2.3 | 2.1 | (0.1) | 0.4 | |||||||||||||
| Total U.S. originations | $ | 10.5 | $ | 9.7 | $ | 9.2 | $ | 10.0 | $ | 9.5 | $ | 0.8 | $ | 1.1 | ||||||
| NAO Ally Consumer Originations ($ in billions) | ||||||||||||||||||||
| Total U.S. originations | $ | 10.5 | $ | 9.7 | $ | 9.2 | $ | 10.0 | $ | 9.5 | $ | 0.8 | $ | 1.1 | ||||||
| Total Canada originations | 1.1 | 0.8 | 1.0 | 1.1 | 0.8 | 0.3 | 0.3 | |||||||||||||
| Total NAO originations | $ | 11.7 | $ | 10.5 | $ | 10.1 | $ | 11.1 | $ | 10.3 | $ | 1.1 | $ | 1.4 | ||||||
| U.S. Ally Consumer Originations - Additional Data | ||||||||||||||||||||
| Number of contracts originated (# in thousands) | 398 | 376 | 338 | 379 | 367 | 22 | 32 | |||||||||||||
| GM subvented (% based on # of new GM units originated) (3) | 64% | 59% | 58% | 54% | 52% | |||||||||||||||
| Chrysler subvented (% based on # of new Chrysler units originated) (3) | 53% | 48% | 48% | 53% | 54% | |||||||||||||||
| Average original term in months | 68 | 67 | 66 | 66 | 65 | 1 | 3 | |||||||||||||
| U.S. Ally Floorplan (4) | ||||||||||||||||||||
| GM penetration | 71.2% | 72.2% | 73.9% | 75.1% | 79.3% | |||||||||||||||
| Chrysler penetration | 60.5% | 62.0% | 63.3% | 66.0% | 68.1% | |||||||||||||||
| Floorplan outstandings (avg. $ in billions) | $ | 27.3 | $ | 26.0 | $ | 24.9 | $ | 24.3 | $ | 25.1 | $ | 1.3 | $ | 2.1 | ||||||
| NAO Ally Commercial ($ in billions) (4) | ||||||||||||||||||||
| Floorplan outstandings | $ | 31.0 | $ | 29.6 | $ | 28.7 | $ | 28.6 | $ | 29.9 | $ | 1.4 | $ | 1.1 | ||||||
| Other dealer loans | 3.2 | 3.1 | 2.9 | 2.8 | 2.7 | 0.1 | 0.5 | |||||||||||||
| Total commercial outstandings | $ | 34.1 | $ | 32.7 | $ | 31.5 | $ | 31.3 | $ | 32.5 | $ | 1.5 | $ | 1.6 | ||||||
| U.S. Off-Lease Remarketing(5) | ||||||||||||||||||||
| Sales proceeds on scheduled lease terminations (36-month) per vehicle - On-balance sheet | NM | NM | $ | 23,365 | $ | 20,608 | $ | 20,356 | NM | NM | ||||||||||
| Off-lease vehicles terminated - On-balance sheet (# in units) | 12,846 | 15,180 | 27,733 | 55,416 | 74,109 | (2,334) | (61,263) | |||||||||||||
| (1) | Some standard rate loan originations contain manufacturer sponsored cash back rebate incentives. Some lease originations contain rate subvention. While Ally may jointly develop marketing programs for these originations, Ally does not have exclusive rights to such originations under operating agreements with manufacturers |
| (2) | Includes GM and Chrysler lease originations |
| (3) | Represents subvented originations inclusive of leases not subject to exclusivity agreements |
| (4) | Penetration rates and commercial outstandings are based on the trailing four month average end of period dealer stocks |
| (5) | U.S. off-lease remarketing sales proceeds for 36 month leases are not meaningful (NM) as originations of this lease type were immaterial in 1Q 09 & 2Q 09 |
| 2Q 2012 Preliminary Results | 10 |
|
ALLY FINANCIAL INC. INTERNATIONAL AUTO - CONDENSED FINANCIAL STATEMENTS |
| ($ in millions) | ||||||||||||||||||||
| QUARTERLY TRENDS | CHANGE VS. | |||||||||||||||||||
| Income Statement | 2Q 12 | 1Q 12 | 4Q 11 | 3Q 11 | 2Q 11 | 1Q 12 | 2Q 11 | |||||||||||||
| Net financing revenue | ||||||||||||||||||||
| Consumer | $ | 298 | $ | 304 | $ | 291 | $ | 301 | $ | 314 | $ | (6) | $ | (16) | ||||||
| Commercial (1) | 90 | 93 | 96 | 111 | 111 | (3) | (21) | |||||||||||||
| Operating leases | 5 | 4 | 4 | 3 | 4 | 1 | 1 | |||||||||||||
| Other interest income (2) | 15 | 17 | 20 | 23 | 23 | (2) | (8) | |||||||||||||
| Total financing revenue and other interest income | 408 | 418 | 411 | 438 | 452 | (10) | (44) | |||||||||||||
| Interest expense | 234 | 252 | 253 | 270 | 274 | (18) | (40) | |||||||||||||
| Depreciation expense on operating lease assets | 3 | 2 | 1 | 1 | 6 | 1 | (3) | |||||||||||||
| Net financing revenue | 171 | 164 | 157 | 167 | 172 | 7 | (1) | |||||||||||||
| Other revenue | ||||||||||||||||||||
| Other income | 59 | 66 | 64 | 61 | 56 | (7) | 3 | |||||||||||||
| Total other revenue | 59 | 66 | 64 | 61 | 56 | (7) | 3 | |||||||||||||
| Total net revenue | 230 | 230 | 221 | 228 | 228 | - | 2 | |||||||||||||
| Provision for loan losses | 15 | 47 | 23 | (2) | 7 | (32) | 8 | |||||||||||||
| Noninterest expense | ||||||||||||||||||||
| Compensation and benefits | 43 | 44 | 40 | 44 | 44 | (1) | (1) | |||||||||||||
| Other operating expenses | 100 | 94 | 137 | 97 | 108 | 6 | (8) | |||||||||||||
| Total noninterest expense | 143 | 138 | 177 | 141 | 152 | 5 | (9) | |||||||||||||
| Income from cont. ops before income tax expense (benefit) | $ | 72 | $ | 45 | $ | 21 | $ | 89 | $ | 69 | $ | 27 | $ | 3 | ||||||
| Balance Sheet (Period-End) | ||||||||||||||||||||
| Cash, trading and investment securities | $ | 22 | $ | 21 | $ | 25 | $ | 176 | $ | 192 | $ | 1 | $ | (170) | ||||||
| Finance receivables and loans, net: | ||||||||||||||||||||
| Consumer loans | 9,826 | 10,139 | 9,383 | 9,198 | 9,810 | (313) | 16 | |||||||||||||
| Commercial loans (3) | 4,368 | 4,778 | 4,912 | 4,778 | 5,214 | (410) | (846) | |||||||||||||
| Allowance for loan losses | (193) | (220) | (182) | (174) | (207) | 27 | 14 | |||||||||||||
| Total finance receivables and loans, net | $ | 14,001 | $ | 14,697 | $ | 14,113 | $ | 13,802 | $ | 14,817 | $ | (696) | $ | (816) | ||||||
| Other assets | 1,444 | 1,336 | 1,367 | 1,336 | 1,573 | 108 | (129) | |||||||||||||
| Total assets | $ | 15,467 | $ | 16,054 | $ | 15,505 | $ | 15,314 | $ | 16,582 | $ | (587) | $ | (1,115) | ||||||
| (1) | Includes interest on notes receivable from General Motors and intercompany |
| (2) | Includes interest-bearing cash |
| (3) | Includes notes receivable from General Motors and intercompany |
| 2Q 2012 Preliminary Results | 11 |
|
ALLY FINANCIAL INC. INTERNATIONAL AUTO - KEY STATISTICS |
| ($ in millions) | ||||||||||||||||||||
| QUARTERLY TRENDS | CHANGE VS. | |||||||||||||||||||
| Consumer Originations | 2Q 12 | 1Q 12 | 4Q 11 | 3Q 11 | 2Q 11 | 1Q 12 | 2Q 11 | |||||||||||||
| Germany | $ | 458 | $ | 351 | $ | 385 | $ | 512 | $ | 489 | $ | 107 | $ | (30) | ||||||
| Brazil | 513 | 525 | 573 | 535 | 481 | (12) | 32 | |||||||||||||
| U.K. | 201 | 394 | 300 | 341 | 159 | (193) | 42 | |||||||||||||
| Mexico | 145 | 158 | 154 | 158 | 140 | (14) | 5 | |||||||||||||
| China (1) | 666 | 558 | 880 | 835 | 716 | 108 | (50) | |||||||||||||
| Other | 323 | 307 | 333 | 257 | 282 | 16 | 40 | |||||||||||||
| Total Continuing International Operations | $ | 2,306 | $ | 2,294 | $ | 2,624 | $ | 2,638 | $ | 2,267 | $ | 12 | $ | 39 | ||||||
| Consumer Origination Statistics (Continuing Operations) | ||||||||||||||||||||
| Number of contracts originated (# thousands) | 172 | 156 | 186 | 174 | 150 | 16 | 22 | |||||||||||||
| Dollar amount of contracts originated | $ | 2,306 | $ | 2,294 | $ | 2,624 | $ | 2,638 | $ | 2,267 | $ | 12 | $ | 39 | ||||||
| Dollar amount of retail contracts outstanding at end of period (2) | $ | 9,826 | $ | 10,139 | $ | 9,383 | $ | 9,198 | $ | 9,810 | $ | (313) | $ | 16 | ||||||
| GM subvented (% based on # of GM units originated) (3) | 55% | 57% | 53% | 59% | 50% | |||||||||||||||
| Mix of retail & lease contract originations (% based on # of units) | ||||||||||||||||||||
| New | 93% | 93% | 95% | 94% | 93% | |||||||||||||||
| Used | 7% | 6% | 5% | 6% | 7% | |||||||||||||||
| (1) | Originations in China are part of a joint-venture in which Ally owns a minority interest |
| (2) | Excludes China JV receivables |
| (3) | Represents subvented originations inclusive of leases not subject to exclusivity agreements |
| 2Q 2012 Preliminary Results | 12 |
|
ALLY FINANCIAL INC. INSURANCE - CONDENSED FINANCIAL STATEMENTS AND KEY STATISTICS |
| ($ in millions) | ||||||||||||||||||||
| QUARTERLY TRENDS | CHANGE VS. | |||||||||||||||||||
| Income Statement | 2Q 12 | 1Q 12 | 4Q 11 | 3Q 11 | 2Q 11 | 1Q 12 | 2Q 11 | |||||||||||||
| Insurance premiums and other income | ||||||||||||||||||||
| Insurance premiums and service revenue earned | $ | 359 | $ | 371 | $ | 381 | $ | 387 | $ | 395 | $ | (12) | $ | (36) | ||||||
| Investment income | 47 | 82 | 59 | 44 | 70 | (35) | (23) | |||||||||||||
| Other income | 25 | 15 | 12 | 16 | 18 | 10 | 7 | |||||||||||||
| Total insurance premiums and other income | 431 | 468 | 452 | 447 | 483 | (37) | (52) | |||||||||||||
| Expense | ||||||||||||||||||||
| Insurance losses and loss adjustment expenses | 205 | 155 | 142 | 162 | 221 | 50 | (16) | |||||||||||||
| Acquisition and underwriting expenses | ||||||||||||||||||||
| Compensation and benefit expense | 24 | 25 | 23 | 19 | 24 | (1) | - | |||||||||||||
| Insurance commission expense | 111 | 116 | 135 | 120 | 122 | (5) | (11) | |||||||||||||
| Other expense | 48 | 48 | 59 | 35 | 44 | - | 4 | |||||||||||||
| Total acquisition and underwriting expense | 183 | 189 | 217 | 174 | 190 | (6) | (7) | |||||||||||||
| Total expense | 388 | 344 | 359 | 336 | 411 | 44 | (23) | |||||||||||||
| Income from cont. ops before income tax expense | $ | 43 | $ | 124 | $ | 93 | $ | 111 | $ | 72 | $ | (81) | $ | (29) | ||||||
| Balance Sheet (Period-End) | ||||||||||||||||||||
| Cash, trading and investment securities | $ | 5,489 | $ | 5,587 | $ | 5,267 | $ | 5,494 | $ | 5,688 | $ | (98) | $ | (199) | ||||||
| Finance receivables and loans, net | 5 | 5 | 5 | 5 | 5 | - | - | |||||||||||||
| Premiums receivable and other insurance assets | 2,019 | 2,010 | 1,970 | 2,141 | 2,239 | 9 | (220) | |||||||||||||
| Other assets | 724 | 792 | 794 | 575 | 601 | (68) | 123 | |||||||||||||
| Total assets | $ | 8,237 | $ | 8,394 | $ | 8,036 | $ | 8,215 | $ | 8,533 | $ | (157) | $ | (296) | ||||||
| Key Statistics (Continuing Operations) | ||||||||||||||||||||
| Written Premiums | ||||||||||||||||||||
| Dealer Products & Services | $ | 283 | $ | 250 | $ | 232 | $ | 280 | $ | 277 | $ | 33 | $ | 6 | ||||||
| International(1) | 103 | 123 | 104 | 100 | 120 | (21) | (17) | |||||||||||||
| Total written premiums and revenue (2) | $ | 386 | $ | 373 | $ | 335 | $ | 380 | $ | 397 | $ | 13 | $ | (11) | ||||||
| Loss ratio | 54.4% | 40.5% | 36.3% | 40.6% | 54.5% | |||||||||||||||
| Underwriting expense ratio | 48.8% | 49.2% | 55.8% | 43.5% | 47.3% | |||||||||||||||
| Combined ratio | 103.2% | 89.7% | 92.1% | 84.1% | 101.7% | |||||||||||||||
| (1) | Includes written premiums held at Corporate |
| (2) | Excludes discontinued operations |
| 2Q 2012 Preliminary Results | 13 |
|
ALLY FINANCIAL INC. MORTGAGE OPERATIONS (1) - CONDENSED FINANCIAL STATEMENTS AND KEY STATISTICS |
| ($ in millions) | ||||||||||||||||||||
| QUARTERLY TRENDS | CHANGE VS. | |||||||||||||||||||
| Income Statement | 2Q 12 | 1Q 12 | 4Q 11 | 3Q 11 | 2Q 11 | 1Q 12 | 2Q 11 | |||||||||||||
| Net financing revenue | ||||||||||||||||||||
| Total financing revenue and other interest income | $ | 181 | $ | 259 | $ | 269 | $ | 289 | $ | 291 | $ | (78) | $ | (110) | ||||||
| Interest expense | 148 | 202 | 214 | 214 | 222 | (54) | (74) | |||||||||||||
| Net financing revenue | 33 | 57 | 55 | 75 | 69 | (24) | (36) | |||||||||||||
| Servicing fees | 186 | 280 | 291 | 296 | 300 | (94) | (114) | |||||||||||||
| Servicing asset valuation and hedge activities, net | (73) | 9 | (126) | (471) | (105) | (82) | 32 | |||||||||||||
| Total servicing income, net | 113 | 289 | 165 | (175) | 195 | (176) | (82) | |||||||||||||
| Gain on mortgage loans, net | 128 | 131 | 150 | 57 | 97 | (3) | 31 | |||||||||||||
| Other income, net of losses | 127 | 127 | 69 | 19 | 30 | - | 97 | |||||||||||||
| Total other revenue | 368 | 547 | 384 | (99) | 322 | (179) | 46 | |||||||||||||
| Total net revenue | 401 | 604 | 439 | (24) | 391 | (203) | 10 | |||||||||||||
| Provision for loan losses | 21 | 27 | 35 | 31 | 37 | (6) | (16) | |||||||||||||
| Noninterest expense | ||||||||||||||||||||
| Compensation and benefits expense | 75 | 124 | 112 | 87 | 100 | (49) | (25) | |||||||||||||
| Representation and warranty expense | 16 | 19 | 44 | 69 | 184 | (3) | (169) | |||||||||||||
| Other operating expense | 265 | 243 | 506 | 198 | 195 | 22 | 71 | |||||||||||||
| Total noninterest expense | 356 | 386 | 662 | 354 | 479 | (30) | (123) | |||||||||||||
| Income (loss) from cont. ops before income tax expense | $ | 24 | $ | 191 | $ | (258) | $ | (409) | $ | (125) | $ | (167) | $ | 149 | ||||||
| Balance Sheet (Period-End) | ||||||||||||||||||||
| Cash, trading and investment securities | $ | - | $ | 685 | $ | 652 | $ | 673 | $ | 730 | $ | (685) | $ | (730) | ||||||
| Loans held-for-sale | 1,377 | 6,047 | 8,112 | 8,254 | 7,168 | (4,670) | (5,791) | |||||||||||||
| Finance receivables and loans, net: | ||||||||||||||||||||
| Consumer loans | 9,823 | 10,790 | 10,828 | 11,109 | 11,358 | (967) | (1,535) | |||||||||||||
| Commercial loans | 1,146 | 1,418 | 1,925 | 1,642 | 1,254 | (272) | (108) | |||||||||||||
| Allowance for loan losses | (473) | (518) | (532) | (542) | (566) | 45 | 93 | |||||||||||||
| Total finance receivables and loans, net | $ | 10,496 | $ | 11,690 | $ | 12,221 | $ | 12,209 | $ | 12,046 | $ | (1,194) | $ | (1,550) | ||||||
| Mortgage servicing rights | 1,105 | 2,595 | 2,519 | 2,663 | 3,701 | (1,490) | (2,596) | |||||||||||||
| Other assets | 4,168 | 9,062 | 10,402 | 11,703 | 7,678 | (4,894) | (3,510) | |||||||||||||
| Total assets | $ | 17,146 | $ | 30,079 | $ | 33,906 | $ | 35,502 | $ | 31,323 | $ | (12,933) | $ | (14,177) | ||||||
| Key Statistics ($ in billions) | ||||||||||||||||||||
| Mortgage loan production | ||||||||||||||||||||
| Prime conforming | $ | 4.9 | $ | 6.6 | $ | 13.7 | $ | 13.3 | $ | 10.6 | $ | (1.7) | $ | (5.7) | ||||||
| Prime non-conforming | 0.6 | 0.5 | 0.5 | 0.5 | 0.3 | 0.1 | 0.3 | |||||||||||||
| Government | 0.5 | 1.5 | 2.3 | 1.8 | 1.5 | (1.0) | (1.0) | |||||||||||||
| Total mortgage loan production | $ | 5.9 | $ | 8.6 | $ | 16.5 | $ | 15.6 | $ | 12.3 | $ | (2.6) | $ | (6.4) | ||||||
| (1) | Mortgage Operations includes ResCap results prior to the May 14, 2012 deconsolidation |
| 2Q 2012 Preliminary Results | 14 |
|
ALLY FINANCIAL INC. CORPORATE AND OTHER - CONDENSED FINANCIAL STATEMENTS |
| ($ in millions) | ||||||||||||||||||||
| QUARTERLY TRENDS | CHANGE VS. | |||||||||||||||||||
| Income Statement | 2Q 12 | 1Q 12 | 4Q 11 | 3Q 11 | 2Q 11 | 1Q 12 | 2Q 11 | |||||||||||||
| Net financing loss | ||||||||||||||||||||
| Total financing revenue and other interest income | $ | 43 | $ | 38 | $ | 24 | $ | 26 | $ | 41 | $ | 5 | $ | 2 | ||||||
| Interest expense | ||||||||||||||||||||
| Core original issue discount amortization | 96 | 108 | 137 | 225 | 254 | (11) | (158) | |||||||||||||
| Other interest expense | 229 | 277 | 222 | 212 | 213 | (49) | 16 | |||||||||||||
| Total interest expense | 325 | 385 | 359 | 437 | 467 | (60) | (142) | |||||||||||||
| Net financing loss | (282) | (347) | (335) | (411) | (426) | 65 | 144 | |||||||||||||
| Other revenue | ||||||||||||||||||||
| Loss on extinguishment of debt (1) | - | - | - | - | (25) | - | 25 | |||||||||||||
| Other gain on investments, net | 36 | 24 | 6 | 48 | 40 | 12 | (4) | |||||||||||||
| Other income, net of losses | (57) | 23 | 12 | (8) | 92 | (80) | (149) | |||||||||||||
| Total other (expense) revenue | (21) | 47 | 18 | 40 | 107 | (68) | (128) | |||||||||||||
| Total net expense | (303) | (300) | (317) | (371) | (319) | (3) | 16 | |||||||||||||
| Provision for loan losses | (23) | (12) | (19) | (4) | (49) | (11) | 26 | |||||||||||||
| Noninterest expense | ||||||||||||||||||||
| Compensation and benefits expense | 139 | 163 | 152 | 51 | 136 | (24) | 3 | |||||||||||||
| Other operating expense (2) | 1,200 | (15) | 1 | 30 | (22) | 1,215 | 1,222 | |||||||||||||
| Total noninterest expense | 1,339 | 148 | 153 | 81 | 114 | 1,191 | 1,225 | |||||||||||||
| Loss from cont. ops before income tax (benefit) expense | $ | (1,619) | $ | (436) | $ | (451) | $ | (448) | $ | (384) | $ | (1,183) | $ | (1,235) | ||||||
| Balance Sheet (Period-End) | ||||||||||||||||||||
| Cash, trading and investment securities | $ | 23,981 | $ | 22,623 | $ | 22,847 | $ | 24,544 | $ | 24,563 | $ | 1,358 | $ | (582) | ||||||
| Loans held-for-sale | - | - | 20 | 27 | - | - | - | |||||||||||||
| Finance receivables and loans, net | ||||||||||||||||||||
| Consumer loans | - | - | - | 1 | - | - | - | |||||||||||||
| Commercial loans (3) | 2,379 | 1,167 | 1,152 | 1,108 | 1,186 | 1,212 | 1,193 | |||||||||||||
| Allowance for loan losses | (48) | (52) | (53) | (67) | (69) | 4 | 21 | |||||||||||||
| Total finance receivables and loans, net | 2,331 | 1,115 | 1,099 | 1,042 | 1,117 | 1,216 | 1,214 | |||||||||||||
| Other assets | 6,471 | 5,191 | 5,675 | 6,780 | 5,828 | 1,280 | 643 | |||||||||||||
| Total assets | $ | 32,783 | $ | 28,929 | $ | 29,641 | $ | 32,393 | $ | 31,508 | $ | 3,854 | $ | 1,275 | ||||||
| OID Amortization Schedule | 2012 | 2013 | 2014 | 2015
and After |
||||||||||||||||
| Remaining Core OID Amortization (as of 6/30/2012) | $ | 132 | $ | 249 | $ | 176 | Avg / Yr = $52 | |||||||||||||
| (1) | Includes $20 million of accelerated OID amortization in 2Q11 |
| (2) | Includes a reduction of $173 million and $386 million, for the three months and six months ended June 30, 2012, and $208 million and $408 million for the three months and six months ended June 30, 2011, related to the allocation of corporate overhead expenses to other segments. The receiving segments record their allocation of corporate overhead expense within other operating expense. 2Q12 other operating expense includes the $1,192 million charge recorded for ResCap actions |
| (3) | Includes Intercompany |
| 2Q 2012 Preliminary Results | 15 |
|
ALLY FINANCIAL INC. CREDIT RELATED INFORMATION |
| ($ in millions) | ||||||||||||||||||||
| QUARTERLY TRENDS | CHANGE VS. | |||||||||||||||||||
| Asset Quality - Consolidated (1) | 2Q 12 | 1Q 12 | 4Q 11 | 3Q 11 | 2Q 11 | 1Q 12 | 2Q 11 | |||||||||||||
| Ending loan balance | $ | 119,913 | $ | 118,986 | $ | 113,920 | $ | 107,871 | $ | 109,779 | $ | 927 | $ | 10,134 | ||||||
| 30+ Accruing DPD | $ | 932 | $ | 802 | $ | 1,038 | $ | 972 | $ | 979 | $ | 130 | $ | (48) | ||||||
| 30+ Accruing DPD % | 0.8% | 0.7% | 0.9% | 0.9% | 0.9% | |||||||||||||||
| Non-performing loans (NPLs) | $ | 995 | $ | 845 | $ | 906 | $ | 977 | $ | 1,191 | $ | 150 | $ | (196) | ||||||
| Net charge-offs (NCOs) | $ | 88 | $ | 107 | $ | 120 | $ | 123 | $ | 121 | $ | (19) | $ | (33) | ||||||
| Net charge-off rate (2) | 0.29% | 0.37% | 0.43% | 0.45% | 0.45% | |||||||||||||||
| Provision for loan losses | $ | 29 | $ | 140 | $ | 6 | $ | 50 | $ | 50 | $ | (111) | $ | (21) | ||||||
| Allowance for loan losses (ALLL) | $ | 1,427 | $ | 1,546 | $ | 1,503 | $ | 1,621 | $ | 1,739 | $ | (119) | $ | (312) | ||||||
| ALLL as % of Loans (3) | 1.2% | 1.3% | 1.3% | 1.5% | 1.6% | |||||||||||||||
| ALLL as % of NPLs (3) | 143.4% | 182.9% | 166.0% | 165.8% | 146.0% | |||||||||||||||
| ALLL as % of NCOs (3) | 405.2% | 361.2% | 313.8% | 329.3% | 358.0% | |||||||||||||||
| (1) | Loans within this table are classified as held-for-investment recorded at historical cost as these loans are included in our allowance for loan losses |
| (2) | Net charge-off ratios are calculated as annualized net charge-offs divided by average outstanding finance receivables and loans excluding loans measured at fair value and loans held-for-sale |
| (3) | ALLL coverage ratios are based on the allowance for loan losses related to loans held-for-investment excluding those loans held at fair value as a percentage of the unpaid principal balance, net of premiums and discounts |
| 2Q 2012 Preliminary Results | 16 |
|
ALLY FINANCIAL INC. CREDIT RELATED INFORMATION, CONTINUED |
| ($ in millions) | ||||||||||||||||||||
| North American Auto | QUARTERLY TRENDS | CHANGE VS. | ||||||||||||||||||
| Consumer | 2Q 12 | 1Q 12 | 4Q 11 | 3Q 11 | 2Q 11 | 1Q 12 | 2Q 11 | |||||||||||||
| Allowance for loan losses | $ | 611 | $ | 654 | $ | 628 | $ | 724 | $ | 763 | $ | (43) | $ | (151) | ||||||
| Total consumer loans | $ | 58,310 | $ | 57,075 | $ | 54,076 | $ | 50,507 | $ | 48,925 | $ | 1,236 | $ | 9,385 | ||||||
| Coverage ratio | 1.0% | 1.1% | 1.2% | 1.4% | 1.6% | |||||||||||||||
| Commercial | ||||||||||||||||||||
| Allowance for loan losses | $ | 102 | $ | 102 | $ | 108 | $ | 114 | $ | 134 | $ | (0) | $ | (33) | ||||||
| Total commercial loans | $ | 34,056 | $ | 34,446 | $ | 32,475 | $ | 30,395 | $ | 32,994 | $ | (390) | $ | 1,062 | ||||||
| Coverage ratio | 0.3% | 0.3% | 0.3% | 0.4% | 0.4% | |||||||||||||||
| International Auto | ||||||||||||||||||||
| Consumer | ||||||||||||||||||||
| Allowance for loan losses | $ | 167 | $ | 178 | $ | 138 | $ | 127 | $ | 148 | $ | (11) | $ | 19 | ||||||
| Total consumer loans | $ | 9,826 | $ | 10,139 | $ | 9,383 | $ | 9,198 | $ | 9,810 | $ | (313) | $ | 16 | ||||||
| Coverage ratio | 1.7% | 1.8% | 1.5% | 1.4% | 1.5% | |||||||||||||||
| Commercial | ||||||||||||||||||||
| Allowance for loan losses | $ | 26 | $ | 42 | $ | 44 | $ | 47 | $ | 58 | $ | (15) | $ | (32) | ||||||
| Total commercial loans | $ | 4,282 | $ | 4,656 | $ | 4,795 | $ | 4,318 | $ | 4,717 | $ | (375) | $ | (436) | ||||||
| Coverage ratio | 0.6% | 0.9% | 0.9% | 1.1% | 1.2% | |||||||||||||||
| Mortgage HFI (1) | ||||||||||||||||||||
| Consumer | ||||||||||||||||||||
| Allowance for loan losses | $ | 472 | $ | 501 | $ | 516 | $ | 532 | $ | 558 | $ | (29) | $ | (85) | ||||||
| Total consumer loans | $ | 9,823 | $ | 9,958 | $ | 9,993 | $ | 10,269 | $ | 10,412 | $ | (135) | $ | (589) | ||||||
| Coverage ratio | 4.8% | 5.0% | 5.2% | 5.2% | 5.4% | |||||||||||||||
| Non-performing loans | $ | 411 | $ | 298 | $ | 339 | $ | 365 | $ | 398 | $ | 113 | $ | 13 | ||||||
| Allowance as a % of NPLs | 114.8% | 168.2% | 152.1% | 145.7% | 140.0% | |||||||||||||||
| Commercial | ||||||||||||||||||||
| Allowance for loan losses | $ | 1 | $ | 17 | $ | 16 | $ | 10 | $ | 8 | $ | (17) | $ | (8) | ||||||
| Total commercial loans | $ | 1,146 | $ | 1,418 | $ | 1,925 | $ | 1,642 | $ | 1,254 | $ | (272) | $ | (107) | ||||||
| Coverage ratio | 0.1% | 1.2% | 0.8% | 0.6% | 0.7% | |||||||||||||||
| Non-performing loans | $ | 0 | $ | 41 | $ | 13 | $ | 48 | $ | 67 | $ | (41) | $ | (67) | ||||||
| Allowance as a % of NPLs | NM | 41.8% | 126.1% | 21.0% | 12.3% | |||||||||||||||
| (1) | ALLL coverage ratios are based on the allowance for loan losses related to loans held-for-investment excluding those loans held at fair value as a percentage of the unpaid principal balance, net of premiums and discounts. Includes ResCap results prior to the May 14, 2012 deconsolidation |
| 2Q 2012 Preliminary Results | 17 |
|
ALLY FINANCIAL INC. CREDIT RELATED INFORMATION, CONTINUED |
| ($ in millions) | ||||||||||||||||||||
| QUARTERLY TRENDS | CHANGE VS. | |||||||||||||||||||
| Global Auto Delinquencies - Managed Retail Contract Amount (1) | 2Q 12 | 1Q 12 | 4Q 11 | 3Q 11 | 2Q 11 | 1Q 12 | 2Q 11 | |||||||||||||
| Nuvell delinquent contract $ | $ | 77 | $ | 68 | $ | 131 | $ | 126 | $ | 149 | $ | 9 | $ | (71) | ||||||
| Delinquent contract $ (excluding Nuvell) | $ | 768 | $ | 637 | $ | 806 | $ | 735 | $ | 722 | $ | 131 | $ | 46 | ||||||
| % of retail contract $ outstanding | 1.23% | 1.04% | 1.47% | 1.43% | 1.48% | |||||||||||||||
| % of retail contract $ outstanding (excluding Nuvell) | 1.13% | 0.95% | 1.29% | 1.25% | 1.27% | |||||||||||||||
| Global Auto Annualized Credit Losses - Managed Retail Contract Amount | ||||||||||||||||||||
| Nuvell credit losses | $ | 5 | $ | 10 | $ | 16 | $ | 17 | $ | 14 | $ | (5) | $ | (9) | ||||||
| Credit losses (excluding Nuvell) | $ | 66 | $ | 63 | $ | 63 | $ | 55 | $ | 46 | $ | 2 | $ | 20 | ||||||
| % of avg. managed assets | 0.41% | 0.44% | 0.51% | 0.48% | 0.41% | |||||||||||||||
| % of avg. managed assets (excluding Nuvell) | 0.39% | 0.39% | 0.41% | 0.37% | 0.33% | |||||||||||||||
| North American Auto | ||||||||||||||||||||
| Annualized consumer net charge-offs as a % of on-balance sheet assets | 0.31% | 0.41% | 0.51% | 0.45% | 0.39% | |||||||||||||||
| Managed retail contracts over 30 days delinquent | 1.21% | 0.99% | 1.51% | 1.41% | 1.45% | |||||||||||||||
| Repossessions as a % of average number of managed retail contracts outstanding | 1.03% | 1.30% | 1.42% | 1.54% | 1.36% | |||||||||||||||
| Severity of loss per unit sold - Retail | ||||||||||||||||||||
| New | $ | 7,156 | $ | 7,374 | $ | 7,957 | $ | 7,584 | $ | 7,631 | $ | (218) | $ | (474) | ||||||
| Used | $ | 5,548 | $ | 5,752 | $ | 6,129 | $ | 6,144 | $ | 6,260 | $ | (204) | $ | (712) | ||||||
| Lease residual value (sales proceeds as % of ALG) | 138% | 137% | 128% | 128% | 127% | |||||||||||||||
| International Auto | ||||||||||||||||||||
| Annualized consumer net charge-offs as a % of on-balance sheet assets | 1.01% | 0.66% | 0.46% | 0.60% | 0.50% | |||||||||||||||
| Managed retail contracts over 30 days delinquent | 1.35% | 1.34% | 1.24% | 1.57% | 1.64% | |||||||||||||||
| Repossessions as a % of average number of managed retail contracts outstanding | 0.49% | 0.49% | 0.48% | 0.51% | 0.64% | |||||||||||||||
| (1) | $ Amount of accruing contracts greater than 30 days past due |
| 2Q 2012 Preliminary Results | 18 |
|
ALLY FINANCIAL INC. CAPITAL |
| ($ in billions) | ||||||||||||||||||||
| QUARTERLY TRENDS | CHANGE VS. | |||||||||||||||||||
| Cost of Funds | 2Q 12 | 1Q 12 | 4Q 11 | 3Q 11 | 2Q 11 | 1Q 12 | 2Q 11 | |||||||||||||
| Ally Financial's worldwide cost of borrowing (incl. OID) | 3.6% | 4.0% | 3.9% | 4.2% | 4.6% | |||||||||||||||
| Ally Financial's worldwide cost of borrowing (excl. OID) | 3.2% | 3.6% | 3.5% | 3.6% | 3.8% | |||||||||||||||
| Capital | ||||||||||||||||||||
| Risk-weighted assets | $ | 147.9 | $ | 158.5 | $ | 154.3 | $ | 149.7 | $ | 151.0 | $ | (10.6) | $ | (3.1) | ||||||
| Tier 1 capital ratio | 13.7% | 13.5% | 13.7% | 14.3% | 14.6% | |||||||||||||||
| Tier 1 common capital ratio | 7.3% | 7.5% | 7.6% | 8.0% | 8.4% | |||||||||||||||
| Total risk-based capital ratio | 14.7% | 14.5% | 14.7% | 15.5% | 15.9% | |||||||||||||||
| Tangible common equity / Tangible assets | 6.1% | 6.6% | 6.5% | 6.8% | 7.3% | |||||||||||||||
| Tangible common equity / Risk-weighted assets | 7.4% | 7.7% | 7.7% | 8.2% | 8.6% | |||||||||||||||
| Shareholders’ equity | $ | 18.4 | $ | 19.7 | $ | 19.4 | $ | 19.7 | $ | 20.4 | $ | (1.3) | $ | (2.0) | ||||||
| less: Goodwill and certain other intangibles | (0.5) | (0.5) | (0.5) | (0.5) | (0.5) | - | - | |||||||||||||
| Unrealized (gains) losses and other adjustments | (0.2) | (0.3) | (0.3) | (0.3) | (0.3) | 0.1 | 0.1 | |||||||||||||
| Trust preferred securities | 2.5 | 2.5 | 2.5 | 2.5 | 2.5 | - | - | |||||||||||||
| Tier 1 capital | $ | 20.2 | $ | 21.4 | $ | 21.2 | $ | 21.5 | $ | 22.1 | $ | (1.2) | $ | (1.9) | ||||||
| Tier 1 capital | $ | 20.2 | $ | 21.4 | $ | 21.2 | $ | 21.5 | $ | 22.1 | $ | (1.2) | $ | (1.9) | ||||||
| less: Preferred equity | (6.9) | (6.9) | (6.9) | (6.9) | (6.9) | - | - | |||||||||||||
| Trust preferred securities | (2.5) | (2.5) | (2.5) | (2.5) | (2.5) | - | - | |||||||||||||
| Tier 1 common capital (1) | $ | 10.8 | $ | 11.9 | $ | 11.7 | $ | 12.0 | $ | 12.6 | $ | (1.1) | $ | (1.8) | ||||||
| Tier 1 capital | $ | 20.2 | $ | 21.4 | $ | 21.2 | $ | 21.5 | $ | 22.1 | $ | (1.2) | $ | (1.9) | ||||||
| add: Qualifying subordinated debt and redeemable preferred stock | 0.2 | 0.2 | 0.2 | 0.2 | 0.2 | - | - | |||||||||||||
| Allowance for loan and lease losses includible in Tier 2 capital and other adjustments | 1.3 | 1.4 | 1.4 | 1.5 | 1.6 | (0.1) | (0.3) | |||||||||||||
| Total risk-based capital | $ | 21.7 | $ | 23.0 | $ | 22.8 | $ | 23.2 | $ | 24.0 | $ | (1.3) | $ | (2.3) | ||||||
| Total shareholders' equity | $ | 18.4 | $ | 19.7 | $ | 19.4 | $ | 19.7 | $ | 20.4 | $ | (1.3) | $ | (2.0) | ||||||
| less: Preferred equity | (6.9) | (6.9) | (6.9) | (6.9) | (6.9) | - | - | |||||||||||||
| Goodwill and intangible assets | (0.5) | (0.5) | (0.5) | (0.5) | (0.5) | - | - | |||||||||||||
| Tangible common equity (2) | $ | 10.9 | $ | 12.2 | $ | 11.9 | $ | 12.3 | $ | 13.0 | $ | (1.3) | $ | (2.1) | ||||||
| Total assets | $ | 178.6 | $ | 186.4 | $ | 184.1 | $ | 182.0 | $ | 178.9 | $ | (7.8) | $ | (0.3) | ||||||
| less: Goodwill and intangible assets | (0.5) | (0.5) | (0.5) | (0.5) | (0.5) | - | - | |||||||||||||
| Tangible assets | $ | 178.1 | $ | 185.9 | $ | 183.6 | $ | 181.4 | $ | 178.4 | $ | (7.8) | $ | (0.3) | ||||||
Note: Numbers may not foot due to rounding
| (1) | We define Tier 1 common as Tier 1 capital less noncommon elements including qualified perpetual preferred stock qualifying minority interest in subsidiaries, and qualifying trust preferred securities. Ally considers various measures when evaluating capital utilization and adequacy, including the Tier 1 common equity ratio, in addition to capital ratios defined by banking regulators. This calculation is intended to complement the capital ratios defined by banking regulators for both absolute and comparative purposes. Because GAAP does not include capital ratio measures, Ally believes there are no comparable GAAP financial measures to these ratios. Tier 1 common equity is not formally defined by GAAP or codified in the federal banking regulations and, therefore, is considered to be a non-GAAP financial measure. Ally believes the Tier 1 common equity ratio is important because we believe analysts and banking regulators may assess our capital adequacy using this ratio. Additionally, presentation of this measure allows readers to compare certain aspects of our capital adequacy on the same basis to other companies in the industry. |
| (2) | We define tangible common equity as common stockholders’ equity less goodwill and identifiable intangible assets (other than mortgage servicing rights), net of deferred tax liabilities. Ally considers various measures when evaluating capital adequacy, including tangible common equity. Tangible common equity is not formally defined by GAAP or codified in the federal banking regulations and, therefore, is considered to be a non-GAAP financial measure. Ally believes that tangible common equity is important because we believe analysts and banking regulators may assess our capital adequacy using this measure. Additionally, presentation of this measure allows readers to compare certain aspects of our capital adequacy on the same basis to other companies in the industry. |
| 2Q 2012 Preliminary Results | 19 |
|
ALLY FINANCIAL INC. LIQUIDITY |
| ($ in billions) | ||||||||||||||||||
| 2Q 12 | 1Q 12 | CHANGE | ||||||||||||||||
| Available Liquidity | Parent (1) | Ally Bank | Parent (1) | Ally Bank | Parent (1) | Ally Bank | ||||||||||||
| Cash and cash equivalents | $ | 11.4 | $ | 3.4 | $ | 6.8 | $ | 4.4 | $ | 4.6 | $ | (1.0) | ||||||
| Highly liquid securities (2) | - | 5.0 | 0.2 | 5.4 | (0.2) | (0.4) | ||||||||||||
| Current committed unused capacity (3) | 10.0 | 7.5 | 12.0 | 6.7 | (2.0) | 0.8 | ||||||||||||
| Subtotal | $ | 21.4 | $ | 15.9 | $ | 19.0 | $ | 16.5 | $ | 2.4 | $ | (0.6) | ||||||
| Ally Bank intercompany loan (4) | 2.4 | (2.4) | 3.0 | (3.0) | (0.6) | 0.6 | ||||||||||||
| Total Current Available Liquidity | $ | 23.8 | $ | 13.5 | $ | 22.0 | $ | 13.5 | $ | 1.8 | $ | 0.0 | ||||||
| Forward commited unused capacity (5) | 2.0 | - | 2.5 | - | (0.5) | - | ||||||||||||
| Total Available Liquidity | $ | 25.8 | $ | 13.5 | $ | 24.5 | $ | 13.5 | $ | 1.3 | $ | 0.0 | ||||||
| 2017 and | ||||||||||||||||||
| Unsecured Long-Term Debt Maturity Profile | 2012 | 2013 | 2014 | 2015 | 2016 | After | ||||||||||||
| Consolidated remaining maturities (6) | $ | 9.9 | $ | 2.3 | $ | 5.8 | $ | 4.5 | $ | 1.5 | $ | 20.4 | ||||||
| (1) | Parent defined as Ally Consolidated less Ally Bank, ResCap (deconsolidated as of 05/14/12) and Insurance (not shown) |
| (2) | Includes UST, Agency debt and Agency MBS |
| (3) | Includes equal allocation of shared unused capacity totaling $3.8 billion in 2Q 2012 and $3.8 billion in 1Q 2012 which can be used by Ally Bank or the Parent (including a Mexican subsidiary) |
| (4) | To optimize use of cash and secured facility capacity between entities, Ally Financial lends cash to Ally Bank from time to time under an intercompany loan agreement. Amounts outstanding on this loan are repayable to Ally Financial at any time, subject to 5 days notice |
| (5) | Represents capacity from certain foward purchase commitments and committed secured facilites that are generally reliant upon the origination of future automotive receivables over the next 12 months |
| (6) | Excludes OID amortization |
| 2Q 2012 Preliminary Results | 20 |
|
ALLY FINANCIAL INC. DEPOSITS |
| ($ in millions) | ||||||||||||||||||||
| QUARTERLY TRENDS | CHANGE VS. | |||||||||||||||||||
| Key Statistics | 2Q 12 | 1Q 12 | 4Q 11 | 3Q 11 | 2Q 11 | 1Q 12 | 2Q 11 | |||||||||||||
| Average retail CD maturity (months) | 28.8 | 28.2 | 27.2 | 26.1 | 25.3 | 0.6 | 3.5 | |||||||||||||
| Average retail deposit rate | 1.41% | 1.46% | 1.52% | 1.57% | 1.58% | |||||||||||||||
| CD balances up for renewal | $ | 3,176 | $ | 2,702 | $ | 1,896 | $ | 1,538 | $ | 2,239 | $ | 474 | $ | 937 | ||||||
| CD balances retained (1) | 2,858 | 2,457 | 1,746 | 1,403 | 1,972 | 401 | 886 | |||||||||||||
| Retention rate | 90% | 91% | 92% | 91% | 88% | |||||||||||||||
| Ally Financial Deposits Levels | ||||||||||||||||||||
| Ally Bank retail | $ | 30,404 | $ | 29,323 | $ | 27,685 | $ | 26,254 | $ | 24,562 | $ | 1,081 | $ | 5,842 | ||||||
| Ally Bank brokered | 9,905 | 9,884 | 9,890 | 9,911 | 9,903 | 21 | 2 | |||||||||||||
| ResMor | 3,491 | 3,519 | 3,367 | 3,327 | 3,359 | (28) | 132 | |||||||||||||
| Other | 4,191 | 4,480 | 4,108 | 4,834 | 4,438 | (289) | (247) | |||||||||||||
| Total deposits | $ | 47,991 | $ | 47,206 | $ | 45,050 | $ | 44,326 | $ | 42,262 | $ | 785 | $ | 5,729 | ||||||
| (1) | Retention includes balances retained in any Ally Bank product |
| 2Q 2012 Preliminary Results | 21 |
|
ALLY FINANCIAL INC. ALLY BANK CONSUMER MORTGAGE HFI PORTFOLIO (PERIOD-END) |
($ in billions)
| HISTORICAL QUARTERLY TRENDS | ||||||||||||||
| Loan Value | 2Q 12 | 1Q 12 | 4Q 11 | 3Q 11 | 2Q 11 | |||||||||
| Gross carry value | $ | 9.8 | $ | 9.7 | $ | 9.7 | $ | 9.8 | $ | 9.9 | ||||
| Net carry value | $ | 9.3 | $ | 9.3 | $ | 9.3 | $ | 9.3 | $ | 9.4 | ||||
| Estimated Pool Characteristics | ||||||||||||||
| % Prime jumbo (> 1/1/2009) | 34.5% | 31.2% | 29.1% | 27.0% | 24.9% | |||||||||
| % Second lien | 12.8% | 13.4% | 13.9% | 14.5% | 14.9% | |||||||||
| % Interest only | 25.9% | 29.1% | 30.3% | 31.5% | 33.2% | |||||||||
| % 30+ Day delinquent | 3.2% | 3.3% | 3.3% | 3.3% | 3.4% | |||||||||
| % Low/No documentation | 14.9% | 15.6% | 16.0% | 16.5% | 17.0% | |||||||||
| % Non-primary residence | 3.9% | 3.9% | 4.0% | 4.0% | 4.1% | |||||||||
| Refreshed FICO | 730 | 728 | 730 | 730 | 730 | |||||||||
| Wtd. Avg. LTV/CLTV (1) | 90.4% | 91.8% | 90.7% | 91.2% | 91.9% | |||||||||
| Higher risk geographies (2) | 39.2% | 38.6% | 38.2% | 38.2% | 38.4% | |||||||||
| (1) | Updated home values derived using a combination of appraisals, BPOs, AVMs and MSA level house price indices |
| (2) | Includes CA, FL, MI and AZ |
| 2Q 2012 Preliminary Results | 22 |
|
ALLY FINANCIAL INC. MORTGAGE REPURCHASE OUTSTANDING CLAIMS |
| ($ in millions) | ||||||||||||||
| Mortgage Repurchase Outstanding Claims (1) (2) (3) | 2Q 11 | 3Q 11 | 4Q 11 | 1Q 12 | 2Q 12 | |||||||||
| Beginning balance | $ | 73 | $ | 67 | $ | 68 | $ | 46 | $ | 55 | ||||
| New claims (4) | 105 | 97 | 66 | 87 | 107 | |||||||||
| Rescinded claims | (60) | (58) | (31) | (40) | (31) | |||||||||
| Paid claims | (52) | (27) | (58) | (39) | (49) | |||||||||
| Adjustments | 1 | (11) | 1 | (0) | 1 | |||||||||
| Ending balance | $ | 67 | $ | 68 | $ | 46 | $ | 55 | $ | 82 | ||||
| (1) | Includes demands that Ally has requested to be rescinded but which have not been agreed to by the investor |
| (2) | Represents original UPB of loans and make-whole amounts related to unresolved claims and does not represent expected losses |
| (3) | Presented on a pro-forma basis to reflect claims against Ally Bank serviced loans that were previously the economic obligation of Rescap due to swap arrangement between ResCap and Ally Bank. Ally Bank did not begin recognizing the obligation for paid claims until swap agreement was terminated on May 1, 2012. Actual 2Q original UPB for paid claims by Ally Bank was $28 million |
| (4) | The GSEs implemented a process change in 1Q12 whereby a greater percentage of information requests are submitted as repurchase claims |
| 2Q 2012 Preliminary Results | 23 |
|
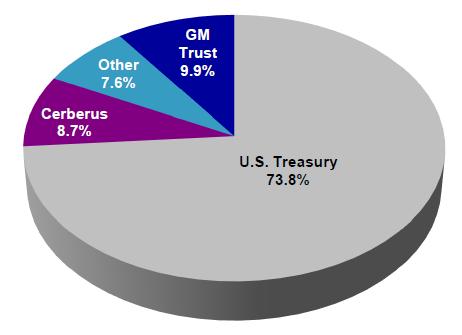
ALLY FINANCIAL INC. OWNERSHIP |
($ in millions)
| Common Ownership as of 2Q 12 |
| Other Tier 1 Capital as of 2Q 12 |
| Liquidation | Book | ||||
| Series | Owner | Preference | Value | ||
| Trust Preferred Securities (1) | Investors | $ | 2,667 | $ | 2,543 |
| Series F-2 Mandatory Convertible Preferred (1) | U.S. Treasury | $ | 5,938 | $ | 5,685 |
| Series G Perpetual Preferred | Investors | $ | 2,577 | $ | 234 |
| Series A Perpetual Preferred | Investors | $ | 1,022 | $ | 1,021 |
| (1) | Includes exercised warrants |
| 2Q 2012 Preliminary Results | 24 |