Attached files
| file | filename |
|---|---|
| 8-K - 8-K - BERKSHIRE HILLS BANCORP INC | a12-17210_18k.htm |
Exhibit 99.1
|
|
KBW's 13th Annual Community Bank Investor Conference July 31 – August 1, 2012 |
|
|
David H. Gonci Investor Relations Officer Dgonci@berkshirebank.com 413-281-1973 Richard M. Marotta Executive Vice President rmarotta@berkshirebank.com 413-236-3753 1 Kevin P. Riley Executive Vice President, CFO Kriley@berkshirebank.com 413-236-3195 Patrick J. Sullivan Executive Vice President psullivan@berkshirebank.com 413-236-3735 |

|
|
2 Experienced Leadership Team Michael P. Daly President and CEO Kevin Riley EVP, CFO Sean Gray EVP, Retail Background Bank of America Consumer Market Executive Background Sovereign EVP Corporate Banking Background KeyBank EVP Group Head Background KeyBank EVP CFO Lawrence A. Bossidy Chairman Background Vice Chair, GE CEO, Allied Signal/Honeywell Patrick Sullivan EVP, Commercial & Wealth Management Robert Curley Chairman of the New York Region Background Citizens Bank, NY President & CEO Citizens Bank, N.A. - Chairman Linda Johnston EVP, Human Resources Background Berkshire Bank Senior Officer Richard Marotta EVP, Risk Management |
|
|
Second Quarter Results $0.47 core EPS; 14% annualized growth 9% annualized organic commercial loan growth 5% annualized organic growth in non-maturity deposits 16% revenue growth compared to linked quarter 3.70% net interest margin (3.64% ex items) 0.94% core ROA; 7.1% core ROE 59% efficiency ratio Note: Please see earnings release for reconciliation of core and GAAP earnings measures. Q2 2012 core earnings were $10.2 million ($0.47 per share) and GAAP earnings were $8.0 million ($0.37 per share). GAAP ROA was 0.73%; GAAP ROE was 5.6%. Net interest margin included 0.06% loan accretion from prepayment of discounted purchased loan. EPS growth is compared to Q4 2011. 3 |
|
|
Third Quarter Guidance $0.49 core EPS; 14% annualized growth 7-9% annualized organic loan growth 4-6% annualized organic deposit growth 9% annualized revenue growth 3.60 – 3.65% net interest margin Flat core non-interest expense Positive operating leverage Improving profitability Note: Guidance is midpoint of estimated ranges. Core EPS growth is based on $0.49 Q3 2012 guidance compared to $0.44 Q4 2011 actual. Revenue and expense growth is compared to prior quarter. 4 |
|
|
Revenue Growth 20%+ Total Annual Growth From Multiple Strategies 5 Quarterly Revenue ($ million) Quarter Note: Revenue in 11Q3 excludes $2 million non-core gain on Legacy stock. |
|
|
Performance Improvement Reducing Operating Cost Metrics Greater Efficiency Quarter Core Non-Interest Expense to Assets (Percent) Quarter Efficiency Ratio (Percent) 6 59.3% |
|
|
Core EPS Growth 20%+ Total Annual Growth Positive Operating Leverage 7 Core EPS (cents) Quarter 47 ¢ |
|
|
Performance Improvement Core Return on Assets Core Return on Equity Quarter Core ROE (Percent) Quarter Core ROA (Basis Points) 8 |
|
|
Berkshire Hills Bancorp Regional bank with over $4.5 billion in assets 68 full service branches in four states: MA, NY, CT and VT Ten commercial and residential lending offices in central/eastern Massachusetts Five additional branches planned with pending Beacon merger Retail and commercial banking, insurance, and wealth management 9 Presence in high value, strong markets – I-90 and I-91 Experienced/energetic management team Market cap recently over $500 million Strong revenue and earnings growth Quality balance sheet |
|
|
Regional Presence 10 Berkshire County, New York, Connecticut, Pioneer Valley and Vermont New lending offices in central and eastern Massachusetts Pending Beacon merger in red; Berkshire branches in green; Berkshire lending offices in blue |
|
|
11 Recent Initiatives Team recruitment drives commercial growth Asset Based Lending Central/Eastern Mass. Commercial Team Consumer Lending – Greenpark Mortgage De novo branching in strong Albany market Five in 2011/2012; bringing Albany area total to 15 M & A Rome and Legacy in 2011 CBT – Connecticut Bank and Trust in Q2 2012 Beacon planned for Q4 2012 Development initiatives Core system conversion Insurance and wealth management reorganization and integration Six Sigma processes |
|
|
12 Market Strengths – New England and Central/Eastern NY Held up better than most regions during recession Less of a bubble developed prior to recession Diversified economy with strong services and technology drivers Continues to be stronger than many regions – latest Fed Beige Book Market positioning opportunity for Berkshire Handful of national competitors with major focus elsewhere Many small community banks without comparable resources Berkshire is centrally positioned with strong resources and responsiveness Growth areas within market Central/eastern Massachusetts Albany Hartford |
|
|
Balance Sheet Strength Favorable Asset Quality Net Loan Charge-Offs Net Charge-Offs/ Average Loans (Percent) Quarter NPAs/ Assets (Basis Points) Quarter 13 |
|
|
Capital Strength Core Return on Tangible Equity Tangible Common Equity / Assets Tangible Common Equity/Assets (Percent) Quarter Percent 14 Quarter Note: Core return on tangible equity is core income before intangible amortization divided by tangible equity. |
|
|
15 Capital Metrics Tangible equity/tangible assets 8.0% Total equity/assets 12.9% Well Capitalized with most regulatory capital consisting of common equity $15.49 tangible equity per share Tangible equity capital generation $2.12 per share based on current run rate 36% dividend payout ratio; 3.1% dividend yield Note: Tangible equity capital generation consists of core earnings plus amortization of intangible assets. Dividend payout ratio based on core earnings. |
|
|
16 Risk Management Disciplines Credit team and culture Portfolio management Underwriting M&A due diligence Workout Project management Merger integration Core systems conversion Risk Committee, Capital Committee |
|
|
M & A Disciplines Earnings accretion goals Manage tangible book value dilution ROE Targets Reasonable cost save objectives Modest reliance on revenue synergies Understanding purchase accounting impact Balancing cash/stock mix for capital impact Improving financial and demographic metrics 17 Note: See discussion on non-GAAP financial measures at end of presentation. |
|
|
Recent M & A History 18 PRO FORMA FINANCIAL DATA WITH MERGERS Actual Pro Forma pre mergers w/mergers ($ millions except per share data) 12/31/10 3/31/12 Assets $ 2,881 $ 5,315 Loans 2,142 3,870 Allowance for loan losses (32) (33) Intangible assets 173 287 Deposits 2,204 4,023 Stockholders' equity 389 638 Shares outstanding (thousands) 14,076 24,957 Tangible equity/tangible assets 8.0% 7.0% Branch offices 42 73 COMBINED MERGER TRANSACTION DATA Price/tangible book value 115% Tang book value/share dilution $ 2.85 Core EPS accretion $ 0.45 TBV accretion (w/amortization) $ 0.63 TBV payback from deal accretion (years) 4.5 TBV payback from total core operations (years) 1.2 Note: Combined merger data includes Rome, Legacy, CBT and Beacon. The Beacon merger is expected to be completed in the fourth quarter of 2012. Pro forma financial data is based on disclosures in form S-4 filed with the SEC on July 3, 2012. Combined merger data is based on pro forma analysis at time of deal announcement. |
|
|
19 Why Invest In Us Experienced executive management team Proven track record for results Strong financial condition Solid strategies for growth and performance Focused on shareholder return Higher market capitalization and stock liquidity due to merger share issuance 100% buy ratings from the equity analysts who cover us |
|
|
FORWARD LOOKING STATEMENTS. This document contains certain forward-looking statements within the meaning of the Private Securities Litigation Reform Act of 1995 about the proposed merger of Berkshire and Beacon. These statements include statements about anticipated financial results and regarding the anticipated closing date of the merger transaction and anticipated future merger results. Forward-looking statements can be identified by the fact that they do not relate strictly to historical or current facts. They often include words like "believe," "expect," "anticipate," "estimate," and "intend" or future or conditional verbs such as "will," "would," "should," "could" or "may." Certain factors that could cause actual results to differ materially from expected results include delays in completing the merger, difficulties in achieving CBT and Beacon cost savings from the mergers or in achieving such cost savings within the expected time frame, difficulties in integrating Berkshire with CBT and Beacon, increased competitive pressures, changes in the interest rate environment, changes in general economic conditions, legislative and regulatory changes that adversely affect the business in which Berkshire and Beacon are engaged, changes in the securities markets and other risks and uncertainties disclosed from time to time in documents that Berkshire files with the Securities and Exchange Commission. ADDITIONAL INFORMATION FOR SHAREHOLDERS. In connection with the proposed merger, Berkshire has filed with the Securities and Exchange Commission (“SEC”) a Registration Statement on Form S-4 that includes a Proxy Statement of Beacon and a Prospectus of Berkshire, as well as other relevant documents concerning the proposed transaction. Stockholders are urged to read the Registration Statement and the Proxy Statement/prospectus regarding the merger and any other relevant documents filed with the SEC, as well as any amendments or supplements to those documents, because they will contain important information. A free copy of the Proxy Statement/Prospectus, as well as other filings containing information about Berkshire Hills and Beacon, may be obtained at the SEC’s Internet site (http://www.sec.gov). You may also obtain these documents, free of charge, from Berkshire Hills Bancorp at www.berkshirebank.com under the tab “Investor Relations”. Berkshire and Beacon and certain of their directors and executive officers may be deemed to be participants in the solicitation of proxies from the stockholders of Beacon Federal Bancorp in connection with the proposed merger. Information about the directors and executive officers of Berkshire Hills Bancorp is set forth in the proxy statement for Berkshire Hills Bancorp’s 2012 annual meeting of stockholders, as filed with the SEC on a Schedule 14A on March 30, 2012. Information about the directors and executive officers of Beacon is set forth in the proxy statement for Beacon Federal Bancorp’s 2012 annual meeting of stockholders, as filed with the SEC on a Schedule 14A on April 16, 2012. Additional information regarding the interests of those participants and other persons who may be deemed participants in the transaction may be obtained by reading the Proxy Statement/Prospectus regarding the proposed merger when it becomes available. Free copies of this document may be obtained as described in the preceding paragraph NON-GAAP FINANCIAL MEASURES. This presentation references non-GAAP financial measures incorporating tangible equity and related measures, and core earnings excluding merger and other non-recurring costs. These measures are commonly used by investors in evaluating business combinations and financial condition. GAAP earnings are lower than core earnings primarily due to non-recurring merger related expenses. Reconciliations are in earnings releases at www.berkshirebank.com. 20 |
|
|
Note: Core results exclude merger, divestiture and restructuring charges after tax totaling $0.4 million in 2010, $10.4 million in 2011, and $5.8 million in H1 2012. GAAP EPS for those periods was $1.00, $0.98, and $0.65 respectively. Core ROTE includes amortization of intangible assets in core return. Financial Performance and Goals 2010 2011 2012 H1 Financial Goals Core revenue growth 9% 31% 45% 10%+ Net interest margin 3.27% 3.57% 3.66% 3.50%+ Fee income/total revenue 28% 24% 24% 35%+ Efficiency ratio 71% 63% 59% 55% Core ROA 0.52% 0.80% 0.94% 1.00%+ Core ROE 3.7% 5.8% 7.0% 10.0%+ Core ROTE 8.3% 12.0% 13.4% 15.0%+ Core EPS $1.02 $1.56 $0.92 $2.00+ Exhibit A 21 |
|
|
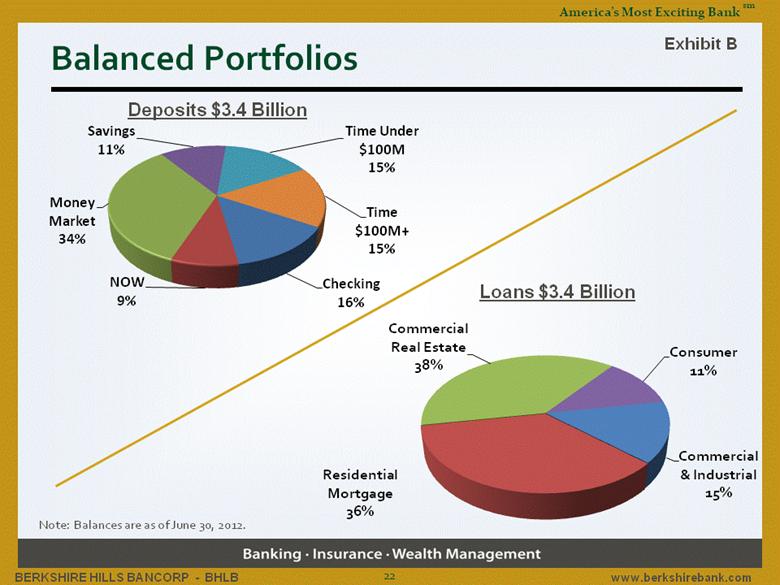
Balanced Portfolios Note: Balances are as of June 30, 2012. Deposits $3.4 Billion Loans $3.4 Billion Exhibit B 22 |
|
|
If you have any questions, please contact: David Gonci P.O. Box 1308 Pittsfield, MA 01202 Investor Relations Officer (413) 281-1973 dgonci@berkshirebank.com Committed to the RIGHT core values: Respect Integrity Guts Having Fun Teamwork |
