Attached files
| file | filename |
|---|---|
| 8-K - FORM 8-K - Allison Transmission Holdings Inc | d387532d8k.htm |
| EX-99.1 - EARNINGS RELEASE DATED JULY 30, 2012 - Allison Transmission Holdings Inc | d387532dex991.htm |
 Q2
2012 Earnings Release July 30, 2012
Lawrence Dewey, Chairman, President & Chief Executive Officer
David Graziosi, Executive Vice President & Chief Financial Officer
Exhibit 99.2 |
 Safe
Harbor Statement 2
The following information contains, or may be deemed to contain, “forward-looking
statements” (as defined in the U.S. Private Securities Litigation Reform Act of
1995). Most forward-looking statements contain words that identify them as
forward-looking, such as “may”, “plan”, “seek”, “will”,
“expect”, “intend”, “estimate”, “anticipate”,
“believe”, “project”, “opportunity”, “target”, “goal”,
“growing” and “continue” or other words that relate to future events, as opposed
to past or current events. By their nature, forward-looking statements are not
statements of historical facts and involve risks and uncertainties because they relate to
events and depend on circumstances that may or may not occur in the future. These
statements give Allison Transmission’s current expectation of future events or its future
performance and do not relate directly to historical or current events or Allison
Transmission’s historical or future performance. As such, Allison
Transmission’s future results may vary from any expectations or goals expressed in, or implied
by, the forward-looking statements included in this presentation, possibly to a material
degree. Allison Transmission cannot assure you that the assumptions made in preparing any of the forward-
looking statements will prove accurate or that any long-term financial goals will be
realized. All forward-looking statements included in this presentation speak only as of the
date made, and Allison Transmission undertakes no obligation to update or revise publicly any
such forward-looking statements, whether as a result of new information, future events, or
otherwise. In particular, Allison Transmission cautions you not to place undue weight on
certain forward-looking statements pertaining to potential growth opportunities,
long-term financial goals or the value we currently ascribe to certain tax attributes set
forth herein. Actual results may vary significantly from these statements. Allison Transmission’s business is subject to numerous risks and uncertainties, which may cause
future results of operations to vary significantly from those presented herein. |
 Non-GAAP Financial Information
3
We use Adjusted net income, Adjusted EBITDA, Adjusted EBITDA margin, adjusted free cash flow and free
cash flow to evaluate our performance relative to that of our peers. In addition, the Senior
Secured Credit Facility has certain covenants that incorporate Adjusted EBITDA. However,
Adjusted net income, Adjusted EBITDA, Adjusted EBITDA margin, adjusted free cash flow and free
cash flow are not measurements of financial performance under GAAP, and these metrics may not
be comparable to similarly titled measures of other companies. Adjusted net income is
calculated as the sum of net income (loss), interest expense, net, income tax expense, trade
name impairment and amortization of intangible assets, less cash interest expense, net and cash income
taxes, and adjusted for certain non-recurring items. Adjusted EBITDA is calculated as the sum of
Adjusted net income, cash interest expense, net, cash income taxes, depreciation of property,
plant and equipment and other adjustments as defined by the Senior Secured Credit Facility and
as further described below. Adjusted EBITDA margin is calculated as Adjusted EBITDA divided by
net sales. Free cash flow is calculated as net cash provided by operating activities less
capital expenditures. Adjusted free cash flow is free cash flow adjusted for non- recurring
items. We use
Adjusted net income to measure our overall profitability because it better reflects our cash flow
generation by capturing the actual cash taxes paid rather than our tax expense as calculated under
GAAP and excludes the impact of the non-cash annual amortization of certain intangible
assets that were created at the time of the Acquisition Transaction. We use Adjusted EBITDA and
Adjusted EBITDA margin to evaluate and control our cash operating costs and to measure our
operating profitability. We use adjusted free cash flow and free cash flow to evaluate the
amount of cash generated by the business that, after the capital investment needed to maintain
and grow our business, can be used for strategic opportunities, including investing in our
business and strengthening our balance sheet. We believe the presentation of Adjusted net income,
Adjusted EBITDA, Adjusted EBITDA margin, adjusted free cash and free cash flow enhances our
investors' overall understanding of the financial performance and cash flow of our business. You should not
consider Adjusted net income, Adjusted EBITDA, Adjusted EBITDA margin, adjusted free cash flow
and free cash flow as an alternative to net income (loss), determined in accordance with GAAP, as an
indicator of operating performance, or as an alternative to net cash provided by operating activities,
determined in accordance with GAAP, as an indicator of Allison’s cash flow. |
 Call
Agenda Q2 2012 Performance
End Markets Commentary
Full Year 2012 Guidance Update
4 |
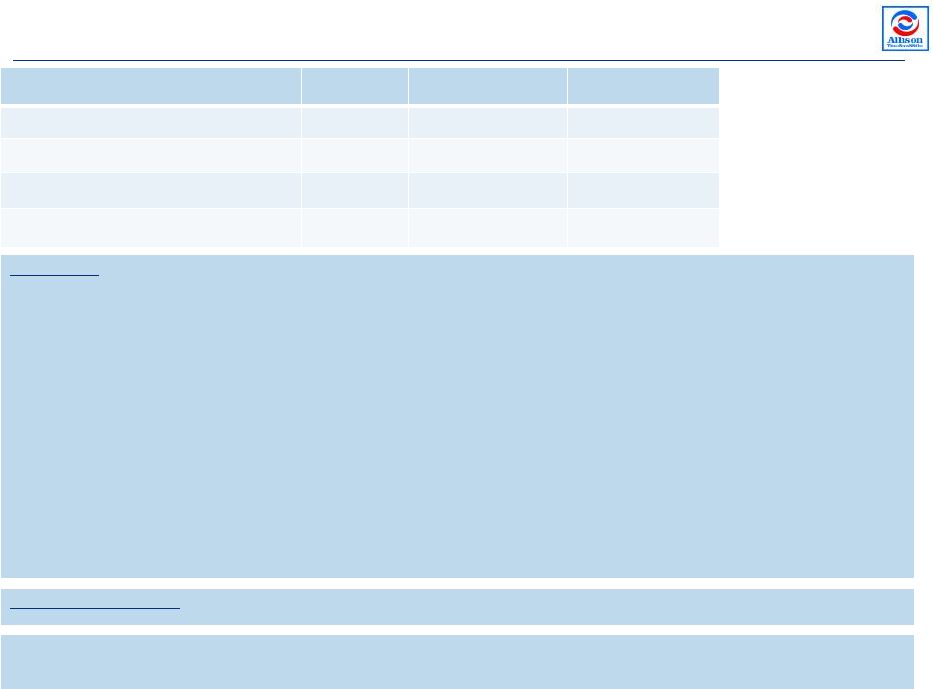 Q2
2012 Performance Summary 5
($ in millions)
Q2 2012
Q2 2011
% Variance
Net Sales
$559
$556
0.7%
Gross Margin %
45.0%
44.0%
+100 bps
Adjusted Net Income
(1)
$87
$11
700.9%
Adjusted
Free
Cash
Flow
(2)(3)
$80
$68
17.6%
Commentary
Net Sales: increased demand for North America On-Highway, Wheeled Military, and
Outside North America Off-Highway products, supported by price increases
on certain products. Growth in these markets was largely offset by decreased demand
in the North America Off-Highway energy sector resulting from weakness in natural
gas pricing and fewer sales of North America Hybrid-Propulsion Systems for
Transit Buses. Our Outside North America On-Highway net sales in the quarter were
in line with the prior year, due to weakness in European end markets largely
offsetting growth in China and Latin America. Gross Margin: price increases on
certain products and improved manufacturing performance partially offset by unfavorable
sales mix.
Adjusted Net Income: 2011 premiums and expenses on tender offer of long-term
debt, increased gross profit, decreased global commercial spending activities,
higher 2011 technology-related license expense and decreased cash interest expense
as
a
result
of
debt
repayments
and
purchases
partially
offset
by
higher
warranty
expense,
increased
product
initiatives
spending and increased other expense, net.
Adjusted Free Cash Flow: increased net cash provided by operating activities
partially offset by increased capital expenditures attributable to the
continued expansion of our India facility which will be completed this year, as well as
increased product initiatives spending and investments in productivity and
replacement programs. (1)
See Appendix for a reconciliation of Adjusted net income (loss).
(2)
Free Cash Flow = Cash provided by Operating Activities less CapEx. See slide 8.
(3)
Adjusted Free Cash Flow = Free Cash Flow less non-recurring items.
Full Year 2012 Guidance: Sales growth of 1 to 3 percent and Adjusted EBITDA margin of
33.5 to 34.0 percent. |
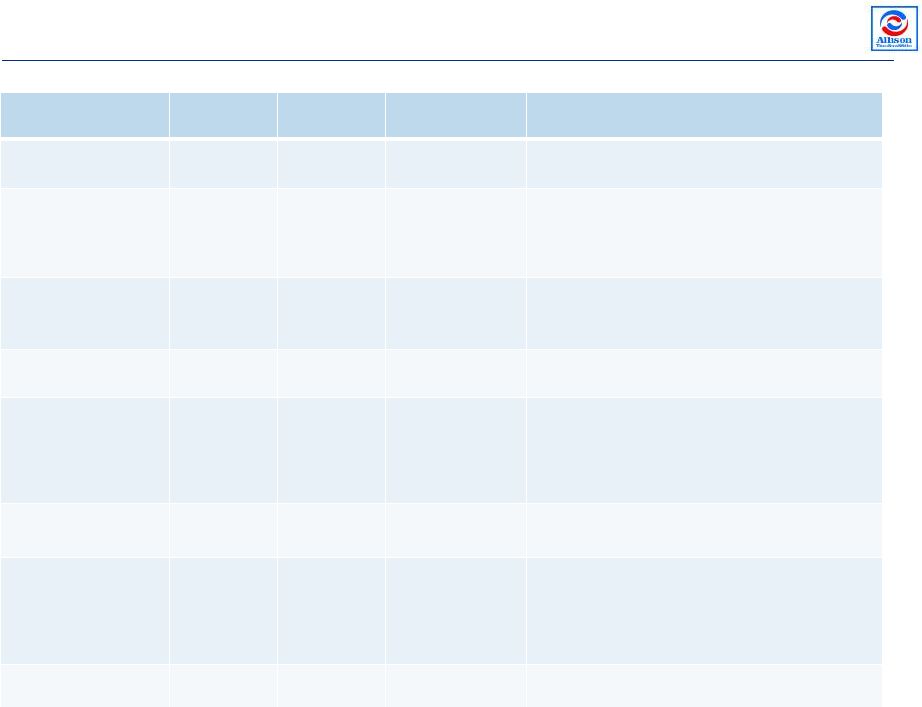 Q2
2012 Sales Performance End Markets
Q2 2012
Q2 2011
% Variance
Commentary
North America On-
Hwy
$217
$189
15%
Continued market recovery
North America
Hybrid-Propulsion
Systems for Transit
Bus
$18
$40
(55%)
Intra-year movements in the timing of orders
North America Off-
Hwy
$44
$70
(37%)
Decreased demand from natural gas fracturing
applications due to weakness in natural gas
pricing
Military
$80
$69
16%
Increased wheeled military products
requirements
Outside North
America On-Hwy
$78
$77
1%
Weakness in European end markets largely
offsetting growth in China and Latin America;
constrained market growth rates resulting from
macro uncertainties and muted economic
growth forecasts
Outside North
America Off-Hwy
$30
$21
43%
Increased demand from the mining and energy
sectors
Service Parts,
Support Equipment
& Other
$92
$90
2%
Price increases, increased transmission unit
volume, increased global on-highway service
parts sales partially offset by decreased global
off-highway service parts sales
Total
$559
$556
1%
6
($ in millions) |
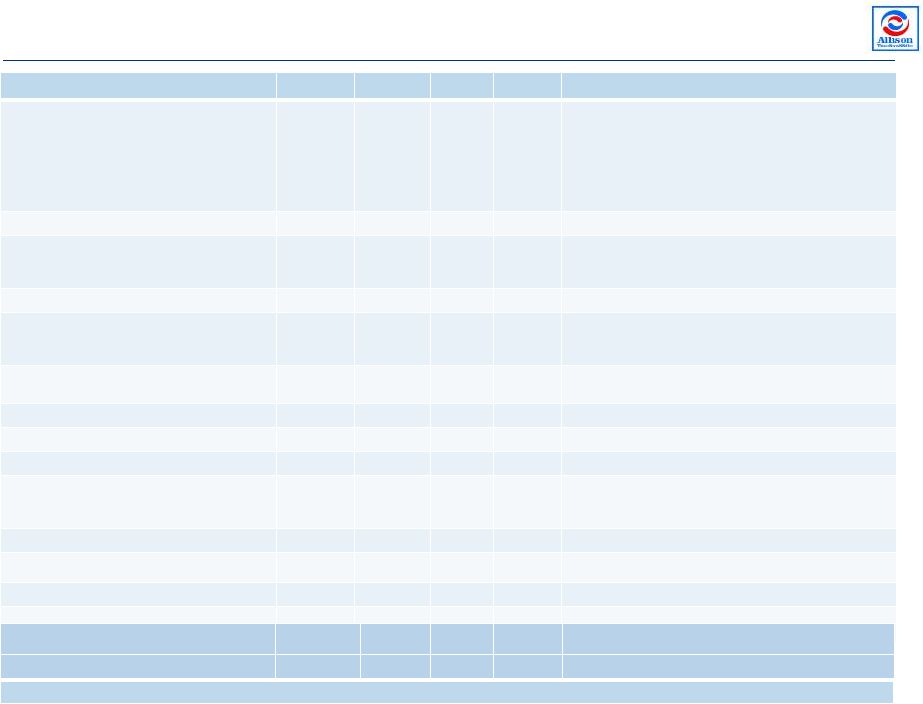 Q2
2012 Financial Performance 7
($ in millions)
Q2 2012
Q2 2011
$ Var
% Var
Commentary
Net Sales
$559.4
$555.7
$3.7
0.7%
Increases in NAFTA On-Highway, Wheeled Military,
Outside NAFTA Off-Highway products, supported by price
increases; Growth largely offset by NAFTA Off-Highway
energy sector and fewer sales of North America Hybrid-
Propulsion Systems for Transit Buses; Outside North
America On-Highway weakness in European end markets
largely offsetting growth in China and Latin America
Cost of Sales
$307.5
$311.2
$3.7
1.2%
Gross Profit
$251.9
$244.5
$7.4
3.0%
Price increases on certain products and improved
manufacturing performance partially offset by unfavorable
sales mix
Operating Expenses
Selling, general and administrative expenses
$109.1
$96.7
($12.4)
(12.8%)
Warranty charge for dual power inverter module extended
coverage and favorable 2011 warranty adjustments
partially offset by decreased global commercial initiatives
Engineering –
research and development
$23.2
$28.2
$5.0
17.7%
Higher 2011 technology-related license expense partially
offset by increased product initiatives spending
Total operating expenses
$132.3
$124.9
($7.4)
(5.9%)
Operating Income
$119.6
$119.6
$0.0
0.0%
Interest Expense, net
($34.1)
($71.0)
$36.9
52.0%
Debt repayments and repurchases
Other Expense, net
($22.8)
($59.8)
$37.0
61.9%
2011 debt retirement partially offset by impairment of
technology-related investments and increased
miscellaneous expenses, net
Income (Loss) Before Income Taxes
$62.7
($11.2)
$73.9
659.8%
Income Tax Benefit (Expense)
$350.1
($6.0)
$356.1
N/A
Release of deferred tax asset valuation allowance
Net Income (Loss)
$412.8
($17.2)
$430.0
N/A
Diluted Earnings (Loss) Per Share
$2.21
($0.09)
$2.30
N/A
Q2 2012: 186.4M shares; Q2 2011: 181.4M shares;
(1)
See Appendix for a reconciliation from net income (loss).
Memo: Adjusted EBITDA
(1)
$190.7
$193.0
($2.3)
(1.2%)
Adjusted Net Income
(1)
$86.5
$10.8
$75.7
700.9% |
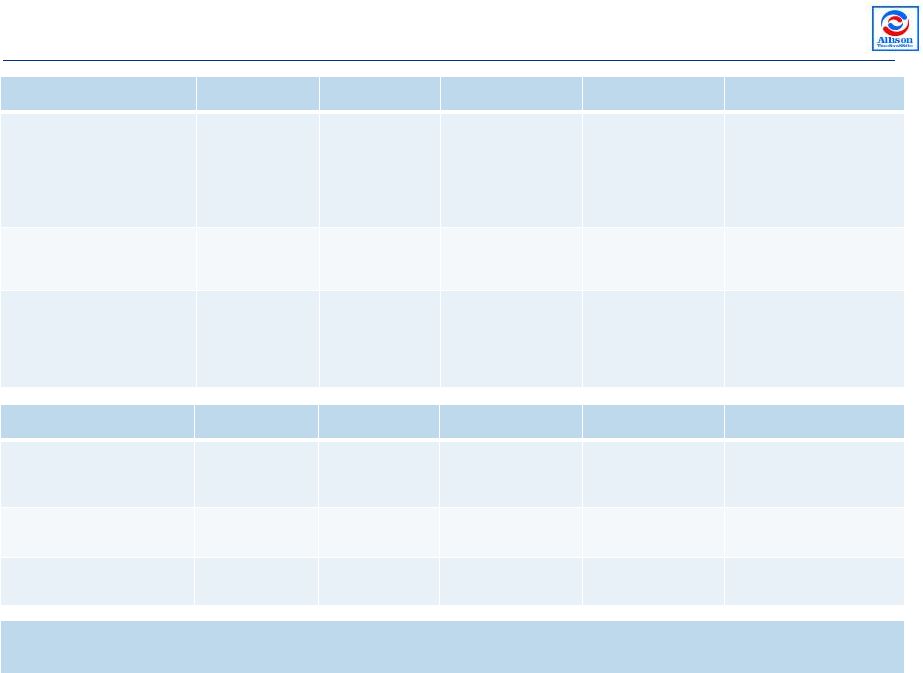 Q2
2012 Cash Flow Performance 8
($ in millions)
Q2 2012
Q2 2011
$ Variance
% Variance
Commentary
Cash Provided by
Operating Activities
$107
$84
$23
27.4%
Increased net income
adjusted for items not
providing or using,
lower operating working
capital and higher other
liabilities, net
CapEx
$27
$16
$11
68.8%
Increased investments
in new facilities and
product initiatives
Free Cash Flow
(1)
and
Adjusted Free Cash
Flow
(2)
$80
$68
$12
17.6%
Increased net cash
provided by operating
activities partially offset
by increased capital
expenditures
($ in millions)
Q2 2012
Q2 2011
$ Variance
% Variance
Commentary
Operating Working
Capital Percentage of
LTM Sales
(3)
9.6%
11.0%
N/A
(140 bps)
LTM net sales growth
and Q2 2011 delayed
A/R collection
Cash Paid for Interest
$53
$85
$32
37.6%
Debt repayments and
repurchases
Cash Paid for Income
Taxes
$4
$2
$2
100.0%
Increased pretax income
(1)
Free Cash Flow = Cash Provided by Operating Activities less CapEx.
(2)
Adjusted Free Cash Flow = Free Cash Flow less non recurring activities
(3)
Operating Working Capital = A/R + Inventory –
A/P. |
 End
Markets Commentary 9
•
North America On-Highway
•
Continued market recovery muted by heightened economic uncertainty
•
Expect slower second half year over year growth rate given diminished commercial
vehicle production forecasts •
North America Hybrid-Propulsion Systems for Transit Bus
•
Municipal spending constraints and value proposition challenges
•
Expect second half quarterly levels above second quarter with full year 2012 below
2011 •
North America Off-Highway
•
Majority of demand is natural gas fracturing
•
Expect second quarter level is more reflective of anticipated second half quarterly
demand •
Military
•
Wheeled volume stronger than anticipated; expect second half of 2012 below
2011 •
Outside North America On-Highway
•
Continued growth initiatives and attainment of vehicle releases
•
Heightened macro economic uncertainties pressuring commercial vehicle production
forecasts •
Expect
second
half
of
2012
in
line
with
2011
due
to
increases
in
emerging
markets
offsetting
continued
weakness
in European end markets
•
Outside North America Off-Highway
•
Continued growth in mining and energy sectors
•
Expect slower second half year over year growth rate
•
Service Parts, Support Equipment & Other
•
Follow global economic conditions and transmission unit volume; expect second half
of 2012 in line with 2011 |
 Full Year 2012 Guidance Update
10
Guidance
Commentary on Full Year
Net Sales Growth from 2011
1 to 3 percent
Assumes year over year net sales growth in
Global On-Highway, Outside North America Off-
Highway and Service Parts, Support Equipment &
Other end markets partially offset by year over
year net sales reductions in the North America
Off-Highway, Military and North America Hybrid-
Propulsion Systems for Transit Bus end markets
Adjusted EBITDA %
(1)
33.5 to 34.0 percent
Driven by sales mix and volume timing
Adjusted Free Cash Flow ($ in
millions)
(2)(3)
$350 to $375
Driven by EBITDA, Cash Interest, Cash Income
Taxes, CapEx, etc
CapEx
($ in millions)
Maintenance
New Facilities
New Product Programs
$55 to $60
$25 to $30
$35 to $40
Product programs subject to timely completion of
development and sourcing milestones
Cash Income Taxes ($ in
millions)
$10 to $15
U.S. income tax shield and net operating loss
utilization
(1)
See Appendix
(2)
Free Cash Flow = Cash Provided by Operating Activities less CapEx
(3)
Adjusted Free Cash Flow = Free Cash Flow less non recurring activities
|
 11
APPENDIX
Non-GAAP Financial Information |
 Non-GAAP Reconciliations
(1 of 2)
Adjusted Net Income and Adjusted EBITDA reconciliation
(1) Includes charges or income related to legacy employee benefits, shared income
with General Motors, benefit plan adjustments, transitional costs to establish
Allison as a stand-alone entity, pension curtailment adjustments, employee
stock compensation expense, service fees paid to Allison’s Sponsors and an
adjustment for the settlement of litigation which originated with the Predecessor
but was assumed by the Company as part of the Acquisition Transaction.
12
$ in millions
Last twelve months
ended June 30,
2009
2010
2011
2011
2012
2012
Net (loss) income
($323.9)
$29.6
$103.0
($17.2)
$412.8
$554.1
plus:
Interest expense,
net
234.2
277.5
217.3
71.0
34.1
171.5
Cash interest expense,
net
(242.5)
(239.1)
(208.6)
(84.9)
(52.7)
(182.6)
Income tax
expense
41.4
53.7
47.6
6.0
(350.1)
(301.3)
Cash income
taxes
(5.5)
(2.2)
(5.8)
(2.1)
(3.5)
(8.5)
Fee to terminate services agreement with Sponsors
—
—
—
—
0.0
16.0
Technology-related investment expense
—
—
—
—
8.0
8.0
Initial public offering expenses
—
—
—
—
0.4
6.1
Trade name
impairment
190.0
—
—
—
—
—
Amortization of intangible
assets
155.9
154.2
151.9
38.0
37.5
150.9
Adjusted net
income
$49.6
$273.7
$305.4
$10.8
$86.5
$414.2
Cash interest expense,
net
242.5
239.1
208.6
84.9
52.7
182.6
Cash income
taxes
5.5
2.2
5.8
2.1
3.5
8.5
Depreciation of property, plant and equipment
105.9
99.6
103.8
25.8
25.2
102.2
(Gain)/Loss on repurchases of long-term debt
(8.9)
(3.3)
16.0
8.3
7.6
28.8
Dual power inverter module extended coverage
11.4
(1.9)
—
—
9.4
9.4
Unrealized (gain) loss on hedge contracts
(5.8)
0.1
6.8
2.6
1.7
6.8
Premiums and expenses on tender offer of long-term debt
—
—
56.9
56.9
—
0.0
Restructuring charges
47.9
—
—
0.6
—
(0.6)
Reduction of supply contract liability
—
(3.4)
—
—
—
—
Other, net
(1)
53.2
10.9
8.6
1.0
4.1
11.5
Adjusted
EBITDA
$501.3
$617.0
$711.9
$193.0
$190.7
$763.4
Net
sales
$1,766.7
$1,926.3
$2,162.8
$555.7
$559.4
$2,251.4
Adjusted EBITDA
margin
28.4%
32.0%
32.9%
34.7%
34.1%
33.9%
For the year ended December 31,
Three months ended
June 30, |
 $ in millions
Last twelve
months ended
June 30,
2009
2010
2011
2011
2012
2012
Net Cash Provided by Operating Activities
$168.7
$388.9
$469.2
$83.8
$106.9
$522.0
(Deductions) or Additions:
Long-lived assets
(88.2)
(73.8)
(96.9)
(16.0)
(26.8)
(131.8)
Fee to terminate services agreement with Sponsors
—
—
—
—
—
16.0
Non-Recurring Activity
(1)
61.0
—
—
—
—
—
Adjusted Free Cash Flow
$141.5
$315.1
$372.3
$67.8
$80.1
$406.2
Net
Sales
$1,766.7
$1,926.3
$2,162.8
$555.7
$559.4
$2,251.4
Adjusted Free Cash Flow (% to Net Sales)
8.0%
16.4%
17.2%
12.2%
14.3%
18.0%
Three months ended
June 30,
For the year ended December 31,
Adjusted Free Cash Flow reconciliation
Non-GAAP Reconciliations
(2 of 2)
13
(1)
2009 adjusted for certain non-recurring activity: (a) capitalized accrued interest on Senior
Toggle Notes ($29) million, (b) cash restructuring charge $51 million, (c) accounts payable
early payments $3 million, (d) delayed accounts receivable receipts $19 million and (e) Lehman LIBOR swap settlement $17
million. |