Attached files
| file | filename |
|---|---|
| 8-K - FORM 8-K - LyondellBasell Industries N.V. | d385423d8k.htm |
| EX-99.1 - PRESS RELEASE - LyondellBasell Industries N.V. | d385423dex991.htm |
 Jim
Gallogly, Chief Executive Officer Karyn Ovelmen, Chief Financial Officer
Sergey
Vasnetsov,
SVP
-
Strategic
Planning
and
Transactions
Doug
Pike,
VP
-
Investor
Relations
July 27, 2012
Second-Quarter 2012 Earnings
Exhibit 99.2 |
 lyondellbasell.com
Cautionary Statement
The information in this presentation includes forward-looking statements. These
statements relate to future events, such as anticipated revenues, earnings,
business strategies, competitive position or other aspects of our operations
or operating results. Actual outcomes and results may differ materially from
what is expressed or forecast in such forward-looking statements. These statements are not guarantees
of future performance and involve certain risks, uncertainties and assumptions that
are difficult to predict. Factors that could cause actual results to
differ from forward-looking statements include, but are not limited to,
availability, cost and price volatility of raw materials and utilities; supply/demand balances;
industry production capacities and operating rates; uncertainties associated with
worldwide economies; legal,
tax
and
environmental
proceedings;
cyclical
nature
of
the
chemical
and
refining
industries;
operating interruptions; current and potential governmental regulatory actions;
terrorist acts; international political unrest; competitive products and
pricing; technological developments; the ability to comply with the terms of
our credit facilities and other financing arrangements; the ability to implement business
strategies;
and
other
factors
affecting
our
business
generally
as
set
forth
in
the
“Risk
Factors”
section
of
our Form 10-K for the year ended December 31, 2011, which can be found at
www.lyondellbasell.com on the Investor Relations page and on the Securities
and Exchange Commission’s website at www.sec.gov. This presentation
contains time sensitive information that is accurate only as of the date hereof.
Information contained in this presentation is unaudited and is subject to
change. We undertake no obligation to update the information presented
herein except as required by law. 2 |
 lyondellbasell.com
Information Related to Financial Measures
3
We have included EBITDA in this presentation, which is a non-GAAP measure, as we believe that
EBITDA is a measure commonly used by investors. However, EBITDA, as presented herein, may not
be comparable to a similarly titled measure reported by other companies due to differences in
the way the measure is calculated. For purposes of this presentation, EBITDA means earnings
before interest, taxes, depreciation and amortization, as adjusted for other items management
does not believe are indicative of the Company’s underlying results of operations such as
impairment charges, reorganization items, the effect of mark-to-market accounting on our
warrants. EBITDA also includes dividends from joint venture EBITDA should not be considered an
alternative to profit or operating profit for any period as an indicator of our performance, or
as an alternative to operating cash flows as a measure of our liquidity. See Table 9 of
our accompanying earnings release for reconciliations of EBITDA to net income.
While we also believe that net debt is a measure commonly used by investors, net debt, as presented
herein, may not be comparable to a similarly titled measure reported by other companies due to
differences in the way the measure is calculated. For purposes of this presentation, net debt
means short-term debt plus current maturities of long-term debt plus long-term debt
minus cash and cash equivalents and minus restricted cash. |
 lyondellbasell.com
500
1,000
1,500
$2,000
1Q'11
2Q'11
3Q'11
4Q'11
1Q'12
2Q'12
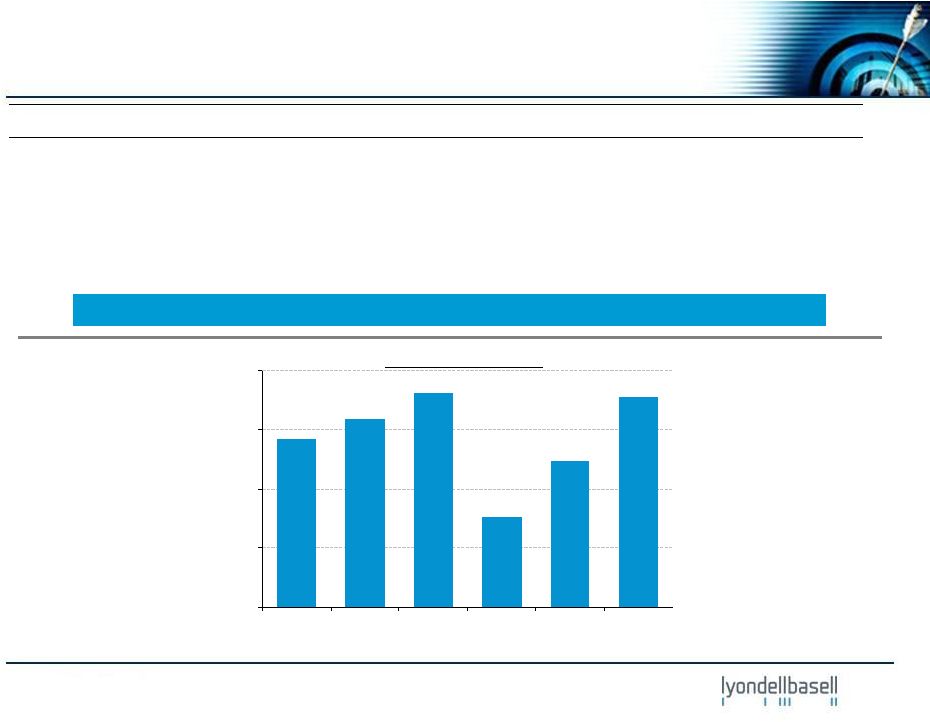
Highlights
Quarterly
EBITDA
Quarterly EBITDA increase of 44% from 1Q’12
($ in millions)
4
2Q'12
1Q'12
2Q'11
EBITDA
$1,774
$1,228
$1,593
Income from Continuing Operations
$768
$594
$851
Diluted Earnings ($ / share) from Continuing Operations
$1.33
$1.03
$1.46
Net Debt / LTM EBITDA
0.4x
0.4x
NA
(1) EBITDA, Income and EPS for the second quarter 2012 reflect a $71million Lower of Cost or Market
inventory valuation adjustment charge. Discontinued operations had no impact on the second
quarter 2012 earnings.
($ in millions, except per share
data)
(1) |
 lyondellbasell.com
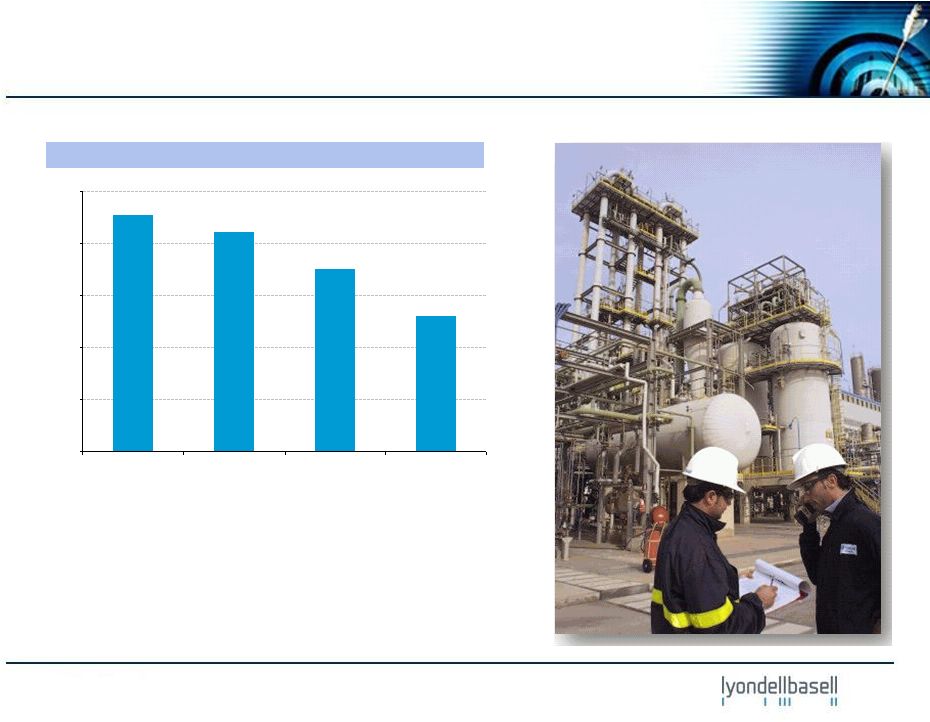
LyondellBasell Safety Performance
•
Continued good safety results
•
Significant first half 2012 contractor
activity related to maintenance
turnarounds
Injuries per 200,000 Hours Worked
(1)
1) Includes employees and contractors. YTD as of June 2012.
5
0.0
0.1
0.2
0.3
0.4
0.5
2009
2010
2011
2012 YTD |
 lyondellbasell.com
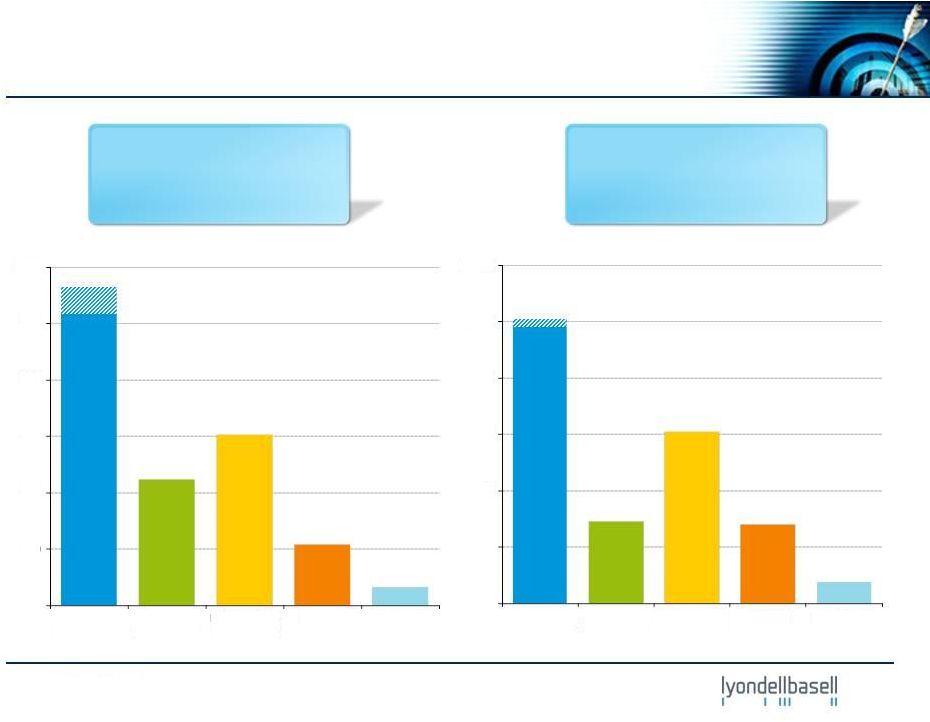
June 2012 LTM EBITDA
Second-Quarter 2012 and Last-Twelve-Months (LTM)
Segment EBITDA
Second-Quarter 2012 EBITDA
($ in millions)
($ in millions)
6
Q2’12
EBITDA
(1)
$1,774 million
Q2’12 Operating Income
$1,449 million
LTM
June
EBITDA
(1)
$5,574 million
LTM Operating Income
$4,321 million
150
300
450
600
750
$900
Olefins &
Polyolefins -
Americas
Olefins &
Polyolefins -
EAI
Intermediates
& Derivatives
Refining
Technology
500
1,000
1,500
2,000
2,500
$3,000
Olefins &
Polyolefins -
Americas
Olefins &
Polyolefins -
EAI
Intermediates
& Derivatives
Refining
Technology
1) Shaded area reflects add back of $71 million Lower of Cost or Market inventory valuation
adjustment charge in O&P Americas |
 lyondellbasell.com
$4,937
$1,964
0
2,500
5,000
7,500
$10,000
Q3'11
Begin.
Cash
Balance
CF from
Operations
excl.
Working
Capital
Working
Capital
Changes
Capex
Dividends
Net Debt
Repayment
Other
Q2'12
Ending
Cash
Balance
$1,679
$1,964
0
750
1,500
2,250
$3,000
Cash Flow
1) Beginning and ending cash balance includes cash, cash equivalents and restricted
cash. 2)
Includes inventories, accounts payable and accounts receivable.
3) Includes capital and maintenance turnaround spending.
(3)
(2)
(1)
($ in millions)
Second-Quarter 2012
LTM June 2012
7
(1)
(2)
(1)
(3)
(1)
Q2'12
Beginning
Cash
Balance
CF from
Operations
excl.
Working
Capital
Working
Capital
Changes
Capex
Dividends
Net Debt
Repayment
Other
Q2'12
Ending
Cash
Balance |
 lyondellbasell.com
Working Capital and Key Financials Statistics
1) Figures depicted represent end of quarter balances.
($ in billions)
Working
Capital
(1)
Key Statistics
8
($6)
($4)
($2)
$0
$2
$4
$6
$8
2Q'11
3Q'11
4Q'11
1Q'12
2Q'12
Total WC
Inventory
AR
AP
Snapshot at June 30, 2012
Liquidity: $4.4 billion
Debt: $4.4 billion
Cash: $2.0 billion
Net Debt/LTM EBITDA: 0.4x |
 lyondellbasell.com
(10)
0
10
20
30
40
50
Ethane Margin
Naphtha Margin
HDPE Margin
Ethylene/HDPE Chain
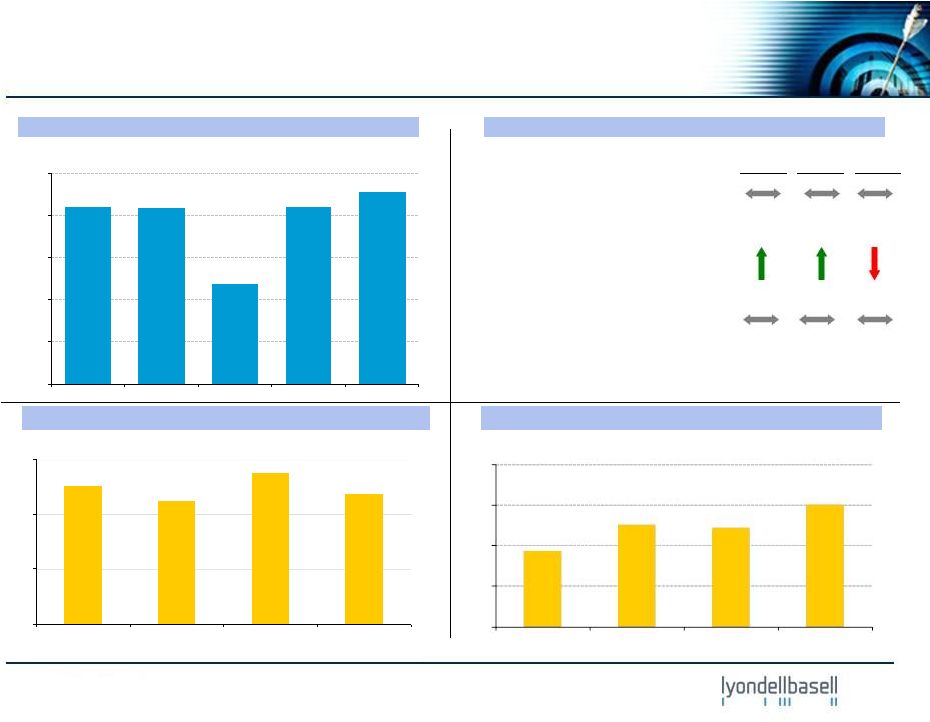
Olefins & Polyolefins -
Americas
Highlights and Business Drivers -
2Q’12
U.S. Olefins
•
Ethylene price down 6¢/lb
•
Cost of Ethylene down 13¢/lb
•
~85% of ethylene from NGLs
•
Hurricane Ike insurance settlement
•
Channelview turnaround completed
Polyethylene
•
Spread up 3¢/lb
Polypropylene (includes Catalloy)
•
Modest margin improvement
Ethylene Chain Margins (per IHS)
EBITDA
(1)
Performance vs. 1Q’12
Polypropylene Margins (per IHS)
EBITDA
Margin
Volume
($ in millions)
(cents / lb)
(cents / lb)
2Q’11
1Q’12
2Q’12
July-12
0
200
400
600
800
$1,000
2Q'11
3Q'11
4Q'11
1Q'12
2Q'12
9
0
1
2
3
4
2Q'11
1Q'12
2Q'12
Jul'12
1) Shaded area refers to $71million Lower of Cost or Market adjustment (LCM)
|
 lyondellbasell.com
Olefins Benchmark Margins
U.S. Gulf Coast Ethylene Margin
(cents/lb)
Source: IHS.
10
0
15
30
45
60
Jul-11
Aug-11
Sep-11
Oct-11
Nov-11
Dec-11
Jan-12
Feb-12
Mar-12
Apr-12
May-12
Jun-12
Jul-12
Spot
Contract
40
60
80
100
120
Jan-12
Feb-12
Mar-12
Apr-12
May-12
Jun-12
Jul-12
Brent
Ethane
Propane
Butane
0
10
20
30
40
50
60
70
NE Asia Naphtha
U.S. Naphtha
U.S. Propane
U.S. Ethane
2Q11
1Q12
2Q12
Indexed Commodity Prices
Cost of Ethylene Production
(cents/lb) |
 lyondellbasell.com
Ethane and Propane Production and Inventories at
Historic Highs
U.S. Ethane Production
U.S. Propane Production
U.S. Ethane Inventory
U.S. Propane Inventory
Source: EIA.
11
400
600
800
1,000
1,200
Jan
Feb
Mar
Apr
May
Jun
Jul
Aug
Sep
Oct
Nov
Dec
0
10
20
30
40
Jan
Feb
Mar
Apr
May
Jun
Jul
Aug
Sep
Oct
Nov
Dec
400
500
600
700
800
Jan
Feb
Mar
Apr
May
Jun
Jul
Aug
Sep
Oct
Nov
Dec
0
20
40
60
80
Jan
Feb
Mar
Apr
May
Jun
Jul
Aug
Sep
Oct
Nov
Dec
2007 -
2011 Range
2011
2012 |
 lyondellbasell.com
(10)
0
10
20
30
40
50
2Q'11
1Q'12
2Q'12
Jul' 12
HDPE Margin
Naphtha Margin
Ethylene/HDPE Chain
Olefins & Polyolefins -
Europe, Asia, International
Highlights and Business Drivers -
2Q’12
EU Olefins
•
Margin expansion for light Olefins and
butadiene
Polyethylene
•
Volumes down 14%
Polypropylene (includes Catalloy)
•
Modest margin improvement
•
Volume down 13%
JV dividends
•
Due to timing
European Ethylene Chain Margins (per IHS)
EBITDA
Performance vs. 1Q’12
European Polypropylene Margins (per IHS)
EBITDA
Margin
Volume
($ in millions)
(cents / lb)
(cents / lb)
100
200
300
$400
2Q'11
3Q'11
4Q'11
1Q'12
2Q'12
12
(6)
(4)
(2)
0
2
2Q'11
1Q'12
2Q'12
Jul' 12 |
 lyondellbasell.com
0
15
30
45
2Q11
1Q12
2Q12
3Q12 E
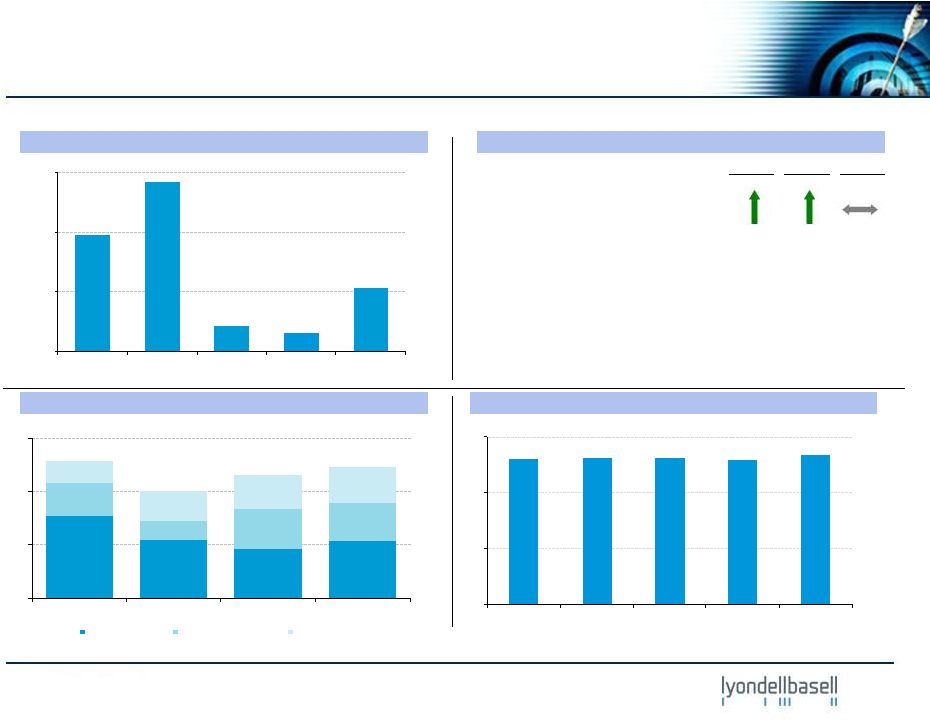
Intermediates & Derivatives
Highlights and Business Drivers -
2Q’12
EBITDA
Propylene Oxide and Derivatives
•
Steady underlying businesses results
•
First China JV dividend
Intermediates
•
Improved PO co-products margins
Oxyfuels
EBITDA
Margin
Volume
Performance vs. 1Q’12
($ in millions)
13
EU MTBE Raw Material Margins (per Platts)
P-Glycol Raw Material Margins (per Chemdata)
(cents / lb)
100
200
300
400
$500
2Q'11
3Q'11
4Q'11
1Q'12
2Q'12
0
50
100
150
200
2Q'11
1Q'12
2Q'12
Jul' 12
(cents / gallon)
Hurricane Ike Insurance Setllement |
 lyondellbasell.com
Refining Highlights and Business Drivers -
2Q’12
Houston Refinery
•
Q2 crude throughput: 267 MBPD
•
Maya 2-1-1: $23.16/ bbl
•
Hurricane Ike insurance settlement
Refining Spreads (per Platts)
(1)
EBITDA
Performance vs. 1Q’12
EBITDA
Margin
Volume
($ in millions)
($ / bbl)
1) Light Louisiana Sweet (LLS) is the referenced light crude.
14
0
10
20
30
2Q'11
1Q'12
2Q'12
Jul'12
Lt-Hvy
Lt-Gasoline
Lt-Heating Oil
HRO Operating Rate
0
100
200
300
2Q'11
3Q'11
4Q'11
1Q'12
2Q'12
150
300
$450
2Q'11
3Q'11
4Q'11
1Q'12
2Q'12
(MBPD)
Berre refinery discontinued operations |
 lyondellbasell.com
Second-Quarter Summary and Outlook
15
–
O&P Americas chain margin remains
advantaged
–
European olefins/polyolefins weaken,
consistent with EU economic
uncertainties, while differentiated
businesses continue to perform
–
Intermediates & Derivatives remain
steady
–
Projects are progressing as
scheduled
–
Strong Olefins results
•
Feedstock cost decline outpaced
price declines
•
Continued U.S. NGL advantage
–
Channelview turnaround complete
–
Steady results in Intermediates and
Derivatives, including Oxyfuels
–
Closed debt refinancing
–
Interim quarterly dividend increased
to 40 cents per share
Second-Quarter Summary
Near-Term Outlook |