Attached files
| file | filename |
|---|---|
| EX-99.1 - EXHIBIT 99.1 - Colfax CORP | v319541_ex99-1.htm |
| 8-K - 8-K CURRENT REPORT - Colfax CORP | v319541_8k.htm |

Second Quarter 2012 Earnings Conference Call July 27, 2012

2 The following information contains forward - looking statements, including forward - looking statements within the meaning of the Private Securities Litigation Reform Act of 1995. Such forward - looking statements include, but are not limited to, statements concerning Colfax's plans, objectives, expectations and intentions and other statements that are not historical or current facts. Forward - looking statements are based on Colfax's current expectations and involve risks and uncertainties that could cause actual results to differ materially from those expressed or implied in such forward - looking statements. Factors that could cause Colfax's results to differ materially from current expectations include, but are not limited to, factors detailed in Colfax's reports filed with the U.S. Securities and Exchange Commission including its 2011 Annual Report on Form 10 - K under the caption “Risk Factors”. In addition, these statements are based on a number of assumptions that are subject to change. This presentation speaks only as of this date. Colfax disclaims any duty to update the information herein. Forward - Looking Statements

3 3 Q2 2012 Results

4 Q2 2012 Highlights • Adjusted net income of $43.1 million ($0.35 per share) compared to $12.8 million ($0.29 per share) in Q2 2011 • Net sales of $1.05 billion, an increase of 2.4% from Q2 2011 proforma net sales of $1.02 billion • Adjusted operating income of $97.3 million compared to $20.3 million in Q2 2011 • Second quarter gas - and fluid - handling orders of $534.4 million compared to proforma orders of $522.5 million in Q2 2011, an increase of 2.3%; organic increase of 7.2% • Gas - and fluid - handling backlog of $1.4 billion at period end, an increase of 3.9%; organic increase of 8.3% 4

5 Year to Date 2012 Highlights • Adjusted net income of $68.6 million ($0.59 per share) compared to $22.0 million ($0.50 per share) in Q2 2011 • Net sales of $1.93 billion, an increase of 6.3% from the six months ended July 1, 2011 proforma net sales of $1.82 billion • Adjusted operating income of $160.6 million compared to $35.6 million in Q2 2011 • Gas - and fluid - handling orders of $1.03 billion compared to proforma orders of $974.4 million in Q2 2011, an increase of 5.9%; organic increase of 2.7% 5
6 6 Gas - and Fluid - Handling

7 Gas - and Fluid - Handling Q2 2012 Highlights • Net sales of $496.5 million compared to proforma net sales of $460.8 million in Q2 2011, an increase of 7.7% • Adjusted segment operating income of $62.8 million and adjusted segment operating income margin of 12.6% • Q2 2012 orders of $534.4 million compared to proforma orders of $522.5 million in Q2 2011, an increase of 2.3%; organic increase of 7.2% • Backlog of $1.39 billion at period end 7

8 Gas - and Fluid - Handling YTD 2012 Highlights • Net sales of $921.8 million compared to proforma net sales of $803.8 million in Q2 2011, an increase of 14.7% • Adjusted segment operating income of $101.6 million and adjusted segment operating income margin of 11.0% • Orders of $1.03 billion compared to proforma orders of $974.4 million in the six months ended July 1, 2011, an increase of 5.9%; organic increase of 2.7% 8

9 Orders and Backlog 9 Orders (1) $522.5 $534.5 $974.4 $1,031.9 $0.0 $100.0 $200.0 $300.0 $400.0 $500.0 $600.0 $700.0 $800.0 $900.0 $1,000.0 $1,100.0 Q2 2011 Q2 2012 YTD 2011 YTD 2012 Backlog (1) $0.0 $250.0 $500.0 $750.0 $1,000.0 $1,250.0 $1,500.0 (1) Order and backlog data for the periods prior to Q2 2012 are presented on a proforma basis. __________________ Note: Dollars in millions (unaudited). QTD YTD Existing Businesses 7.2 % 2.7 % Acquisitions 1.4 % 7.6 % FX Translation (6.3)% (4.4)% Total Growth 2.3 % 5.9 % $1.34B $1.31B $1.39B

10 Revenue 10 Revenue (1) $460.8 $496.5 $803.8 $921.8 $0.0 $100.0 $200.0 $300.0 $400.0 $500.0 $600.0 $700.0 $800.0 $900.0 $1,000.0 Q2 2011 Q2 2012 YTD 2011 YTD 2012 (1) Q2 2011 and YTD 2011 sales are presented on a proforma basis. __________________ Note: Dollars in millions (unaudited). Aftermarket Revenue – YTD 2012 Foremarket 69% Aftermarket 31% Geographic Exposure – YTD 2012 Developed Economies 54% Emerging Markets 46% QTD YTD Existing Businesses 12.8 % 14.3 % Acquisitions 1.5 % 5.1 % FX Translation (6.6)% (4.7)% Total Growth 7.7 % 14.7 %
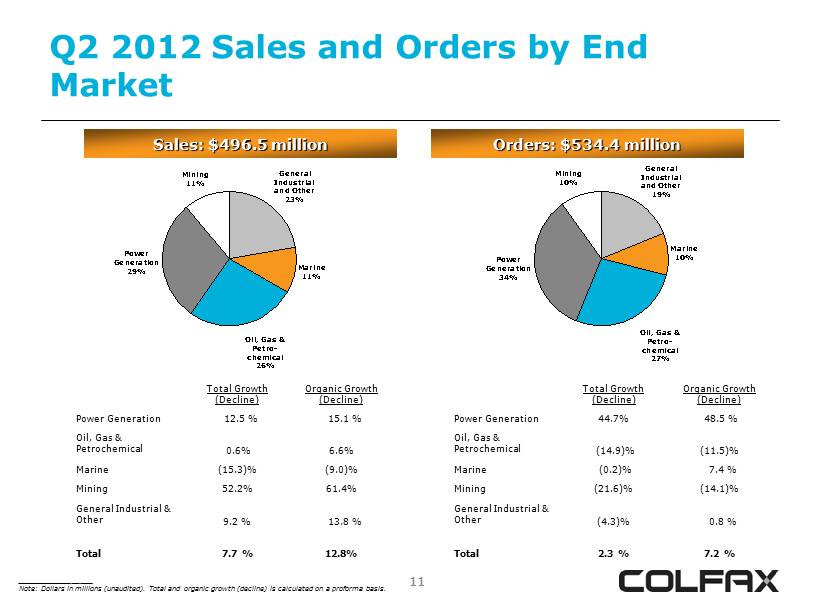
11 Q2 2012 Sales and Orders by End Market 11 Sales: $496.5 million Orders: $534.4 million Total Growth (Decline) Organic Growth (Decline) Power Generation 12.5 % 15.1 % Oil, Gas & Petrochemical 0.6% 6.6% Marine (15.3)% (9.0)% Mining 52.2% 61.4% General Industrial & Other 9.2 % 13.8 % Total 7.7 % 12.8% Power Generation 34% Marine 10% Mining 10% Oil, Gas & Petro- chemical 27% General Industrial and Other 19% Total Growth (Decline) Organic Growth (Decline) Power Generation 44.7% 48.5 % Oil, Gas & Petrochemical (14.9)% (11.5)% Marine (0.2)% 7.4 % Mining (21.6)% (14.1)% General Industrial & Other (4.3)% 0.8 % Total 2.3 % 7.2 % __________________ Note: Dollars in millions (unaudited). Total and organic growth (decline) is calculated on a proforma basis. Power Generation 29% Marine 11% Mining 11% Oil, Gas & Petro- chemical 26% General Industrial and Other 23%

12 YTD 2012 Sales and Orders by End Market 12 Sales: $921.8 million Orders: $1,031.9 million Total Growth (Decline) Organic Growth (Decline) Power Generation 20.2 % 21.8% Oil, Gas & Petrochemical 23.1% 12.1% Marine (9.6)% (5.3)% Mining 34.5% 41.4% General Industrial & Other 8.9% 11.5% Total 14.7% 14.3% Total Growth (Decline) Organic Growth (Decline) Power Generation 20.1% 22.2% Oil, Gas & Petrochemical 8.0% (13.5)% Marine (2.9)% 1.8% Mining (7.4)% (0.9)% General Industrial & Other (4.2)% (2.5)% Total 5.9% 2.7% __________________ Note: Dollars in millions (unaudited). Total and organic growth (decline) is calculated on a proforma basis. Power Generation 30% Marine 12% Mining 9% Oil, Gas & Petro- chemical 26% General Industrial and Other 23% Power Generation 34% Marine 10% Mining 9% Oil, Gas & Petro- chemical 26% General Industrial and Other 21%

13 Power Generation Market Perspective 13 Sales & Orders Growth Q2 2012 vs. Q2 2011 YTD 2012 vs. YTD 2011 Total Organic Total Organic Sales 12.5% 15.1% 20.2% 21.8% Orders 44.7% 48.5% 20.1% 22.2% Colfax YTD 2012 Sales Split 30% Power Gen. Colfax YTD 2012 Orders Split Highlights ▪ Served by both Howden and Colfax Fluid Handling ▪ Driven by global fundamental undersupply of electricity ▪ Growth is strong in China, South Africa, South East Asia and the Middle East 34% Power Gen. __________________ Note: Total and organic growth (decline) is calculated on a proforma basis.
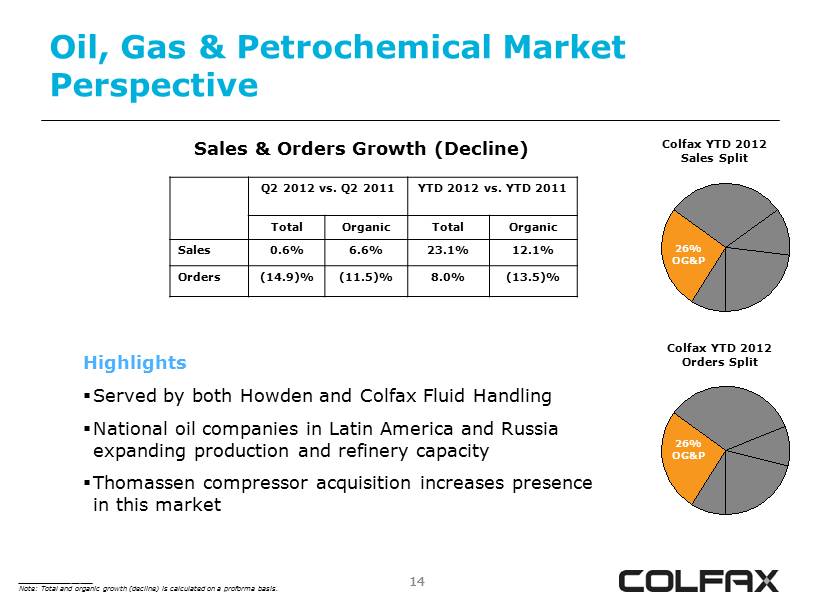
14 Oil, Gas & Petrochemical Market Perspective 14 Sales & Orders Growth (Decline) Colfax YTD 2012 Sales Split 26% OG&P Colfax YTD 2012 Orders Split 26% OG&P Highlights ▪ Served by both Howden and Colfax Fluid Handling ▪ National oil companies in Latin America and Russia expanding production and refinery capacity ▪ Thomassen compressor acquisition increases presence in this market __________________ Note: Total and organic growth (decline) is calculated on a proforma basis. Q2 2012 vs. Q2 2011 YTD 2012 vs. YTD 2011 Total Organic Total Organic Sales 0.6% 6.6% 23.1% 12.1% Orders (14.9)% (11.5)% 8.0% (13.5)%

15 Marine Market Perspective 15 Sales & Orders (Decline) Growth Colfax YTD 2012 Sales Split 12% Marine Colfax YTD 2012 Orders Split Highlights ▪ Comprised of commercial marine and government, or defense, customers ▪ Primarily served by Colfax Fluid Handling ▪ New ship build is down from 2011 peak ▪ Q2 orders strong for supply vessels and European OEMs ▪ Q2 sales decline largely Howden fans shipped in 2011 quarter not repeated; pump sales essentially flat 10% Marine __________________ Note: Total and organic growth (decline) is calculated on a proforma basis. Q2 2012 vs. Q2 2011 YTD 2012 vs. YTD 2011 Total Organic Total Organic Sales (15.3)% (9.0)% (9.6)% (5.3)% Orders (0.2)% 7.4% (2.9)% 1.8%
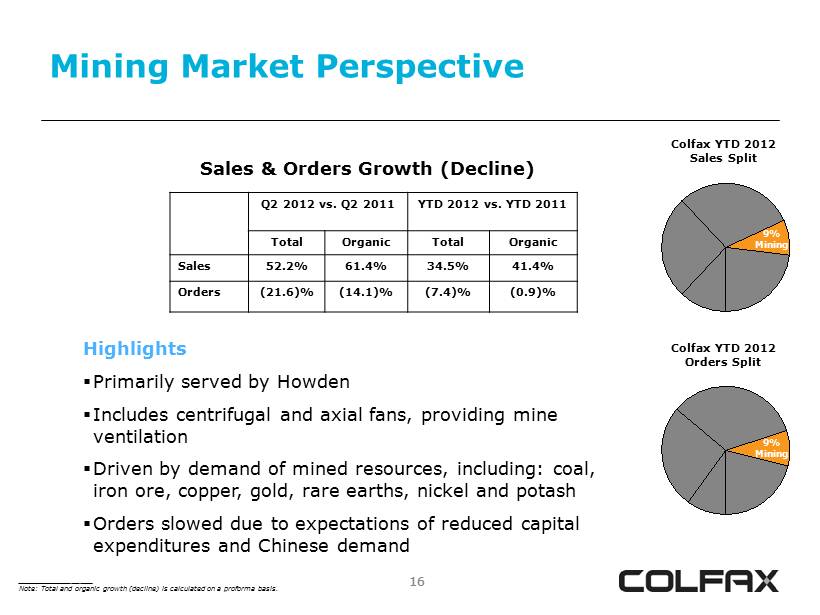
16 Mining Market Perspective 16 Sales & Orders Growth (Decline) Colfax YTD 2012 Sales Split 9% Mining Colfax YTD 2012 Orders Split Highlights ▪ Primarily served by Howden ▪ Includes centrifugal and axial fans, providing mine ventilation ▪ Driven by demand of mined resources, including: coal, iron ore, copper, gold, rare earths, nickel and potash ▪ Orders slowed due to expectations of reduced capital expenditures and Chinese demand 9% Mining __________________ Note: Total and organic growth (decline) is calculated on a proforma basis. Q2 2012 vs. Q2 2011 YTD 2012 vs. YTD 2011 Total Organic Total Organic Sales 52.2% 61.4% 34.5% 41.4% Orders (21.6)% (14.1)% (7.4)% (0.9)%

17 General Industrial & Other Market Perspective 17 Sales & Orders Growth (Decline) Colfax YTD 2012 Sales Split 23% GI&O Colfax YTD 2012 Orders Split Highlights ▪ Includes both Howden and Colfax Fluid Handling ▪ Represents a variety of industrial fans and compressors, tunnel ventilation and pumps serving various industrial needs ▪ Sales were driven by industrial fans and compressors, and fluid - handling’s distribution, waste water and chemical processing submarkets 21% GI&O __________________ Note: Total and organic growth (decline) is calculated on a proforma basis. Q2 2012 vs. Q2 2011 YTD 2012 vs. YTD 2011 Total Organic Total Organic Sales 9.2% 13.8% 8.9% 11.5% Orders (4.3)% 0.8% (4.2)% (2.5)%
18 18 Fabrication Technology
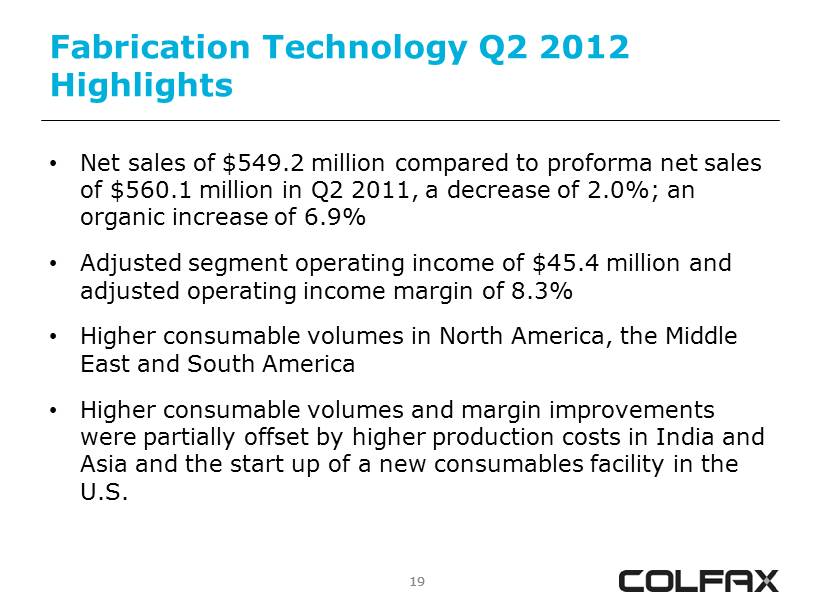
19 Fabrication Technology Q2 2012 Highlights • Net sales of $549.2 million compared to proforma net sales of $560.1 million in Q2 2011, a decrease of 2.0%; an organic increase of 6.9% • Adjusted segment operating income of $45.4 million and adjusted operating income margin of 8.3% • Higher consumable volumes in North America, the Middle East and South America • Higher consumable volumes and margin improvements were partially offset by higher production costs in India and Asia and the start up of a new consumables facility in the U.S. 19

20 Fabrication Technology YTD 2012 Highlights • Net sales of $1.01 billion, a decrease of 0.4% compared to proforma YTD Q2 2011 sales; an organic increase of 6.3% • Adjusted segment operating income of $79.4 million and adjusted operating income margin of 7.9% • Higher consumable volumes in North America, the Middle East and South America 20

21 Revenue 21 Revenue (1) $560.1 $549.2 $1,013.8 $1,010.2 $0.0 $100.0 $200.0 $300.0 $400.0 $500.0 $600.0 $700.0 $800.0 $900.0 $1,000.0 $1,100.0 Q2 2011 Q2 2012 YTD 2011 YTD 2012 (1) Q2 2011 and YTD 2011 sales are presented on a proforma basis. __________________ Note: Dollars in millions (unaudited). Revenue – YTD 2012 Equipment 19% Consumables 81% Geographic Exposure – YTD 2012 Developed Economies 45% Emerging Markets 55% QTD YTD Volume 5.4 % 3.8% Price/Mix 1.5 % 2.5% Acquisitions 0.6 % 0.6% FX Translation (9.5)% (7.3)% Total Decline (2.0)% (0.4)%

22 22 Results of Operations

23 Income Statement Summary (unaudited) 23 Refer to Appendix for Non - GAAP reconciliation and footnotes. __________________ Note: Dollars in millions. Three Months Ended Change June 29, 2012 July 1, 2011 Net sales $ 1,045.6 $ 186.7 Gross profit $ 327.9 $ 64.7 % of sales 31.4% 34.7% SG&A expense $ 245.0 $ 44.4 % of sales 23.4% 23.8% Adjusted operating income $ 97.3 $ 20.3 % of sales 9.3% 10.8% Adjusted net income $ 43.1 $ 12.8 % of sales 4.1% 6.8% Adjusted net income per share $ 0.35 $ 0.29

24 Income Statement Summary (unaudited) 24 Refer to Appendix for Non - GAAP reconciliation and footnotes. __________________ Note: Dollars in millions. Six Months Ended Change June 29, 2012 July 1, 2011 Net sales $ 1,932.0 $ 345.3 Gross profit $ 583.3 $ 117.9 % of sales 30.2% 34.2% SG&A expense $ 470.8 $ 82.3 % of sales 24.4% 23.8% Adjusted operating income $ 160.6 $ 35.6 % of sales 8.3% 10.3% Adjusted net income $ 68.6 $ 22.0 % of sales 3.5% 6.4% Adjusted net income per share $ 0.59 $ 0.50

25 25 Appendix

26 Disclaimer 26 Colfax has provided financial information that has not been prepared in accordance with GAAP. These non - GAAP financial measures are adjusted net income, adjusted net income per share, projected adjusted net income per share, adjusted operating income, organic sales growth and organic order growth. Adjusted net income, adjusted net income per share and adjusted operating income exclude asbestos coverage litigation expense, expenses related to major restructuring programs or any additional structural changes announced in the future, expenses related to the Charter acquisition and significant year - one fair value adjustment amortization expense. The effective tax rates used to calculate adjusted net income, adjusted net income per share and projected adjusted net income per share are 31% for the second quarter and six months ended June 29, 2012 in comparison to 32% for the second quarter and six months ended July 1, 2011. Organic sales growth (decline) and organic order growth (decline) exclude the impact of bolt - on acquisitions and foreign exchange rate fluctuations and are presented on a proforma basis (the proforma comparison includes the 2011 sales and orders for Howden and ESAB, excluding the first 12 days of the year to date reporting period). These non - GAAP financial measures assist Colfax in comparing its operating performance on a consistent basis because, among other things, they remove the impact of asbestos insurance coverage issues, costs related to the Charter acquisition, major restructuring programs and items outside the control of its operating management. Sales and order information by end market are estimates. We periodically update our customer groupings order to refine these estimates.

27 Non - GAAP Reconciliation (unaudited) ____________________ Note: Dollars in thousands. (1) The effective tax rates used to calculate adjusted net income and adjusted net income per share are 31% for the second quarte r a nd six months ended June 29, 2012 and 32% for the second quarter and six months ended July 1, 2011. (2) Adjusted net income per share was calculated consistent with the two - class method in accordance with GAAP as the Series A prefer red stock are considered participating securities. Losses are not allocated to the preferred stock. June 29, 2012 July 1, 2011 June 29, 2012 July 1, 2011 Adjusted Net Income and Adjusted Earnings Per Share Net income (loss) attributable to Colfax Corporation 12,366$ 10,390$ (93,232)$ 16,945$ Restructuring and other related charges 18,558 242 27,201 2,219 Charter acquisition-related expense 766 - 43,617 - Fair value adjustments - ESAB/Howden backlog and inventory amortization expense 14,422 - 48,127 - Asbestos coverage litigation expense 3,240 3,302 5,527 5,368 Tax adjustment (1) (6,247) (1,157) 37,345 (2,543) Adjusted net income 43,105 12,777 68,585 21,989 Adjusted net income margin 4.1% 6.8% 3.5% 6.4% Dividends on preferred stock 5,073 - 8,807 - Adjusted net income available to Colfax Corporation common shareholders 38,032 12,777 59,778 21,989 Less: net income attributable to participating securities (2) 4,859 - 7,129 - 33,173$ 12,777$ 52,649$ 21,989$ Weighted-average shares outstanding - diluted 94,733,164 44,277,234 88,825,431 44,203,940 Adjusted net income per share 0.35$ 0.29$ 0.59$ 0.50$ Net income (loss) per share— basic and diluted (in accordance with GAAP) 0.07$ 0.23$ (1.16)$ 0.38$ Six Months EndedThree Months Ended

28 Non - GAAP Reconciliation (unaudited) Net sales -$ -$ Operating income 42,077 8.5% 32,405 5.9% (14,176) 60,306 5.8% 21,421 11.5% (4,714) 16,707$ 8.9% Charter acquisition-related expense - - 766 766 - - - Restructuring and other related charges 3,035 13,006 2,517 18,558 156 86 242 Asbestos coverage litigation expense 3,240 - - 3,240 3,302 - 3,302 Fair value adjustments - ESAB/Howden backlog and inventory amortization expense 14,400 22 - 14,422 - - - Adjusted operating income 62,752 12.6% 45,433 8.3% (10,893) 97,292 9.3% 24,879$ 13.3% (4,628)$ 20,251$ 10.8% Q2 2012 Q2 2011 Fluid Handling Corporate and Other Total Colfax Corporation 496,495$ 549,158$ 1,045,653$ 186,749$ 186,749$ Gas and Fluid Handling Fabrication Technology Corporate and Other Total Colfax Corporation ____________________ Note: Dollars in thousands.
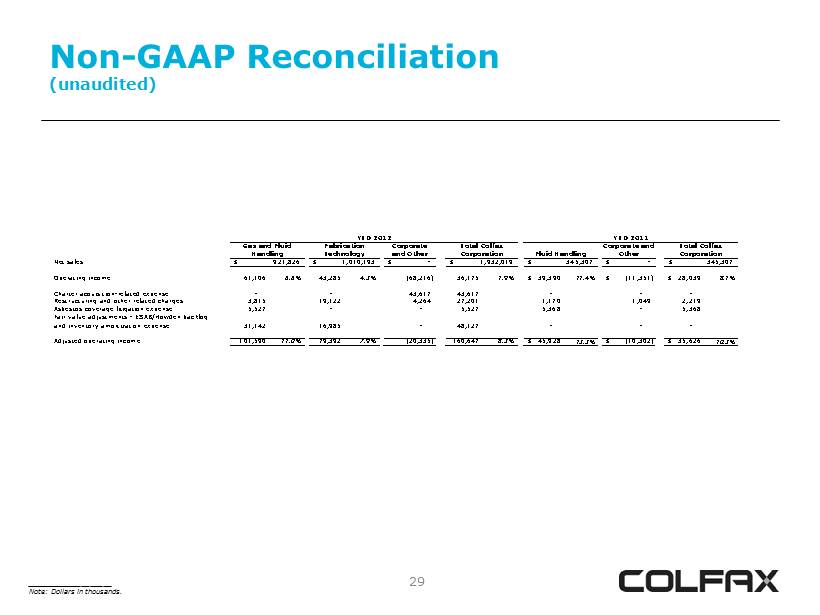
29 Non - GAAP Reconciliation (unaudited) Net sales -$ -$ Operating income 61,106 6.6% 43,285 4.3% (68,216) 36,175 1.9% 39,390$ 11.4% (11,351)$ 28,039$ 8.1% Charter acquisition-related expense - - 43,617 43,617 - - - Restructuring and other related charges 3,815 19,122 4,264 27,201 1,170 1,049 2,219 Asbestos coverage litigation expense 5,527 - - 5,527 5,368 - 5,368 Fair value adjustments - ESAB/Howden backlog and inventory amortization expense 31,142 16,985 - 48,127 - - - Adjusted operating income 101,590 11.0% 79,392 7.9% (20,335) 160,647 8.3% 45,928$ 13.3% (10,302)$ 35,626$ 10.3% YTD 2012 Total Colfax Corporation Fluid Handling YTD 2011 Total Colfax Corporation Corporate and Other Gas and Fluid Handling Fabrication Technology Corporate and Other 921,826$ 1,010,193$ 1,932,019$ 345,307$ 345,307$ ____________________ Note: Dollars in thousands.
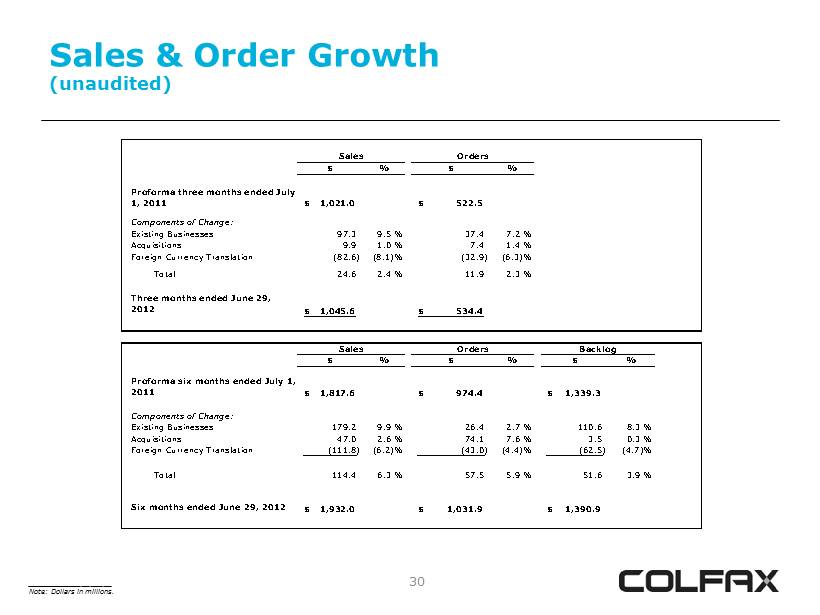
30 Sales & Order Growth (unaudited) ____________________ Note: Dollars in millions. $ % $ % Proforma three months ended July 1, 2011 1,021.0$ 522.5$ Components of Change: Existing Businesses 97.3 9.5 % 37.4 7.2 % Acquisitions 9.9 1.0 % 7.4 1.4 % Foreign Currency Translation (82.6) (8.1)% (32.9) (6.3)% Total 24.6 2.4 % 11.9 2.3 % Three months ended June 29, 2012 1,045.6$ 534.4$ $ % $ % $ % Proforma six months ended July 1, 2011 1,817.6$ 974.4$ 1,339.3$ Components of Change: Existing Businesses 179.2 9.9 % 26.4 2.7 % 110.6 8.3 % Acquisitions 47.0 2.6 % 74.1 7.6 % 3.5 0.3 % Foreign Currency Translation (111.8) (6.2)% (43.0) (4.4)% (62.5) (4.7)% Total 114.4 6.3 % 57.5 5.9 % 51.6 3.9 % Six months ended June 29, 2012 1,932.0$ 1,031.9$ 1,390.9$ Sales Orders Sales Orders Backlog
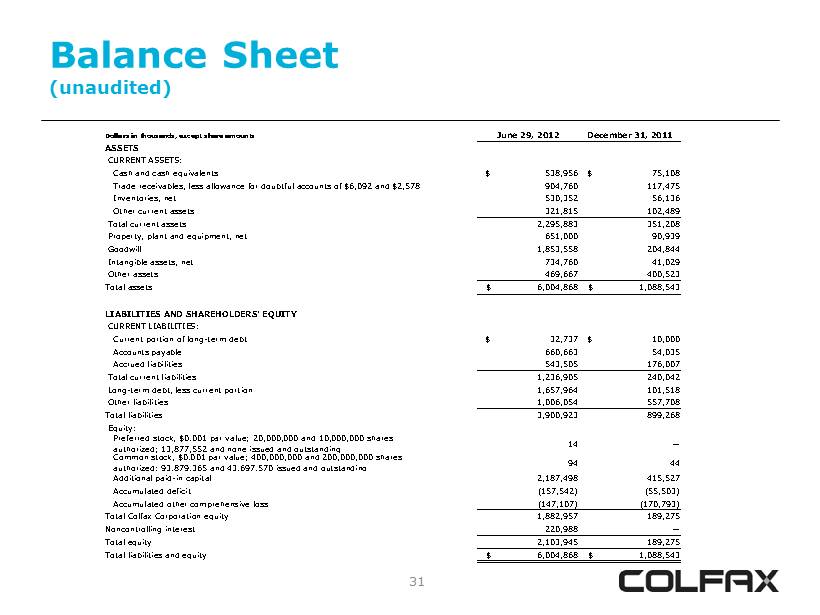
31 Balance Sheet (unaudited) Dollars in thousands, except share amounts June 29, 2012 December 31, 2011 ASSETS CURRENT ASSETS: Cash and cash equivalents $ 538,956 $ 75,108 Trade receivables, less allowance for doubtful accounts of $6,092 and $2,578 904,760 117,475 Inventories, net 530,352 56,136 Other current assets 321,815 102,489 Total current assets 2,295,883 351,208 Property, plant and equipment, net 651,000 90,939 Goodwill 1,853,558 204,844 Intangible assets, net 734,760 41,029 Other assets 469,667 400,523 Total assets $ 6,004,868 $ 1,088,543 LIABILITIES AND SHAREHOLDERS’ EQUITY CURRENT LIABILITIES: Current portion of long-term debt $ 32,737 $ 10,000 Accounts payable 660,663 54,035 Accrued liabilities 543,505 176,007 Total current liabilities 1,236,905 240,042 Long-term debt, less current portion 1,657,964 101,518 Other liabilities 1,006,054 557,708 Total liabilities 3,900,923 899,268 Equity: Preferred stock, $0.001 par value; 20,000,000 and 10,000,000 shares authorized; 13,877,552 and none issued and outstanding 14 — Common stock, $0.001 par value; 400,000,000 and 200,000,000 shares authorized; 93,879,365 and 43,697,570 issued and outstanding 94 44 Additional paid-in capital 2,187,498 415,527 Accumulated deficit (157,542) (55,503) Accumulated other comprehensive loss (147,107) (170,793) Total Colfax Corporation equity 1,882,957 189,275 Noncontrolling interest 220,988 — Total equity 2,103,945 189,275 Total liabilities and equity $ 6,004,868 $ 1,088,543

32 2012 Outlook Summary (July Update) Revenue Range 2012 Total $3.9 billion To $4.0 billion EPS and Adjusted Net Income Range 2012 Net loss per share $(0.45) To $(0.35) Adjusted net income – Colfax (1) $142.8 million To $153.3 million 2012 Adjusted net income per share (2) $1.35 To $1.45 Assumptions Asbestos coverage litigation $11 million Asbestos liability and defense costs $9 million Restructuring costs $43 million Charter acquisition - related expense $44 million Fair value adjustments – ESAB/Howden inventory and backlog $78 million FX for Q3 and Q4 (EUR, INR, BRL) $1.225, $0.018, $0.48 Tax rate - Adjusted basis/GAAP for Q3 and Q4 30%/33% Outstanding shares – common and equivalents/preferred 95 million/13.9 million (Q3 – Q4) 92 million/13.4 million (Full Year) (1) Before preferred stock dividend. (2) Excludes impact of asbestos coverage litigation costs, Charter acquisition - related expense, Charter inventory and backlog f air value adjustments and restructuring charges. (See Non - GAAP Reconciliation included in this Appendix) Note: Guidance as of 7/27/12

33 2012 Outlook Summary (continued) Assumptions (continued) Depreciation $70 million Amortization $105 million Interest Expense $95 million Capital Expenditures 2.0% of revenue Pension funding in excess of expense $40 million Preferred dividend $19 million Note: Guidance as of 7/27/12

34 2012 Guidance Update (unaudited) Low High Low High Adjusted Operating Profit- February Guidance Foreign Currency Rate Adjustment (7.5) (8.0) Update to Adjusted Operating Profit 9.4 (3.0) Updated Adjusted Operating Profit 359.5$ 374.6$ Interest Expense (95.0) (95.0) Income tax (80.7) (85.3) 183.8 194.3 Noncontrolling Interest (22.0) (22.0) Preferred Dividend (19.0) (19.0) 142.8$ 153.3$ 1.35$ 1.45$ 357.6$ 385.6$ (millions except per share) Adjusted Income EPS Range

35 2012 EPS Reconciliation (unaudited) Low High Original Guidance $ 1.45 $ 1.65 Impact of 9 million new shares (0.07) (0.07) More profit attributable to entities not wholly owned (0.03) (0.03) Narrowing range of operating profit 0.07 (0.02) Tax rate (0.02) (0.03) FX- stronger dollar (0.05) (0.05) Revised Guidance $ 1.35 $ 1.45

36 Non - GAAP Reconciliation (unaudited) Projected net loss per share - diluted $ (0.45) $ (0.35) Fair value adjustments - Charter inventory and backlog 0.78 0.78 Restructuring costs 0.43 0.43 Asbestos coverage litigation 0.09 0.09 Charter transaction costs 0.44 0.44 Tax adjustment 0.06 0.06 Projected adjusted net income per share - diluted $ 1.35 $ 1.45 EPS Range