Attached files
| file | filename |
|---|---|
| 8-K - 8-K - AGILYSYS INC | d386912d8k.htm |
| EX-99.1 - EX-99.1 - AGILYSYS INC | d386912dex991.htm |
 Fiscal 2013 Unaudited First-Quarter Results
July 26, 2012
Exhibit 99.2
Agilysys, Inc. (Nasdaq: AGYS) |
 Forward-looking statements & non-GAAP financial
information
Forward-looking statements & non-GAAP financial
information
Forward-Looking Language
This presentation and other publicly available documents, including the documents
incorporated herein and therein by reference, contain, and our officers and
representatives may from time to time make, "forward-looking statements" within the meaning of the safe harbor provisions of
the U.S. Private Securities Litigation Reform Act of 1995. Forward-looking
statements can be identified by words such as: "anticipate,"
"intend," "plan," "goal," "seek,"
"believe," "project," "estimate," "expect," "strategy," "future," "likely," "may," "should," "will" and similar
references to future periods. These statements are not guarantees of future
performance and involve risks, uncertainties and assumptions that
are
difficult
to
predict.
These
statements
are
based
on
management’s
current
expectations,
intentions
or
beliefs
and
are
subject
to
a
number of factors, assumptions and uncertainties that could cause actual results to
differ materially from those described in the forward- looking
statements. Factors that could cause or contribute to such differences or that might otherwise impact the business include the risk
factors
set
forth
in
Item
1A
of
the
company’s
Annual
Report
for
the
fiscal
year
ended
March
31,
2012.
Copies
are
available
from
the
SEC
or
the Agilysys website. We undertake no obligation to update any such factor or to
publicly announce the results of any revisions to any forward-looking
statements contained herein whether as a result of new information, future events or otherwise.
Use of Non-GAAP Financial Information
To supplement the unaudited condensed consolidated financial statements presented
in accordance with U.S. GAAP in this press release, certain non-GAAP
financial measures as defined by the SEC rules are used. These non-GAAP financial measures include adjusted operating
loss, adjusted net loss and adjusted cash flow from operations. Management believes
that such information can enhance investors' understanding of the company's
ongoing operations. See the accompanying tables below for reconciliations of adjusted operating income
(loss) and adjusted net income (loss), and adjusted cash flow from operations, to
the comparable GAAP measures. 2
2 |
 Q1
review: consolidated results from continuing operations
Q1 review: consolidated results from continuing
operations
3
Q1 Year-over-Year Commentary
Statement of Operations ($Mil., except per share)
3
•
Consolidated revenue decreased $1.0M
•
Products revenue decreased 14%
•
Support, Maintenance and Subscription
Services grew 5%
•
Professional Services increased 28%
•
Gross profit increased 13% and gross margin,
as a percentage of sales, increased 5.1% on
improved revenue mix
•
Restructuring charges totaled $1M
•
Adjusted operating income increased $3.5M to
$1.0M, reversing prior-period loss of $2.5M
•
Adjusted net income grew $3.6M
•
Adjusted EPS improved to $0.03, compared
with loss of $0.12 in fiscal 2012
Three Months Ended
June 30
2012
2011
%
Revenue:
Products
$24.1
$28.0
(13.7%)
Support, maintenance and
subscription services
$18.4
$17.5
5.2%
Professional services
$9.1
$7.1
27.8%
Total revenue
$51.6
$52.6
(1.8%)
Products
$18.9
$23.3
(19.1%)
Support, maintenance and
subscription services
$6.8
$6.5
5.1%
Professional services
$5.6
$4.7
18.7%
Cost of goods sold
$31.3
$34.5
(9.4%)
Gross profit
$20.4
$18.1
12.7%
39.5%
34.4%
Operating loss
($1.4)
($8.4)
Adjusted operating income (loss)
$1.0
($2.5)
Adjusted net income (loss)
$0.7
($2.9)
Adjusted net income (loss) per share
$0.03
$ (0.12) |
 Q1
review: Hospitality (“HSG”) Q1 review: Hospitality
(“HSG”) •
Total revenue increased 15%
•
Products revenue increases 44% on higher
software sales and prior-period adjustment
•
Support, maintenance and subscription
services increased 7%
•
Professional Services 2%, respectively
•
Gross margin expanded 420 basis points due
to shift to higher-margin business and
increased sales of proprietary software
•
Operating income increased to $3.2M vs.
loss of $1.0M in 1Q FY12
•
Adjusted operating income grew $3.3M to
$4.2M
4
HSG Segment Profit ($Mil.)
Q1 Year-over-Year Commentary
4
Three Months Ended
June 30
2012
2011
%
Revenue:
Products
$6.6
$4.5
44.2%
Support, maintenance and
subscription services
$12.4
$11.6
6.5%
Professional services
$3.4
$3.4
1.8%
Total revenue
$22.4
$19.5
14.5%
Cost of goods sold
$7.7
$7.5
5.1%
Gross profit
$14.7
$12.0
22.2%
65.6%
61.4%
Operating income (loss)
$3.2
($1.0)
Adjusted operating income
$4.2
$0.9 |
 Q1
review: Retail (“RSG”) Q1 review: Retail (“RSG”)
•
Revenue declined 11% due to decline in
Products revenues
•
Gross profit margin expanded 110 basis
points as a result of a improved revenue mix
•
Operating income was $1.7M, compared with
$1.8M last year
•
Adjusting for stock compensation and
restructuring charges, operating income was
$1.9M, versus $2.2M in FY 2012’s first
quarter
5
RSG Segment Profit ($Mil.)
Q1 Year-over-Year Commentary
5
Three Months Ended
June 30
2012
2011
%
Revenue:
Products
$17.6
$23.4
(25.0%)
Support, maintenance and
subscription services
$6.0
$5.9
2.6%
Professional services
$5.7
$3.8
51.1%
Total revenue
$29.3
$33.1
(11.4%)
Cost of goods sold
$23.6
$27.0
(12.6%)
Gross profit
$5.7
$6.1
(6.2%)
19.5%
18.4%
Operating income
$1.7
$1.8
Adjusted operating income
$1.9
$2.2 |
 Q1
review: Corporate and Company Adjusted Operating Expenses
Q1 review: Corporate and Company Adjusted
Operating Expenses
•
Relocation of corporate services and staff
ramp-up in Atlanta are essentially complete
•
Realized cost savings are on plan
Excluding stock-based compensation:
•
Product development expenses decreased
$1.6M, or 20.5%;
•
Sales and marketing expenses
increased
$0.4M, or 7.3%; and
•
General and administrative expenses
decreased $0.9M, or 12.2%.
6
Corporate continuing operations
Q1 Year-over-Year Commentary
6
Company adjusted operating expenses
Three Months Ended
June 30
($Mil)
2012
2011
Consolidated operating expenses as reported:
Product development
$ 6.3
$ 7.9
Sales and marketing
5.9
5.6
General and administrative
6.8
8.7
Depreciation
0.7
1.0
Total
$19.7
$23.2
Stock-based compensation:
Product development
$ 0.1
$ 0.1
Sales and marketing
0.0
0.1
General and administrative
0.3
1.3
Total
$ 0.4
$ 1.5
Adjusted operating expense:
Product development
$ 6.2
$ 7.8
Sales and marketing
5.9
5.5
General and administrative
6.5
7.4
Depreciation
0.7
1.0
Total
$19.4
$21.7
Three Months Ended
June 30
2012
2011
Total revenue
$0.0
$0.0
Cost of goods sold
$0.0
$0.0
Gross profit
$0.0
$0.0
Operating loss
($6.3)
($9.2)
Adjusted operating loss
($5.1)
($5.6) |
 Fiscal 2013 Q1 review: summary cash flow
performance and key balance sheet metrics
Fiscal 2013 Q1 review: summary cash flow
performance and key balance sheet metrics
•
Cash and liquid investments on hand decreased to $80.3M from $97.6M
•
Fiscal 2013 1Q Uses of Cash Included:
•
$6.3M in BEP/SERP payments
•
$3.7M in cash expenses related to restructuring activities
•
Other cash outlays included annual bonus payments, audit and litigation
expenses •
Working capital management resulted in a decrease of approximately $6M in cash
during the quarter
•
Deferred
revenue
increased
32%
to
$25M,
from
$19M,
at
the
end
of
the
prior
fiscal
year’s
first
quarter on higher annual support and maintenance contract awards
7
7 |
 8
8
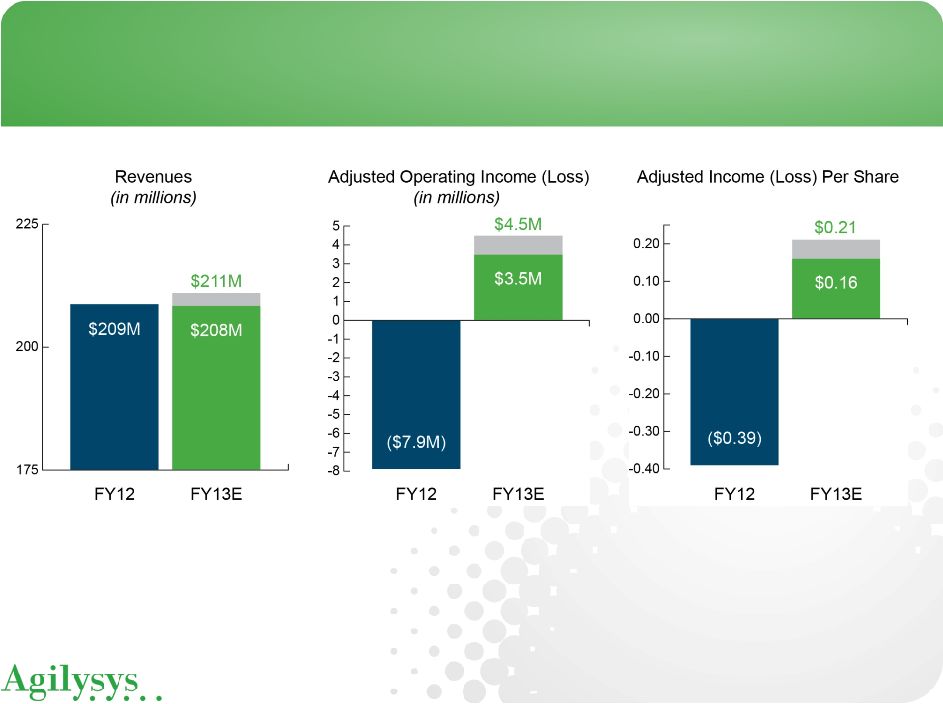
Fiscal 2013 Outlook
Fiscal 2013 Outlook |
 Agilysys, Inc. (Nasdaq: AGYS)
Fiscal 2013 Unaudited First-Quarter Results
Questions & Answers
July 26, 2012 |
 Reconciliation of operating income (loss) to adjusted
net income (loss) (unaudited)
Reconciliation of operating income (loss) to adjusted
net income (loss) (unaudited)
10
10
2012
2011
Operating loss
(1,386)
$
(8,362)
$
Stock-based compensation expense
353
1,481
Amortization of intangibles
880
931
Asset impairments and related charges
208
-
Impact from revision to prior-period financial statements
-
1,127
Restructuring and related charges
961
2,346
Adjusted operating income (loss) from continuing operations (a)
1,016
(2,477)
Other expense, net
290
268
Cash income tax expense (b)
36
124
Adjusted net income (loss) (a)
690
$
(2,869)
$
Weighted average shares outstanding: basic and diluted
21,836
22,953
Adjusted net income (loss) per share (a)
0.03
$
(0.12)
$
(a) Non-GAAP financial measure
(b) Taxes calculated based upon our cash tax rate for the three months ended June 30, 2012 and
2011 (In thousands, except per-share data)
Three Months Ended
June 30, |
 Reconciliation
of operating cash flows from continuing
operations to adjusted cash flow from continuing operations
(unaudited)
Reconciliation
of operating cash flows from continuing
operations to adjusted cash flow from continuing operations
(unaudited)
11
11
Three Months Ended
(In thousands)
June 30,
2012
2011
Operating activities:
Net cash used in continuing operations
$ (19,807)
$ (8,679)
Non-recurring cash items:
Restructuring payments
3,707
344
BEP/SERP payments
6,271
--
Adjusted cash used in continuing operations
$ (9,829)
$ (8,335) |