Attached files
| file | filename |
|---|---|
| 8-K - FORM 8-K - SunCoke Energy, Inc. | d385485d8k.htm |
| EX-99.1 - PRESS RELEASE - SunCoke Energy, Inc. | d385485dex991.htm |
 Q2 2012
Earnings Conference Call
July 26, 2012
Exhibit 99.2 |
 Safe Harbor
Statement Safe Harbor Statement
This slide presentation should be reviewed in conjunction with SunCoke’s
Second Quarter 2012 earnings release and conference call held on July 26,
2012 at 10:00 a.m. ET. Some
of
the
information
included
in
this
presentation
contains
“forward-looking
statements”
(as
defined
in
Section
27A
of
the Securities Act of 1933, as amended and Section 21E of the Securities Exchange
Act of 1934, as amended). Such forward-looking statements are based on
management’s beliefs and assumptions and on information currently available.
Forward-looking statements include the information concerning SunCoke’s
possible or assumed future results of operations, the planned Master Limited
Partnership, business strategies, financing plans, competitive position, potential
growth opportunities, potential operating performance improvements, the effects of
competition and the effects of future legislation or regulations.
Forward-looking statements include all statements that are not historical facts and may be
identified
by
the
use
of
forward-looking
terminology
such
as
the
words
“believe,”
“expect,”
“plan,”
“intend,”
“anticipate,”
“estimate,”
“predict,”
“potential,”
“continue,”
“may,”
“will,”
“should”
or the negative of these terms or similar expressions.
Forward-looking statements involve risks, uncertainties and assumptions.
Actual results may differ materially from those
expressed in these forward-looking statements. You should not put undue
reliance on any forward-looking statements. In accordance with the safe
harbor provisions of the Private Securities Litigation Reform Act of 1995, SunCoke has
included in its filings with the Securities and Exchange Commission cautionary
language identifying important factors (but not necessarily all the
important factors) that could cause actual results to differ materially from those expressed in any
forward-looking statement made by SunCoke. For more information concerning
these factors, see SunCoke's Securities and Exchange Commission
filings. All forward-looking statements included in this presentation
are expressly qualified in their entirety by such cautionary statements.
SunCoke does not have any intention or obligation to update publicly any
forward-looking statement (or its associated cautionary language) whether as a
result of new information or future events or after the date of this
presentation, except as required by applicable law. This presentation
includes certain non-GAAP financial measures intended to supplement, not substitute for, comparable
GAAP measures. Reconciliations of non-GAAP financial measures to GAAP financial
measures are provided in the Appendix at the end of the presentation.
Investors are urged to consider carefully the comparable GAAP measures and
the reconciliations to those measures provided in the Appendix, or on our website
at www.suncoke.com. SunCoke Energy Q2 2012 Earnings Conference Call
1 |
 Q2 2012 Earnings
Overview Q2 2012 results of $0.32 per share driven
by strong Coke performance
•
Middletown startup has been a success
•
Continued improvement at Indiana
Harbor
•
Strong operations at other facilities
Coal action plan progressing
•
Improved sequential performance
•
Difficult demand/price environment
continues
Strong liquidity position
•
Generated significant free cash flow
•
Cash balance of $190 million and virtually
undrawn revolver of $150 million
Reaffirm expected 2012 Adjusted
EBITDA
(1)
of $250 million to $280 million
•
2012 free cash flow
(2)
is now expected to be
in excess of $100 million
(1)
For a definition and reconciliation of Adjusted EBITDA, please see the
appendix.
(2)
For a definition and reconciliation of free cash flow, please see the appendix.
SunCoke Energy Q2 2012 Earnings Conference Call
2
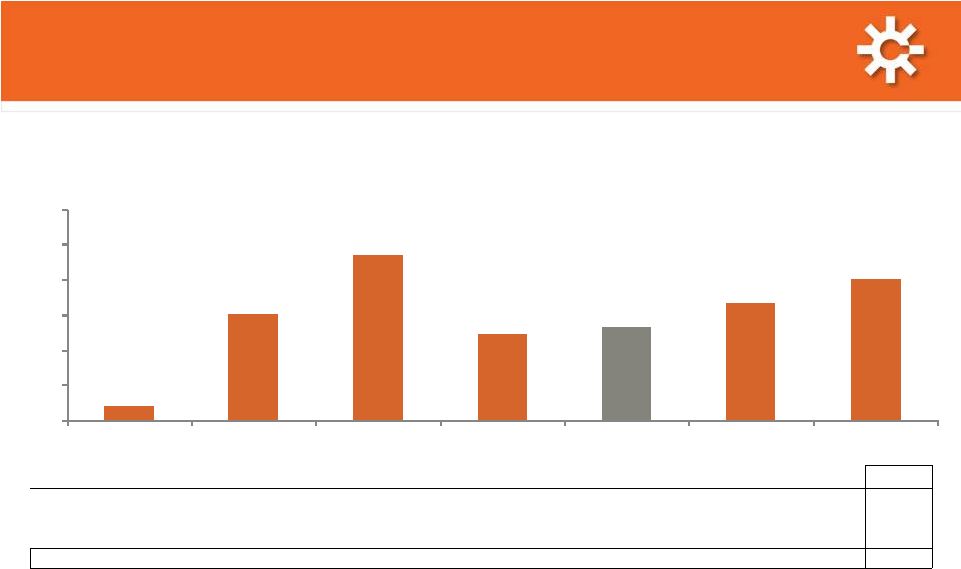
Earnings Per Share (diluted)
Adjusted EBITDA
(1)
(in millions)
$0.17
$0.24
$0.32
$0.32
2011
2012
Q1
Q2
$26.6
$55.8
$37.7
$65.5
2011
2012
Q1
Q2 |
 MLP Update
•
Board approved formation of MLP
•
Expected Assets/Structure
–
A portion of our interests in
Haverhill and Middletown
–
SXC to own General Partner,
incentive distribution rights and a
portion of the partnership units
•
Proceeds to SXC
–
Expected uses will include paying
down debt, funding expansion and
other general corporate purposes
•
Timing
–
Expect to close no sooner than
fourth quarter 2012
•
Additional details will be in S-1
SunCoke Energy Q2 2012 Earnings Conference Call
3
Middletown Operations
Haverhill Operations |
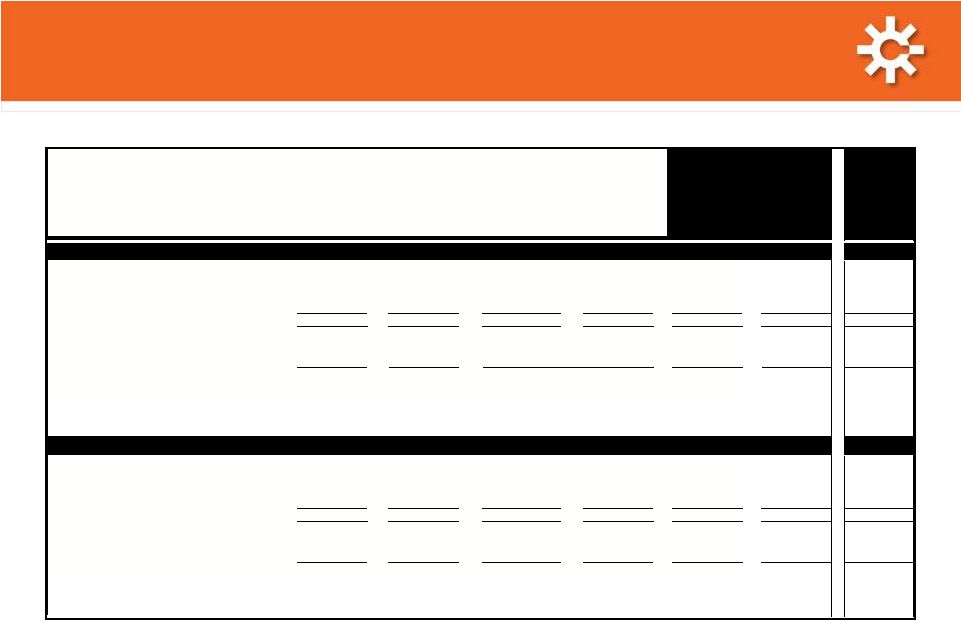
 Q2 2012 Financial
Results Q2 2012 Financial Results
Revenue up 22%
•
Middletown sold 146 thousand tons;
added $72.0 million to revenue
•
Higher average coal prices benefited
both Coke and Coal revenues
Adjusted EBITDA
(3)
increased 74%
•
Middletown contributed $14.0 million
•
Improved operations at Indiana Harbor
•
Yield/Cost improvement at Granite City
and other facilities
•
Coal results impacted by lower prices
and volumes in hi-vol./thermal
operations
•
Lower corporate costs
Earnings Per Share of $0.32
•
Reflects financing costs of standalone
capital structure
SunCoke Energy Q2 2012 Earnings Conference Call
4
($ in millions)
Q2'12
Q2'11
Domestic
Coke
Sales
Volume
1,074
927
147
Coal Sales Volumes
365
334
31
Revenue
460.9
$
377.9
$
83.0
$
Operating Income
42.8
$
21.5
$
21.3
$
Net Income Attributable to
Shareholders
22.7
$
22.5
$
0.2
$
Earnings Per Share
0.32
$
0.32
$
0.00
$
Coke Adjusted EBITDA
(1)
61.8
$
36.7
$
25.1
$
Coal Adjusted EBITDA
(2)
9.3
$
11.5
$
(2.2)
$
Corporate/Other
(5.6)
$
(10.5)
$
4.9
$
Adjusted EBITDA
(3)
65.5
$
37.7
$
27.8
$
Change
(1) Coke Adjusted EBITDA includes Jewell Coke, Other Domestic Coke and International
segments.
(2) Coal Adjusted EBITDA includes Coal Mining segment. In Q1 ’12, internal
coal transfer price mechanism changed to reflect Jewell Coke contract price; prior year
periods adjusted to reflect this change.
(3) For a definition and reconciliation of Adjusted EBITDA, please see appendix. |
 Adjusted
EBITDA Adjusted EBITDA
(1)
(1)
Bridge –
Bridge –
Q2 2011 to Q2 2012
Q2 2011 to Q2 2012
SunCoke Energy Q2 2012 Earnings Conference Call
5
Quarter’s performance led by strong Coke business results
(1)
(2)
($ in millions)
$37.7
$65.5
$14.0
$5.1
$1.2
$4.8
$4.9
($2.2)
Q2 2011
Adjusted
EBITDA (1)
Middletown
Indiana
Harbor
(excluding one-time
items) (2)
Indiana
Harbor one-time
items (2)
Coke Business
(Jewel/Haverhill/
Granite City/Int'l)
Coal Mining
Corporate
Costs
Q2 2012
Adjusted
EBITDA (1)
Total improvement of
$6.3 million
For a definition and reconciliation of Adjusted EBITDA, please see the appendix.
One-time items that impacted Indiana Harbor performance in Q2 2011 included $1.2 million
($0.8 million net of noncontrolling interests) due to lower cost or market
adjustment on coke inventory purchased to meet projected production shortfall.
|
 EPS Bridge
– EPS Bridge –
Q2 2011 to Q2 2012
Q2 2011 to Q2 2012
SunCoke Energy Q2 2012 Earnings Conference Call
6
EPS reflects strength of cokemaking business
offset by financing costs for standalone capital structure
(1)
$0.32
$0.32
$0.35
$0.06
($0.03)
($0.08)
($0.23)
($0.07)
Q2 2011 EPS
(Diluted)
Adjusted
EBITDA(1)
Coke business
Adjusted
EBITDA(1)
Corporate Costs
Adjusted
EBITDA(1)
Coal Mining
Depreciation,
Depletion
& Amortization
Financing Costs
Taxes
Q2 2012 EPS
(Diluted)
Reflects:
Q2 2012 interest expense: $12.0m
Q2 2011 interest income from affiliate: $5.7m
For a definition and reconciliation of Adjusted EBITDA, please see the appendix. |
 Domestic Coke Business Summary
(Jewell Coke & Other Domestic Coke)
(Jewell Coke & Other Domestic Coke)
SunCoke Energy Q2 2012 Earnings Conference Call
7
(Tons in thousands)
($ in millions, except per ton amounts)
Strong quarter for domestic coke profitability driven by
Middletown, Indiana Harbor and other operations
Domestic Coke Production
Domestic Coke Adjusted EBITDA
(1)
Per Ton
(1)
For a definition of EBITDA and Adjusted EBITDA/Ton and reconciliations, please see the
appendix.
(2)
Includes Indiana Harbor contract billing adjustment of $6.0 million, net of NCI, and
inventory adjustment of $6.2 million, net of NCI, of which $3.1 million is
attributable to Q3 2011.
(3)
Includes a $2.4 million, net of NCI, charge related to coke inventory reduction and a $1.3
million, net of NCI, lower cost or market adjustment on pad coal inventory and
lower coal-to-coke yields related to the startup at Middletown.
|
 Domestic Coke
Business Outlook Domestic Coke Business
Outlook ($ in millions, except as noted)
Estimated
Low
Estimated
High
Domestic Coke Adjusted EBITDA
(1)
Per Ton
$55
$60
Annual Domestic Coke Sales Volumes (in millions of tons)
x 4.3
x 4.4
Domestic Coke Adjusted EBITDA
(1)
$237
$264
Less: Ongoing Capital Expenditures
($35)
($35)
Annual Domestic Coke Adjusted EBITDA
(1)
less Ongoing
Capital Expenditures
$202
$229
Illustrative Liquidity Ratios for Domestic Coke Business
Estimated
Estimated
Net Debt
(2)
to Adjusted EBITDA
(1)
2.7x
2.3x
Interest Coverage
(3)
4.6x
5.2x
(1)
For a definition and reconciliation of Adjusted EBITDA, please see the appendix.
(2)
Net Debt represents Total Debt less cash balance at end of period. Net Debt provides a
perspective on the Company's overall debt position. Net Debt was calculated by subtracting our
6/30/2012 cash balance of $190.0 million from our Total Debt of $724.9 million on 6/30/2012.
(3)
Interest coverage is Adjusted EBITDA divided by expected 2012 interest expense of $44 million,
net of amortization of issuance, discount and other fees. All figures are
estimates based on current expectations for domestic coke business (Jewell Coke and Other Domestic Coke segments); for example
purposes only
•
Expect
domestic
coke
Adjusted
EBITDA
(1)
per
ton
to
be
$55
-
$60
for
balance
of
2012
•
Based on current sentiment, 2012 coke sales volume expected to be in middle of range
SunCoke Energy Q2 2012 Earnings Conference Call
8 |
 SunCoke
Energy
Q2
2012
Earnings
Conference
Call
9
Pretax Return on Invested Capital (ROIC)
Pretax Return on Invested Capital (ROIC)
Pretax ROIC, ex-Middletown prior 2012
(1)(2)
Q1 2011
Q2 2011
Q3 2011
Q4 2011
2011
Q1 2012
Q2 2012
Total Domestic Coke (Includes Jewell Coke and Other Domestic Coke)
2%
15%
23%
12%
13%
17%
20%
International Coke
10%
7%
20%
120%
36%
0%
7%
Coal Mining
46%
28%
21%
(5%)
23%
11%
17%
Total SunCoke (Including Corp./Other)
4%
11%
16%
8%
10%
13%
17%
2%
15%
23%
12%
17%
20%
13%
0.0%
5.0%
10.0%
15.0%
20.0%
25.0%
30.0%
Q1 2011
Q2 2011
Q3 2011
Q4 2011
2011
Q1 2012
Q2 2012
Pretax ROIC
(1)
for Domestic Coke
excluding Middletown prior to 2012
(2)
(3)
(3)
(4)
1)
For a definition of Pretax ROIC and reconciliations, please see the appendix. Pretax ROIC is
calculated as Adjusted Pretax Operating Income divided by average invested capital
(stockholders’ equity plus total debt net of cash and cash equivalents); for a reconciliation of
Adjusted Pretax Operating Income to Adjusted EBITDA, please see appendix
2)
This table excludes Middletown assets up to and including Q4 2011. At the end of Q4 2011,
identifiable assets included in Other Domestic Coke attributable to Middletown were $402.8m
(prior to Q4 2011, Middletown was included in the Corporate and Other segment); see historical segment detail in public filings for additional detail.
3)
Includes Indiana Harbor contract billing adjustment of $6.0 million, net of NCI, and inventory
adjustment of $6.2 million, net of NCI, of which $3.1 million is attributable to Q3 2011.
4)
Includes a $2.4 million, net of NCI, charge related to a coke inventory reduction and a $1.3 million,
net of NCI, lower cost or market adjustment on pad coal inventory and $4.0
million of non-recurring costs and lower coal-to-coke yields related to the startup at
Middletown. |
 Q2
'11 Q3 '11
Q4 '11
Q1 '12
Q2 '12
Coal Sales
334
371
363
373
365
Coal Producton
340
340
349
375
401
Purchased Coal
24
22
20
19
4
$11
$9
$2
$7
$9
$162
$155
$159
$171
$167
$34
$25
$20
$20
$25
$126
$132
$138
$151
$137
-$50
$0
$50
$100
$150
$200
Q2 '11
Q3 '11
Q4 '11(3)
Q1 '12
Q2 '12
Coal Adjusted EBITDA
Average Sales Price
Coal Adj EBITDA / ton
Coal Cash Cost / ton
Coal Mining Financial Summary
Coal Mining Financial Summary
SunCoke Energy Q2 2012 Earnings Conference Call
10
Coal Mining Adjusted EBITDA
(1)
and Avg. Sales
Price/Ton
(2)
($ in millions, except per ton amounts)
Q2 2012 Adjusted EBITDA
(1)
declined YoY to
$9.3 million
•
Pricing up modestly, reflecting strong mid-vol.
pricing/volumes, offset by weak
hi-vol. & thermal pricing/volumes
•
Cash costs up $11/ton, reflecting decreased mix
and higher costs of hi-vol. & thermal production
(mid-vol. costs up slightly)
Coal action plan gaining traction
•
Cash cost per ton decreased from Q1 2012
Intend to maintain cash neutral position in
Coal Sales, Production and Purchases
•
Jewell underground cash cost per ton was $143
in Q2 2012 vs. $161 in Q1 2012, and $139 in Q2
2011
•
Jewell reject rates were 66% in Q2 2012,
improved from 68% in Q1 2012 and 67% in Q2
2011
•
Expect further cash cost reductions for 2013
(1)
For a definition and a reconciliation of Adjusted EBITDA, please see the appendix.
(2)
Average Sales Price is the weighted average sales price for all coal sales volumes, including
sales to affiliates and sales to Jewell Coke.
(3)
Q4 2011 Adjusted EBITDA inclusive of Black Lung Liability charge of $3.4 million and
OPEB expense allocation of $1.8 million.
2012 |
 Q2 2012 Sources
& Uses of Cash Q2 2012 Sources & Uses of Cash
SunCoke Energy Q2 2012 Earnings Conference Call
11
Liquidity position and credit metrics improving;
free cash flow
(1)
was $66 million in first half 2012
($ in millions)
(1)
For a definition and reconciliation of free cash flow, please see appendix.
$113.6
$24.0
$20.2
$40.1
$190.0
$5.6
($0.1)
($11.2)
($2.2)
Q1 2012
Cash
Balance
Q2 2012
Net Income
Depreciation,
Depletion &
Amortization
Deferred
Taxes
Changes in
Working
Capital
Other
Capital
Expenditures
Cash used in
financing
activities
Q2 2012
Cash
Balance
Primary changes vs. Q1 2012:
Accounts receivable: +$24.8m
Accrued liabilities: +$9.9m
Interest payable: +$7.8m
Inventory: ($5.7m) |
 Strategies for
Enhancing Shareholder Value Strategies for Enhancing Shareholder Value
12
SunCoke Energy Q2 2012 Earnings Conference Call
Maintain focus on details
and discipline of coke and
coal mining operations
Sustain and enhance top
quartile safety
performance and ability to
meet environment
standards
Leverage operating know-
how and technology to
continuously improve
yields and operating costs
Domestic
Continue permitting
efforts for next
potential U.S. facility
Explore opportunities to
make strategic
investments in existing
capacity
International
Execute India entry and
pursue follow-on
growth
Coke MLP
Execute plan to place a
portion of our
cokemaking assets into
an MLP structure
Coal
Optimize operations
and investments to
enhance long-term
strategic flexibility
Operational
Excellence
Grow The Coke
Business
Strategically Optimize
Assets |
 Updated 2012
Guidance Updated 2012 Guidance
Metric
Expected 2012 Outlook
Adjusted EBITDA
(1)
$250 million –
$280 million
EPS* (at 22% tax rate)
$1.30 –
$1.65
Capital Expenditures &
Investments
Approximately $85 million
Free Cash Flow
(2)
$100 million +
Cash Tax Rate
10% –
15%
Effective Tax Rate
20% –
24%
Corporate Costs
$30 million –
$35 million
Coke Production
In excess of 4.3 million tons
Coal Production
Approximately 1.6 million tons
SunCoke Energy Q2 2012 Earnings Conference Call
13
(1) For a definition and reconciliation of Adjusted EBITDA, please see the appendix.
(2) For a definition of Free Cash Flow and reconciliation, please see the appendix.
*Diluted |
 Questions |
 Appendix
|
 Definitions
SunCoke Energy Q2 2012 Earnings Conference Call
16
for sales discounts and the deduction of income attributable to non-controlling interests in our
Indiana Harbor cokemaking operations. EBITDA reflects sales discounts included as a
reduction in sales and other operating revenue. The sales discounts represent the sharing with
our customers of a portion of nonconventional fuels tax credits, which reduce our income tax expense. However, we
believe that our Adjusted EBITDA would be inappropriately penalized if these discounts were treated as
a reduction of EBITDA since they represent sharing of a tax benefit which is not included in
EBITDA. Accordingly, in computing Adjusted EBITDA, we have added back these sales discounts.
Our Adjusted EBITDA also reflects the deduction of income attributable to noncontrolling interest in our
Indiana Harbor cokemaking operations. EBITDA and Adjusted EBITDA do not represent and should not
be considered alternatives to net income or operating income under United States generally
accepted accounting principles (GAAP) and may not be comparable to other similarly titled
measures of other businesses. Management believes Adjusted EBITDA is an important measure of the operating
performance of the Company’s assets and is indicative of the Company’s ability to generate
cash from operations.
Interests. Management believes Free Cash Flow information enhances an investor’s understanding of
a business’ ability to generate cash. Free Cash Flow does not represent and should
not be considered an alternative to net income or cash flows from operating activities as
determined under GAAP and may not be comparable to other similarly titled measures of other businesses.
attributable to non-controlling interests divided by average invested capital (stockholders’
equity plus total debt net of cash and cash equivalents). We use Pretax ROIC as one
measure of how effectively we deploy capital and make multi-year investment decisions. It
is also used as a long-term performance measure under certain of our incentive compensation
plans. Pretax ROIC is not a measure of financial performance under generally accepted
accounting principles, and may not be comparable to other similarly titled measures used by
other companies. Pretax ROIC should not be considered in isolation or as an alternative to net earnings as an indicator of
performance. We define segment level Pretax ROIC as Adjusted EBITDA less depreciation expense
plus net income attributable to non-controlling interests divided by average allocated
invested capital. Average allocated invested capital for each respective
segment is calculated pro-rata based on the segment level identifiable assets for the period as
disclosed in our public filings.
•
Adjusted
EBITDA
represents
earnings
before
interest,
taxes,
depreciation,
depletion
and
amortization
(“EBITDA”)
adjusted
•
Adjusted
EBITDA/Ton
represents
Adjusted
EBITDA
divided
by
tons
sold.
•
Free
Cash
Flow
equals
cash
from
operations
less
cash
used
in
investing
activities
less
cash
distributions
to
non-controlling
•
Pretax
Return
on
Invested
Capital
(ROIC)
is
defined
as
Adjusted
EBITDA
less
depreciation
expense
plus
net
income |
 Reconciliations
SunCoke Energy Q2 2012 Earnings Conference Call
17
$ in millions
Q2 2012
Q1 2012
FY 2011
Q4 2011
Q3 2011
Q2 2011
Q1 2011
FY 2010
Adjusted Pro Forma Operating Income
151.5
Add: Pro Forma impact of ArcelorMittal settlement
51.0
Subtract: Legal and settlement charges related to ArcelorMittal Settlement
and Indiana Harbor Arbitration
(16.3)
Adjusted Operating Income
46.6
37.1
80.4
14.9
33.5
24.6
7.4
186.2
Net Income (Loss) attributable to Noncontrolling Interest
1.3
(0.3)
(1.7)
(0.5)
3.4
1.6
(6.2)
7.1
Subtract: Depreciation Expense
(20.2)
(18.4)
(58.4)
(16.0)
(14.7)
(14.7)
(13.0)
(48.2)
Adjusted EBITDA
65.5
55.8
140.5
31.4
44.8
37.7
26.6
227.3
Subtract: Depreciation, depletion and amortization
(20.2)
(18.4)
(58.4)
(16.0)
(14.7)
(14.7)
(13.0)
(48.2)
Subtract: Financing expense, net
(11.8)
(12.0)
(1.4)
(7.1)
(3.3)
4.5
4.5
19.0
Subtract: Income Tax
(7.0)
(5.3)
(7.2)
2.9
(5.1)
(1.9)
(3.1)
(46.9)
Subtract: Sales Discount
(3.8)
(3.2)
(12.9)
(3.2)
(3.5)
(3.1)
(3.1)
(12.0)
Add: Net Income attributable to NCI
1.3
(0.3)
(1.7)
(0.5)
3.4
1.6
(6.2)
7.1
Net Income
24.0
16.6
58.9
7.5
21.6
24.1
5.7
146.3
Reconciliations
from
Adjusted
Operating
Income
and
Adjusted
EBITDA
to
Net
Income |
 Reconciliations
SunCoke Energy Q2 2012 Earnings Conference Call
18
$ in millions, except per ton data
Jewell Coke
Other
Domestic
Coke
International
Coke
Jewell Coal
Corporate
Combined
Domestic
Coke
Q2 2012
Adjusted EBITDA
12.5
48.6
0.7
9.3
(5.6)
65.5
61.1
Subtract: Depreciation, depletion and amortization
(1.3)
(13.7)
(0.1)
(4.3)
(0.8)
(20.2)
(15.0)
Add (Subtract): Net (Income) loss attributable
to noncontrolling interests
1.3
1.3
1.3
Adjusted Pre-Tax Operating Income
11.2
36.2
0.6
5.0
(6.4)
46.6
47.4
Adjusted EBITDA
12.5
48.6
0.7
9.3
(5.6)
65.5
61.1
Sales Volume (thousands of tons)
170
892
358
373
1,062
Adjusted EBITDA per Ton
73.5
54.5
2.0
24.9
57.5
Average
Allocated
Invested
Capital
(1)
50.9
892.7
36.6
117.7
NMF
1,097.9
943.6
Annualized Quarterly Pretax ROIC
88%
16%
7%
17%
NMF
17%
20%
Q1 2012
Adjusted EBITDA
15.0
40.1
0.1
7.4
(6.8)
55.8
55.1
Subtract: Depreciation, depletion and amortization
(1.3)
(12.6)
(0.1)
(4.1)
(0.3)
(18.4)
(13.9)
Add (Subtract): Net (Income) loss attributable
to noncontrolling interests
(0.3)
(0.3)
(0.3)
Adjusted Pre-Tax Operating Income
13.7
27.2
-
3.3
(7.1)
37.1
40.9
Adjusted EBITDA
15.0
40.1
0.1
7.4
(6.8)
55.8
55.1
Sales Volume (thousands of tons)
186
892
358
373
1,078
Adjusted EBITDA per Ton
80.6
45.0
0.3
19.8
51.1
Average
Allocated
Invested
Capital
(1)
53.3
928.2
41.0
119.6
NMF
1,142.1
981.5
Annualized Quarterly Pretax ROIC
103%
12%
0%
11%
NMF
13%
17%
Reconciliations from Adjusted EBITDA to Adjusted Pre-Tax Operating Income
|
   Reconciliations
SunCoke Energy Q2 2012 Earnings Conference Call
19
$ in millions, except per ton data
Jewell Coke
Other
Domestic
Coke
International
Coke
Jewell Coal
Corporate
Combined
Domestic
Coke
FY 2011
Adjusted EBITDA
46.1
89.4
13.7
35.5
(44.2)
140.5
135.5
Subtract: Depreciation, depletion and amortization
(4.9)
(38.7)
(0.2)
(12.9)
(1.7)
(58.4)
(43.6)
Add (Subtract): Net (Income) loss attributable
to noncontrolling interests
(1.7)
(1.7)
(1.7)
Adjusted Pre-Tax Operating Income
41.2
49.0
13.5
22.6
(45.9)
80.4
90.2
Adjusted EBITDA
46.1
89.4
13.7
35.5
(44.2)
140.5
135.5
Sales Volume (thousands of tons)
702
3,068
1,442
1,454
3,770
Adjusted EBITDA per Ton
65.7
29.1
9.5
24.4
35.9
Average Allocated Invested Capital
52.8
627.8
37.4
99.8
NMF
817.8
680.6
Pretax ROIC
78%
8%
36%
23%
NMF
10%
13%
Q4 2011
Adjusted EBITDA
10.6
21.3
10.2
2.5
(13.2)
31.4
31.9
Subtract: Depreciation, depletion and amortization
(1.2)
(10.6)
(0.1)
(3.7)
(0.4)
(16.0)
(11.8)
Add (Subtract): Net (Income) loss attributable
to noncontrolling interests
(0.5)
(0.5)
(0.5)
Adjusted Pre-Tax Operating Income
9.4
10.2
10.1
(1.2)
(13.6)
14.9
19.6
Adjusted EBITDA
10.6
21.3
10.2
2.5
(13.2)
31.4
31.9
Sales Volume (thousands of tons)
166
837
295
363
1,003
Adjusted EBITDA per Ton
63.9
25.4
34.6
6.9
31.8
Average Allocated Invested Capital
46.7
594.0
33.7
105.6
NMF
779.9
640.6
Annualized Quarterly Pretax ROIC
81%
7%
120%
-5%
NMF
8%
12%
Reconciliations from Adjusted EBITDA to Adjusted Pre-Tax Operating Income
|
    Reconciliations
SunCoke Energy Q2 2012 Earnings Conference Call
20
$ in millions, except per ton data
Jewell Coke
Other
Domestic
Coke
International
Coke
Jewell Coal
Corporate
Combined
Domestic
Coke
Q3 2011
Adjusted EBITDA
13.9
34.3
1.7
9.2
(14.3)
44.8
48.2
Subtract: Depreciation, depletion and amortization
(1.2)
(9.9)
-
(3.3)
(0.3)
(14.7)
(11.1)
Add (Subtract): Net (Income) loss attributable
to noncontrolling interests
3.4
3.4
3.4
Adjusted Pre-Tax Operating Income
12.7
27.8
1.7
5.9
(14.6)
33.5
40.5
Adjusted EBITDA
13.9
34.3
1.7
9.2
(14.3)
44.8
48.2
Sales Volume (thousands of tons)
191
777
373
371
968
Adjusted EBITDA per Ton
72.8
44.1
4.6
24.8
49.8
Average Allocated Invested Capital
53.5
636.2
34.8
115.1
NMF
839.6
689.7
Annualized Quarterly Pretax ROIC
95%
17%
20%
21%
NMF
16%
23%
Q2 2011
Adjusted EBITDA
10.6
25.3
0.8
11.5
(10.5)
37.7
35.9
Subtract: Depreciation, depletion and amortization
(1.4)
(9.6)
(0.1)
(3.2)
(0.4)
(14.7)
(11.0)
Add (Subtract): Net (Income) loss attributable
to noncontrolling interests
1.6
1.6
1.6
Adjusted Pre-Tax Operating Income
9.2
17.3
0.7
8.3
(10.9)
24.6
26.5
Adjusted EBITDA
10.6
25.3
0.8
11.5
(10.5)
37.7
35.9
Sales Volume (thousands of tons)
170
757
412
334
927
Adjusted EBITDA per Ton
62.4
33.4
1.9
34.4
38.7
Average Allocated Invested Capital
57.9
648.2
39.7
117.7
NMF
863.4
706.1
Annualized Quarterly Pretax ROIC
64%
11%
7%
28%
NMF
11%
15%
Reconciliations from Adjusted EBITDA to Adjusted Pre-Tax Operating Income
|
 Reconciliations
SunCoke Energy Q2 2012 Earnings Conference Call
21
$ in millions, except per ton data
Jewell Coke
Other
Domestic
Coke
International
Coke
Jewell Coal
Corporate
Combined
Domestic
Coke
Q1 2011
Adjusted EBITDA
11.0
8.5
1.0
12.3
(6.2)
26.6
19.5
Subtract: Depreciation, depletion and amortization
(1.1)
(8.6)
-
(2.7)
(0.6)
(13.0)
(9.7)
Add (Subtract): Net (Income) loss attributable
to noncontrolling interests
(6.2)
(6.2)
(6.2)
Adjusted Pre-Tax Operating Income
9.9
(6.3)
1.0
9.6
(6.8)
7.4
3.6
Adjusted EBITDA
11.0
8.5
1.0
12.3
(6.2)
26.6
19.5
Sales Volume (thousands of tons)
175
697
362
386
872
Adjusted EBITDA per Ton
62.9
12.2
2.8
31.9
22.4
Average Allocated Invested Capital
56.0
645.6
41.4
83.8
NMF
826.9
701.7
Annualized Quarterly Pretax ROIC
71%
-4%
10%
46%
NMF
4%
2%
FY 2010
Adjusted EBITDA
123.9
78.5
15.0
24.0
(14.1)
227.3
202.4
Add (Subtract): Pro Forma impact of
ArcelorMittal settlement
(69.0)
18.0
(51.0)
(51.0)
Add (Subtract): Legal and settlement charges
related to ArcelorMittal Settlement and
Indiana Harbor Arbitration
3.6
12.7
16.3
16.3
Proforma Adjusted EBITDA
58.5
109.2
15.0
24.0
(14.1)
192.6
167.7
Subtract: Depreciation, depletion and amortization
(4.4)
(35.0)
(0.1)
(7.7)
(1.0)
(48.2)
(39.4)
Add (Subtract): Net (Income) loss attributable
to noncontrolling interests
7.1
7.1
7.1
Adjusted Pro Forma Operating Income
54.1
81.3
14.9
16.3
(15.1)
151.5
135.4
Adjusted EBITDA
58.5
109.2
15.0
24.0
(14.1)
192.6
167.7
Sales Volume (thousands of tons)
721
2,917
-
1,277
3,638
Adjusted EBITDA per Ton
81.1
37.4
18.8
46.1
Average Allocated Invested Capital
58.5
691.6
42.5
51.4
NMF
844.0
750.1
Pretax ROIC
92%
12%
35%
32%
NMF
18%
18%
Reconciliations from Adjusted EBITDA to Adjusted Pre-Tax Operating Income
|
 SunCoke Energy Q2 2012 Earnings Conference Call
22
Pretax Return on Invested Capital Reconciliation,
$MM
Consolidated Sun Coke Energy
Q2 2012
Q1 2012
2011
Q4 2011
Q3 2011
Q2 2011
Q1 2011
2010
Adjusted Pre-Tax Operating Income
(1)
46.6
37.1
80.4
14.9
33.5
24.6
7.4
151.5
Invested Capital
Q1 2012
(2)
Q1 2012
(2)
2011
Q4 2011
Q3 2011
Q2 2011
Q1 2011
2010
Debt
$724.9
$725.7
$726.4
$726.4
$697.8
$794.7
$715.7
$655.3
Equity
535.4
513.3
559.9
559.9
604.5
457.3
433.4
429.3
Cash
(190.0)
(113.6)
(127.5)
(127.5)
(110.9)
(30.5)
(11.0)
(40.1)
Middletown
(402.8)
(402.8)
(387.6)
(346.1)
(286.7)
(242.2)
Invested Capital
$1,070.3
$1,125.4
$756.0
$756.0
$803.8
$875.4
$851.5
$802.4
Average Invested Capital*
$1,097.9
$1,142.1
$817.8
$779.9
$839.6
$863.4
$826.9
$844.0
Q2 2012
Q1 2012
2011
Q4 2011
Q3 2011
Q2 2011
Q1 2011
2010
Quarterly ROIC
17%
13%
8%
16%
11%
4%
Last Twelve Months' ROIC
10%
18%
*5 quarter average for 2011, two quarter average for each quarter, year-end average for
2010 Debt
Q2 2011
Q1 2011
2010
Interest receivable from affiliate
(3.6)
(1.8)
0.0
Notes receivable from affiliate
(289.0)
(289.0)
(289.0)
Advances from affiliate
1,087.3
1,006.5
944.3
Total Debt
794.7
715.7
655.3
(1) See Adjusted EBITDA and Pretax ROIC Reconciliation for respective periods, 2010 uses
Adjusted Pro Forma Operating Income
(2) Q1 2012 Average Invested Capital includes Middletown in both the beginning and ending of
quarter average (Q1 2012 and Q4 2011)
|
 SunCoke Energy Q2 2012 Earnings Conference Call
23
Pretax Return on Invested Capital Reconciliation
Period ended
Jewell
Coke
Other
Domestic Coke
International
Coke
Coal
Mining
Corporate
and Other
Total
Identifiable Assets for
Allocating Invested Capital
Q2 2012
81.4
1,458.4
53.9
193.0
183.5
1,970.2
Q1 2012
83.9
1,440.2
64.6
189.1
141.1
1,918.9
Q4 2011, inc Middletown
81.6
1,440.8
62.7
182.1
174.6
1,941.8
Q4 2011
81.6
1,038.0
62.7
182.1
174.6
1,539.0
Q3 2011
77.7
990.6
52.7
178.3
192.3
1,879.2
Q2 2011
85.1
954.4
53.6
173.5
67.2
1,972.6
Q1 2011
82.6
922.6
61.2
167.3
48.9
1,860.1
2010
80.9
962.6
59.7
76.7
7.3
1,718.5
Percentage of
Invested Capital
Q2 2012
4.6%
81.6%
3.0%
10.8%
NMF
100.0%
Q1 2012
4.7%
81.0%
3.6%
10.6%
NMF
100.0%
Q4 2011, inc Middletown
4.6%
81.5%
3.5%
10.3%
NMF
100.0%
Q4 2011
6.0%
76.1%
4.6%
13.3%
NMF
100.0%
Q3 2011
6.0%
76.2%
4.1%
13.7%
NMF
100.0%
Q2 2011
6.7%
75.4%
4.2%
13.7%
NMF
100.0%
Q1 2011
6.7%
74.8%
5.0%
13.6%
NMF
100.0%
2010
6.9%
81.6%
5.1%
6.5%
NMF
100.0%
Allocated
Invested Capital
Q2 2012
48.8
873.6
32.3
115.6
-
1,070.3
Q1 2012
53.1
911.7
40.9
119.7
-
1,125.4
Q4 2011, inc Middletown
53.5
944.8
41.1
119.4
-
1,158.8
Q4 2011
45.2
575.1
34.7
100.9
-
756.0
Q3 2011
48.1
612.9
32.6
110.3
-
803.8
Q2 2011
58.8
659.6
37.0
119.9
-
875.4
Q1 2011
57.0
636.7
42.3
115.5
-
851.5
Note: This table excludes Middletown assets up to and including Q4 2011. At the end of Q4 2011,
identifiable assets included in Other Domestic Coke attributable to Middletown were $402.8m
(prior to Q4 2011, Middletown was included in the Corporate and Other segment); see historical segment detail in public filings for additional detail. |
  (in
millions) 2012E
Low
2012E
High
Net Income
$98
$122
Depreciation, Depletion and Amortization
74
72
Total financing costs, net
48
46
Income tax expense
25
37
EBITDA
$245
$277
Sales discounts
11
10
Noncontrolling interests
(6)
(7)
Adjusted EBITDA
$250
$280
Estimated EBITDA Reconciliation
2012E Net Income to Adjusted EBITDA Reconciliation
SunCoke Energy Q2 2012 Earnings Conference Call
24 |
 Free Cash Flow
Reconciliations 2012E Estimated Free Cash Flow Reconciliation
SunCoke Energy Q2 2012 Earnings Conference Call
25
(in millions)
1
st
Half
2012
Cash from operations
$ 86.7
Less cash used for investing activities
(20.7)
Less payments to minority interest
( -
)
Free Cash Flow
$ 66.0
(in millions)
2012
Cash from operations
In excess of
$ 189
Less cash used for investing activities
Approx.
(85)
Less payments to minority interest
Approx.
(4)
Free Cash Flow
In excess of
$ 100
First Half 2012 Free Cash Flow Reconciliation |
 Media releases and SEC filings
are available on
www.suncoke.com
Investor Relations:
630-824-1907 |