Attached files
| file | filename |
|---|---|
| 8-K - 8-K - KEMET CORP | a12-16228_18k.htm |
| EX-99.1 - EX-99.1 - KEMET CORP | a12-16228_1ex99d1.htm |
Exhibit 99.2
|
|
Quarter Ended June 30, 2012 Earnings Conference Call July 26, 2012 |
|
|
Cautionary Statement Certain statements included herein contain forward-looking statements within the meaning of federal securities laws about KEMET Corporation's (the "Company") financial condition and results of operations that are based on management's current expectations, estimates and projections about the markets in which the Company operates, as well as management's beliefs and assumptions. Words such as "expects," "anticipates," "believes," "estimates," variations of such words and other similar expressions are intended to identify such forward-looking statements. These statements are not guarantees of future performance and involve certain risks, uncertainties and assumptions, which are difficult to predict. Therefore, actual outcomes and results may differ materially from what is expressed or forecasted in, or implied by, such forward-looking statements. Readers are cautioned not to place undue reliance on these forward-looking statements, which reflect management's judgment only as of the date hereof. The Company undertakes no obligation to update publicly any of these forward-looking statements to reflect new information, future events or otherwise. Factors that may cause actual outcome and results to differ materially from those expressed in, or implied by, these forward-looking statements include, but are not necessarily limited to, the following: (i) adverse economic conditions could impact our ability to realize operating plans if the demand for our products declines, and such conditions could adversely affect our liquidity and ability to continue to operate; (ii) adverse economic conditions could cause the write down of long-lived assets or goodwill; (iii) an increase in the cost or a decrease in the availability of our principal or single-sourced purchased materials; (iv) changes in the competitive environment; (v) uncertainty of the timing of customer product qualifications in heavily regulated industries; (vi) economic, political, or regulatory changes in the countries in which we operate; (vii) difficulties, delays or unexpected costs in completing the restructuring plan; (viii) equity method investments expose us to a variety of risks; (ix) acquisitions and other strategic transactions expose us to a variety of risks; (x) the inability to attract, train and retain effective employees and management; (xi) the inability to develop innovative products to maintain customer relationships and offset potential price erosion in older products; (xii) exposure to claims alleging product defects; (xiii) the impact of laws and regulations that apply to our business, including those relating to environmental matters; (xiv) the impact of international laws relating to trade, export controls and foreign corrupt practices; (xv) volatility of financial and credit markets affecting our access to capital; (xvi) the need to reduce the total costs of our products to remain competitive; (xvii) potential limitation on the use of net operating losses to offset possible future taxable income; (xviii) restrictions in our debt agreements that limit our flexibility in operating our business; and (xix) additional exercise of the warrant by K Equity, LLC which could potentially result in the existence of a significant stockholder who could seek to influence our corporate decisions. 2 |
|
|
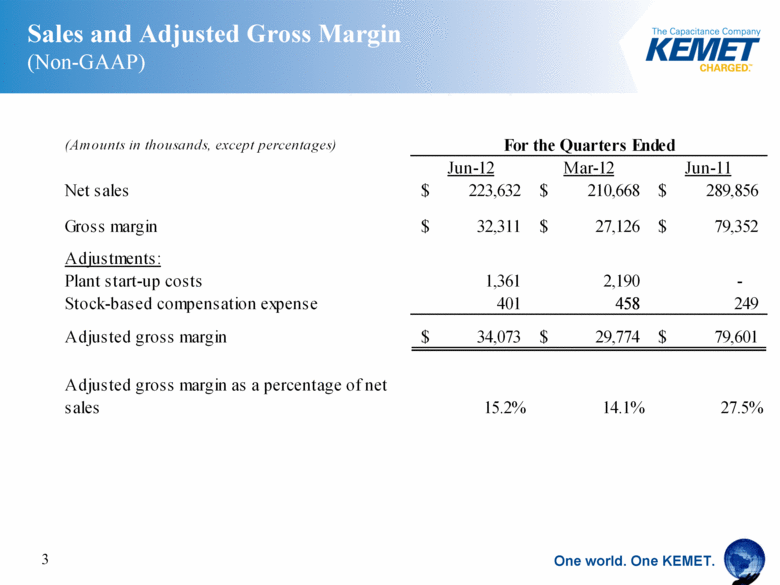
Sales and Adjusted Gross Margin (Non-GAAP) 3 (Amounts in thousands, except percentages) For the Quarters Ended Jun-12 Mar-12 Jun-11 Net sales 223,632 $ 210,668 $ 289,856 $ Gross margin 32,311 $ 27,126 $ 79,352 $ Adjustments: Plant start-up costs 1,361 2,190 - Stock-based compensation expense 401 458 249 Adjusted gross margin 34,073 $ 29,774 $ 79,601 $ Adjusted gross margin as a percentage of net sales 15.2% 14.1% 27.5% |
|
|
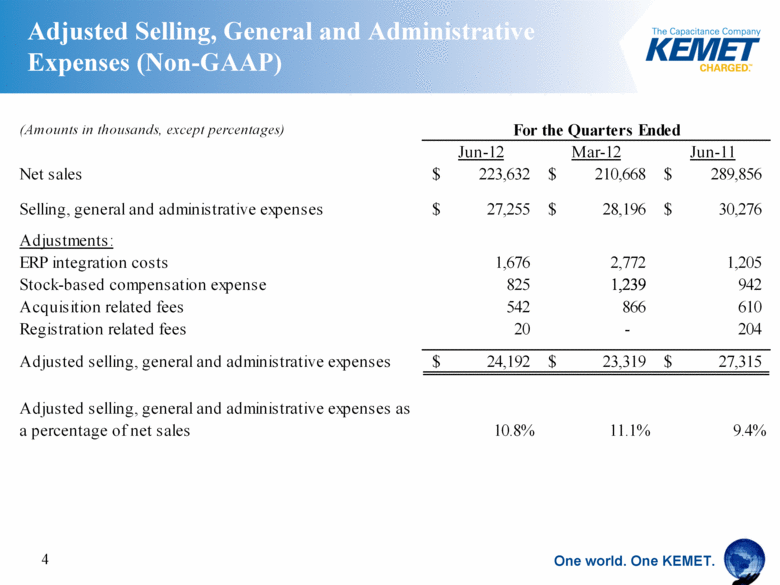
Adjusted Selling, General and Administrative Expenses (Non-GAAP) 4 (Amounts in thousands, except percentages) For the Quarters Ended Jun-12 Mar-12 Jun-11 Net sales 223,632 $ 210,668 $ 289,856 $ Selling, general and administrative expenses 27,255 $ 28,196 $ 30,276 $ Adjustments: ERP integration costs 1,676 2,772 1,205 Stock-based compensation expense 825 1,239 942 Acquisition related fees 542 866 610 Registration related fees 20 - 204 Adjusted selling, general and administrative expenses 24,192 $ 23,319 $ 27,315 $ Adjusted selling, general and administrative expenses as a percentage of net sales 10.8% 11.1% 9.4% |
|
|
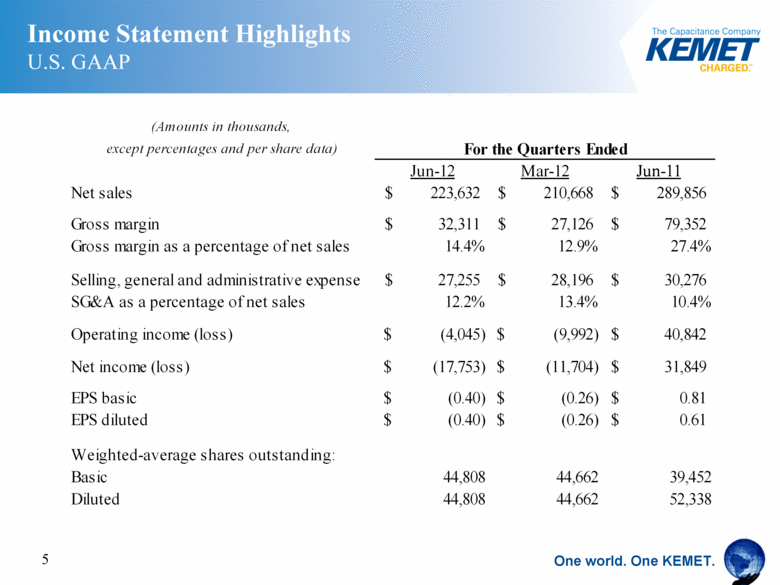
Income Statement Highlights U.S. GAAP 5 (Amounts in thousands, except percentages and per share data) For the Quarters Ended Jun-12 Mar-12 Jun-11 Net sales 223,632 $ 210,668 $ 289,856 $ Gross margin 32,311 $ 27,126 $ 79,352 $ Gross margin as a percentage of net sales 14.4% 12.9% 27.4% Selling, general and administrative expense 27,255 $ 28,196 $ 30,276 $ SG&A as a percentage of net sales 12.2% 13.4% 10.4% Operating income (loss) (4,045) $ (9,992) $ 40,842 $ Net income (loss) (17,753) $ (11,704) $ 31,849 $ EPS basic (0.40) $ (0.26) $ 0.81 $ EPS diluted (0.40) $ (0.26) $ 0.61 $ Weighted-average shares outstanding: Basic 44,808 44,662 39,452 Diluted 44,808 44,662 52,338 |
|
|
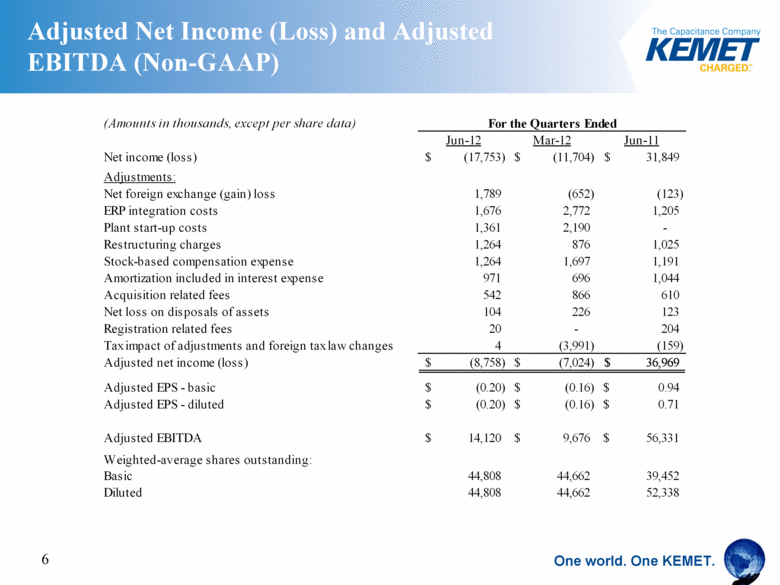
Adjusted Net Income (Loss) and Adjusted EBITDA (Non-GAAP) 6 (Amounts in thousands, except per share data) For the Quarters Ended Jun-12 Mar-12 Jun-11 Net income (loss) (17,753) $ (11,704) $ 31,849 $ Adjustments: Net foreign exchange (gain) loss 1,789 (652) (123) ERP integration costs 1,676 2,772 1,205 Plant start-up costs 1,361 2,190 - Restructuring charges 1,264 876 1,025 Stock-based compensation expense 1,264 1,697 1,191 Amortization included in interest expense 971 696 1,044 Acquisition related fees 542 866 610 Net loss on disposals of assets 104 226 123 Registration related fees 20 - 204 Tax impact of adjustments and foreign tax law changes 4 (3,991) (159) Adjusted net income (loss) (8,758) $ (7,024) $ 36,969 $ Adjusted EPS - basic (0.20) $ (0.16) $ 0.94 $ Adjusted EPS - diluted (0.20) $ (0.16) $ 0.71 $ Adjusted EBITDA 14,120 $ 9,676 $ 56,331 $ Weighted-average shares outstanding: Basic 44,808 44,662 39,452 Diluted 44,808 44,662 52,338 |
|
|
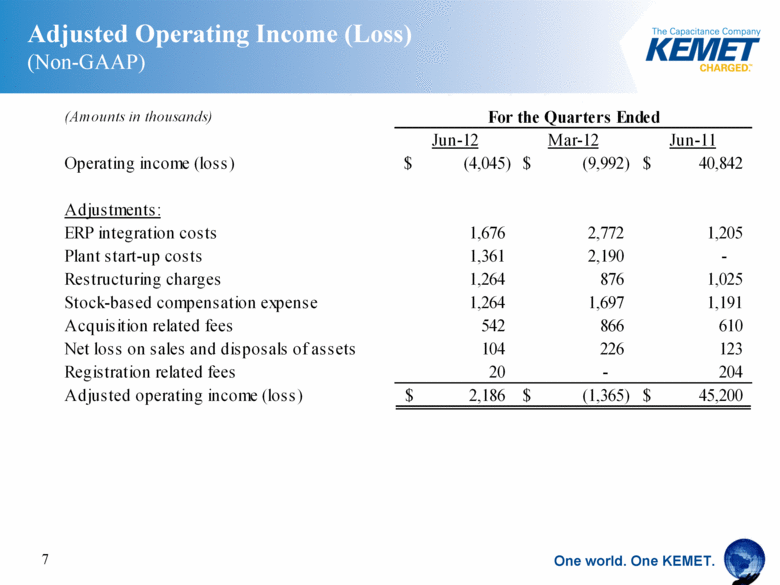
Adjusted Operating Income (Loss) (Non-GAAP) 7 (Amounts in thousands) For the Quarters Ended Jun-12 Mar-12 Jun-11 Operating income (loss) (4,045) $ (9,992) $ 40,842 $ Adjustments: ERP integration costs 1,676 2,772 1,205 Plant start-up costs 1,361 2,190 - Restructuring charges 1,264 876 1,025 Stock-based compensation expense 1,264 1,697 1,191 Acquisition related fees 542 866 610 Net loss on sales and disposals of assets 104 226 123 Registration related fees 20 - 204 Adjusted operating income (loss) 2,186 $ (1,365) $ 45,200 $ |
|
|
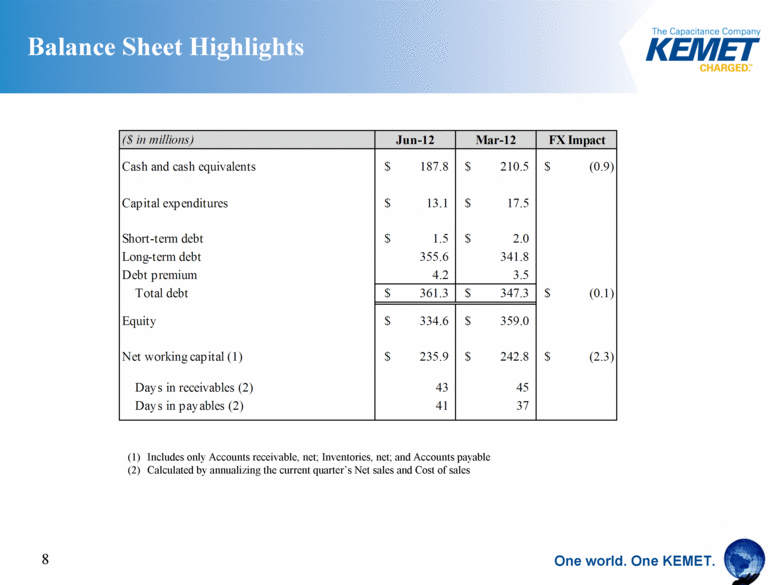
Balance Sheet Highlights Includes only Accounts receivable, net; Inventories, net; and Accounts payable Calculated by annualizing the current quarter’s Net sales and Cost of sales 8 |
|
|
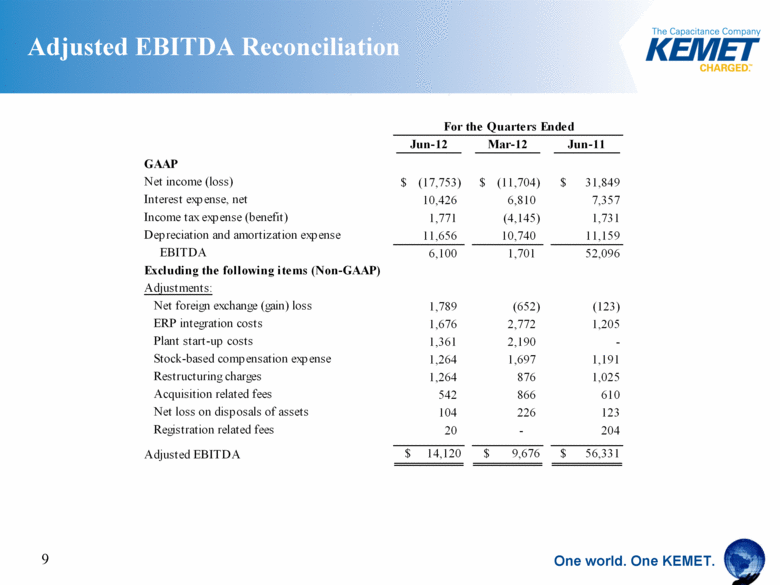
Adjusted EBITDA Reconciliation 9 For the Quarters Ended Jun-12 Mar-12 Jun-11 GAAP Net income (loss) (17,753) $ (11,704) $ $ 31,849 Interest expense, net 10,426 6,810 7,357 Income tax expense (benefit) 1,771 (4,145) 1,731 Depreciation and amortization expense 11,656 10,740 11,159 EBITDA 6,100 1,701 52,096 Excluding the following items (Non-GAAP) Adjustments: Net foreign exchange (gain) loss 1,789 (652) (123) ERP integration costs 1,676 2,772 1,205 Plant start-up costs 1,361 2,190 - Stock-based compensation expense 1,264 1,697 1,191 Restructuring charges 1,264 876 1,025 Acquisition related fees 542 866 610 Net loss on disposals of assets 104 226 123 Registration related fees 20 - 204 Adjusted EBITDA $ 14,120 $ 9,676 $ 56,331 |
|
|
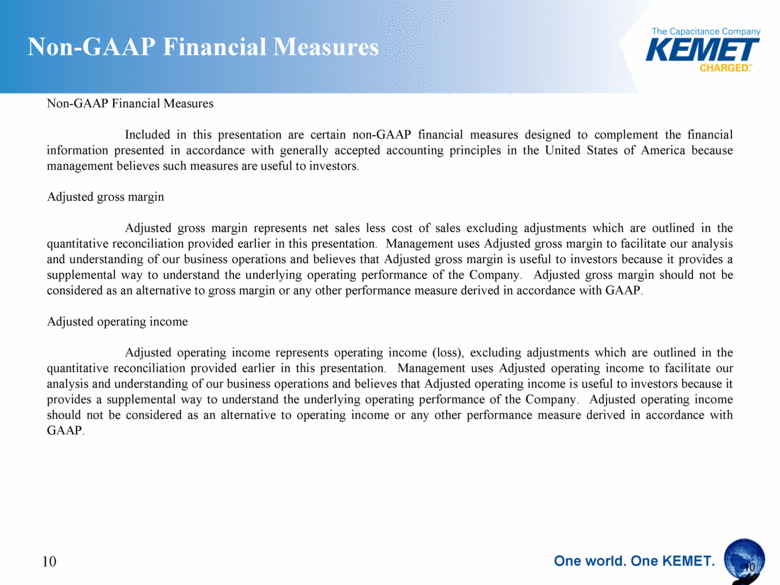
Non-GAAP Financial Measures 10 Non-GAAP Financial Measures Included in this presentation are certain non-GAAP financial measures designed to complement the financial information presented in accordance with generally accepted accounting principles in the United States of America because management believes such measures are useful to investors. Adjusted gross margin Adjusted gross margin represents net sales less cost of sales excluding adjustments which are outlined in the quantitative reconciliation provided earlier in this presentation. Management uses Adjusted gross margin to facilitate our analysis and understanding of our business operations and believes that Adjusted gross margin is useful to investors because it provides a supplemental way to understand the underlying operating performance of the Company. Adjusted gross margin should not be considered as an alternative to gross margin or any other performance measure derived in accordance with GAAP. Adjusted operating income Adjusted operating income represents operating income (loss), excluding adjustments which are outlined in the quantitative reconciliation provided earlier in this presentation. Management uses Adjusted operating income to facilitate our analysis and understanding of our business operations and believes that Adjusted operating income is useful to investors because it provides a supplemental way to understand the underlying operating performance of the Company. Adjusted operating income should not be considered as an alternative to operating income or any other performance measure derived in accordance with GAAP. |
|
|
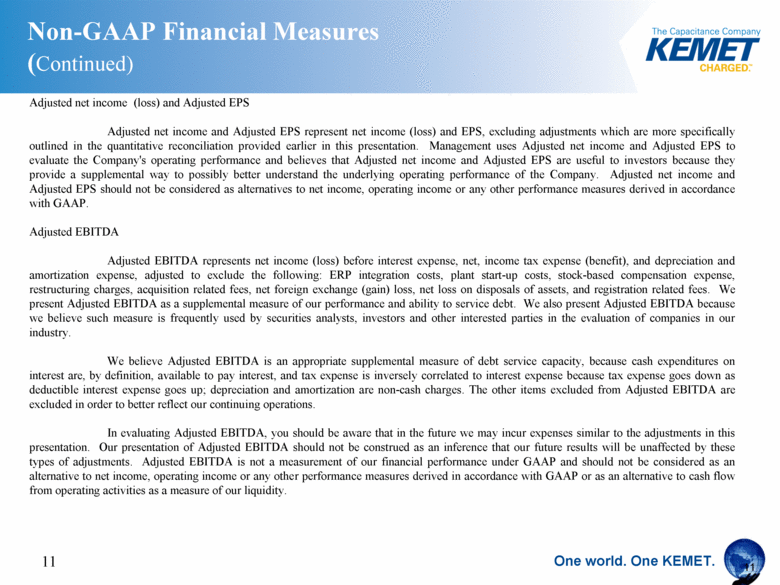
Non-GAAP Financial Measures (Continued) 11 Adjusted net income (loss) and Adjusted EPS Adjusted net income and Adjusted EPS represent net income (loss) and EPS, excluding adjustments which are more specifically outlined in the quantitative reconciliation provided earlier in this presentation. Management uses Adjusted net income and Adjusted EPS to evaluate the Company's operating performance and believes that Adjusted net income and Adjusted EPS are useful to investors because they provide a supplemental way to possibly better understand the underlying operating performance of the Company. Adjusted net income and Adjusted EPS should not be considered as alternatives to net income, operating income or any other performance measures derived in accordance with GAAP. Adjusted EBITDA Adjusted EBITDA represents net income (loss) before interest expense, net, income tax expense (benefit), and depreciation and amortization expense, adjusted to exclude the following: ERP integration costs, plant start-up costs, stock-based compensation expense, restructuring charges, acquisition related fees, net foreign exchange (gain) loss, net loss on disposals of assets, and registration related fees. We present Adjusted EBITDA as a supplemental measure of our performance and ability to service debt. We also present Adjusted EBITDA because we believe such measure is frequently used by securities analysts, investors and other interested parties in the evaluation of companies in our industry. We believe Adjusted EBITDA is an appropriate supplemental measure of debt service capacity, because cash expenditures on interest are, by definition, available to pay interest, and tax expense is inversely correlated to interest expense because tax expense goes down as deductible interest expense goes up; depreciation and amortization are non-cash charges. The other items excluded from Adjusted EBITDA are excluded in order to better reflect our continuing operations. In evaluating Adjusted EBITDA, you should be aware that in the future we may incur expenses similar to the adjustments in this presentation. Our presentation of Adjusted EBITDA should not be construed as an inference that our future results will be unaffected by these types of adjustments. Adjusted EBITDA is not a measurement of our financial performance under GAAP and should not be considered as an alternative to net income, operating income or any other performance measures derived in accordance with GAAP or as an alternative to cash flow from operating activities as a measure of our liquidity. |
|
|
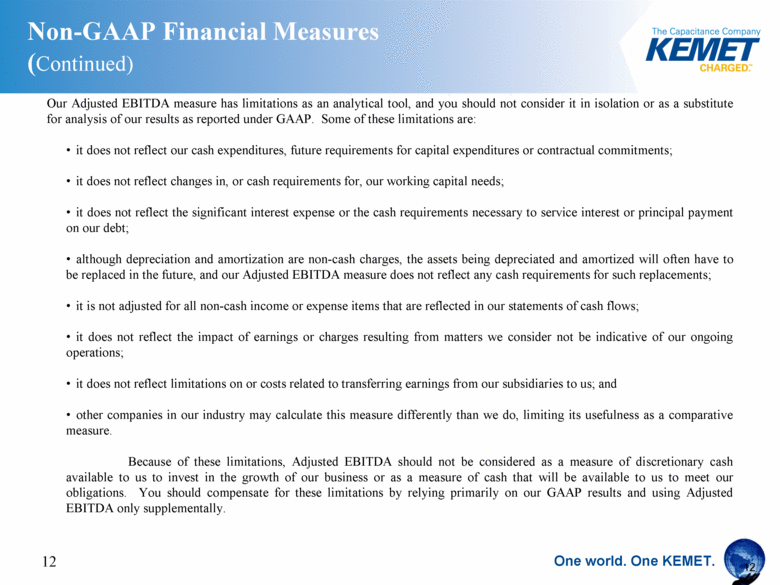
12 Our Adjusted EBITDA measure has limitations as an analytical tool, and you should not consider it in isolation or as a substitute for analysis of our results as reported under GAAP. Some of these limitations are: it does not reflect our cash expenditures, future requirements for capital expenditures or contractual commitments; it does not reflect changes in, or cash requirements for, our working capital needs; it does not reflect the significant interest expense or the cash requirements necessary to service interest or principal payment on our debt; although depreciation and amortization are non-cash charges, the assets being depreciated and amortized will often have to be replaced in the future, and our Adjusted EBITDA measure does not reflect any cash requirements for such replacements; it is not adjusted for all non-cash income or expense items that are reflected in our statements of cash flows; it does not reflect the impact of earnings or charges resulting from matters we consider not be indicative of our ongoing operations; it does not reflect limitations on or costs related to transferring earnings from our subsidiaries to us; and other companies in our industry may calculate this measure differently than we do, limiting its usefulness as a comparative measure. Because of these limitations, Adjusted EBITDA should not be considered as a measure of discretionary cash available to us to invest in the growth of our business or as a measure of cash that will be available to us to meet our obligations. You should compensate for these limitations by relying primarily on our GAAP results and using Adjusted EBITDA only supplementally. Non-GAAP Financial Measures (Continued) |


