Attached files
| file | filename |
|---|---|
| 8-K - FORM 8-K - TEXAS CAPITAL BANCSHARES INC/TX | d385041d8k.htm |
| EX-99.1 - PRESS RELEASE - TEXAS CAPITAL BANCSHARES INC/TX | d385041dex991.htm |
 TCBI
Q2 2012 Earnings July 25, 2012
Exhibit 99.2 |
 Certain matters discussed on this call may contain forward-looking statements,
which are subject to risks and uncertainties and are based on Texas
Capital’s current estimates or expectations
of
future
events
or
future
results.
Texas Capital is under no obligation, and
expressly disclaims such obligation, to update, alter or revise its
forward-looking statements, whether
as
a
result
of
new
information,
future
events
or
otherwise.
A
number of factors, many
of which are beyond Texas Capital’s control, could cause actual results to
differ materially from future
results
expressed
or
implied
by
such
forward-looking
statements.
These
risks
and
uncertainties include the risk of adverse impacts from general economic
conditions, competition,
interest
rate
sensitivity
and
exposure
to
regulatory
and
legislative
changes.
These and other factors that could cause results to differ materially from those
described in the forward-looking statements can be found in the
prospectus supplement relating to the offering and the Annual Report on
Form 10-K and other filings made by Texas Capital with the Securities
and Exchange Commission (SEC). |
 3
Opening Remarks
•
Continued strong growth in loans, deposits, ROE and ROA
•
Reduction in credit costs and NPA ratios continued in Q2-2012
•
Strong growth in LHI with good pipeline remaining
•
LHS levels remain high; taking advantage of market demand
|
 Net
Income and EPS –
Outstanding growth in net income and EPS compared to Q2-2011 and
Q1-2012 Operating Leverage, Core Earnings Power & NIM
–
Growth of Net Revenue
•
28% growth from
Q2-2011 and 4% from Q1-2012
–
Strong growth in LHI and LHS
•
More
favorable
reduction in securities
•
Growth in LHI with strong yields
•
LHS contribution to growth and earnings remained strong with growth in
participation program
•
Improved funding profile with growth in deposits and
matched funding of LHS –
NIM decrease of 5 bps from Q1-2012 and decrease of 37 bps from
Q2-2011 •
Reduction in funding costs from Q2-2011 and Q1-2012
•
LHI yields down slightly at 4.95% due to growth
•
Highly
liquid
LHS
growth
supported
with
borrowed
funds;
yield
of
4.11%
driven
by
mortgage rates for excellent spreads
–
Reduced credit costs with reduction in NPA and NCO ratios
Capital
–
Capital ratios stable notwithstanding balance sheet growth
Financial Review
4
earning
asset
composition
–
growth
in
loans,
highly
liquid
LHS
and |
 Loan
Growth –
Broad-based growth in LHI
•
Averages increased 5% from Q1-2012 and 22% from Q2-2011
•
Quarter-end balance $284 million or 5% above Q2-12 average
–
Average LHS balances consistent with Q1-2012 with surge at end of quarter and
growth in participation program
Funding
–
Funding profile improved with DDA and total deposit growth
–
LHS match funded with borrowings and deposits, producing excellent spreads for
highly liquid, short-duration earning assets
Credit Costs
–
Total credit costs of $4.1 million for Q2-2012
•
Consistent with expectations for improvement in trends
•
Provision of $1.0 million compared to $3.0 million in Q1-2012, primarily
related to growth
•
OREO valuation cost of $3.1 million compared to $ 2.7 million in
Q1-2012; gain on sale
of ORE of $433,000 in other income
•
NCOs of $533,000 (4 bps), down from $828,000 (6 bps) in Q1-2012
–
NPAs up slightly in dollars, improvement in ratios
Financial Review
5 |
 6
Q2-12
Q1-12
Q4-11
Q3-11
Q2-11
Net interest income
$ 90,640
$ 88,229
$ 88,147
$ 79,198
$ 71,094
Non-interest income
10,462
9,190
8,994
7,603
7,951
Net revenue
101,102
97,419
97,141
86,801
79,045
Provision for credit losses
1,000
3,000
6,000
7,000
8,000
OREO valuation and write-down expense
3,123
2,741
1,091
1,662
725
Total provision and OREO valuation
4,123
5,741
7,091
8,662
8,725
Non-interest expense
50,850
49,535
49,262
44,524
44,538
Income before income taxes
46,129
42,143
40,788
33,615
25,782
Income tax expense
16,506
15,062
15,043
11,905
9,074
Net income
$ 29,623
$ 27,081
$ 25,745
$ 21,710
$ 16,708
Diluted EPS
$ .76
$ .70
$ .67
$ .56
$ .44
Net interest margin
4.49%
4.54%
4.60%
4.81%
4.86%
ROA
1.40%
1.33%
1.28%
1.25%
1.08%
ROE
18.08%
17.36%
17.05%
14.93%
12.13%
Efficiency
50.3%
50.8%
50.7%
51.3%
56.3%
Income Statement
(in thousands)
(1)
Excluding OREO valuation charge
(1)
(1) |
 7
QTD Average Balances, Yields and Rates
(in thousands)
Q2 2012
Q1 2012
Q2 2011
Avg. Bal.
Yield Rate
Avg. Bal.
Yield Rate
Avg. Bal.
Yield Rate
Assets
Securities
$ 118,440
4.55%
$ 137,509
4.24%
$ 163,073
4.57%
Fed funds sold & liquidity investments
68,493
.31%
56,318
.36%
92,231
.30%
Loans held for sale
2,062,449
4.11%
2,036,622
4.21%
808,165
4.76%
Loans held for investment
5,950,913
4.95%
5,660,993
5.01%
4,890,696
5.24%
Total loans, net of reserve
7,941,583
4.78%
7,627,354
4.84%
5,630,830
5.24%
Total earning assets
8,128,516
4.73%
7,821,181
4.80%
5,886,134
5.14%
Total assets
$8,522,602
$8,209,190
$6,192,506
Liabilities and Stockholders’
Equity
Total interest bearing deposits
$4,388,120
.32%
$4,134,976
.34%
$3,797,537
.36%
Other borrowings
1,428,575
.21%
1,554,716
.19%
233,388
.19%
Long-term debt
113,406
2.44%
113,406
2.52%
113,406
2.26%
Total interest bearing liabilities
5,930,101
.33%
5,803,098
.34%
4,144,331
.40%
Demand deposits
1,864,456
1,700,390
1,455,366
Stockholders’
equity
658,969
627,594
552,632
Total liabilities and stockholders’
equity
$8,522,602
.23%
$8,209,190
.24%
$6,192,506
.27%
Net interest margin
4.49%
4.54%
4.86% |
 8
QTD Averages
Q2 2012
Q1 2012
Q2 2011
Q2/Q1 %
Change
YOY %
Change
Total assets
$8,522,602
$8,209,190
$6,192,506
4%
38%
Loans held for investment
5,950,913
5,660,993
4,890,696
5%
22%
Loans held for sale
2,062,449
2,036,622
808,165
1%
155%
Total loans
8,013,362
7,697,615
5,698,861
4%
41%
Securities
118,440
137,509
163,073
(14)%
(27)%
Demand deposits
1,864,456
1,700,390
1,455,366
10%
28%
Total deposits
6,252,576
5,835,366
5,252,903
7%
19%
Stockholders’
equity
658,969
627,594
552,632
5%
19%
Financial Summary
(in thousands) |
 9
Financial Summary
(in thousands)
Period End
Q2 2012
Q1 2012
Q2 2011
Q2/Q1 %
Change
YOY %
Change
Total assets
$9,144,360
$8,559,917
$6,709,338
7%
36%
Loans held for investment
6,234,692
5,792,349
5,164,293
8%
21%
Loans held for sale
2,408,032
2,255,281
1,122,330
7%
115%
Total loans
8,642,724
8,047,630
6,286,623
7%
37%
Securities
114,964
123,828
157,821
(7)%
(27)%
Demand deposits
2,019,473
1,751,443
1,483,159
15%
36%
Total deposits
6,660,290
6,063,558
5,421,726
10%
23%
Stockholders’
equity
680,705
647,341
563,924
5%
21% |
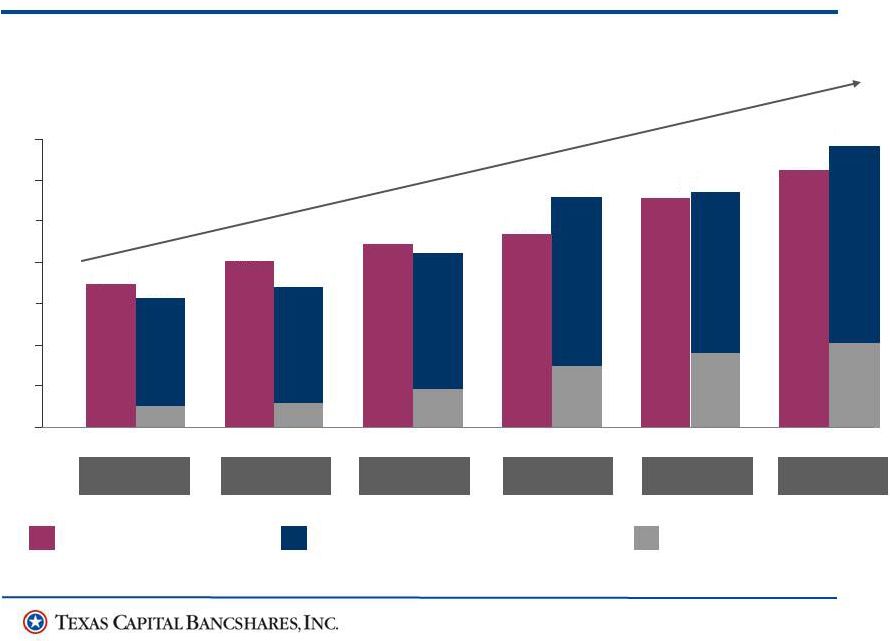
 10
$0
$40,000
$80,000
$120,000
$160,000
$200,000
$240,000
$280,000
$320,000
$360,000
$400,000
367
732
1097
1462
1828
2193
($ in thousands)
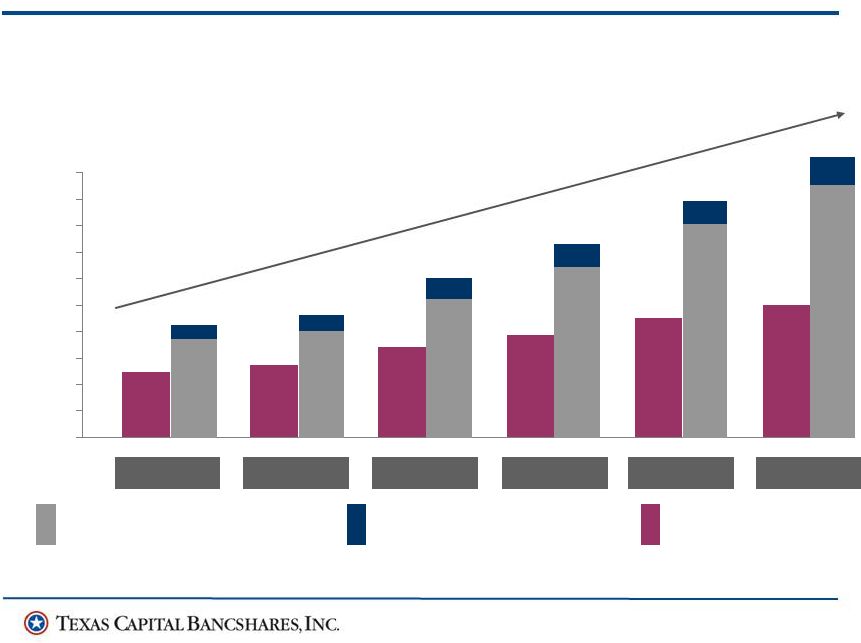
160,379
174,207
225,951
273,937
335,169
397,042
Operating Revenue CAGR: 22%
Net
Interest
Non-interest Income CAGR: 15%
Non-interest Expense CAGR: 19%
Net Income CAGR: 33%
Revenue and Expense Growth
*Excludes OREO valuation expenses
^Annualized based on 6/30/12 data
Net Interest Income
Non-interest
Income
Non-interest Expense
2007
2008
2009
2010*
2011*
Q2-2012*^
98,606
109,651
137,733
154,985
181,403
200,770
Income
CAGR:
23% |
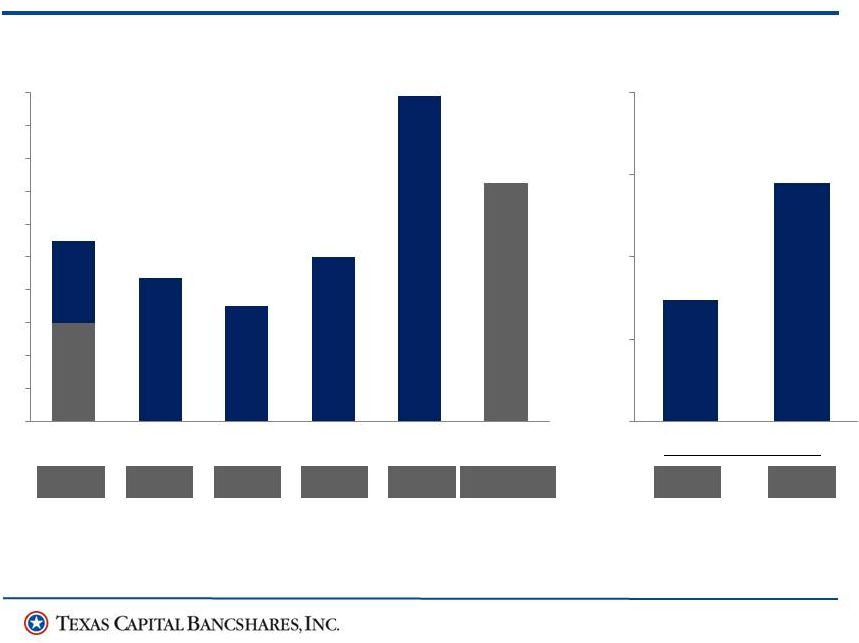 2007
2008
2009^
2010
2011
6 months ended 6/30
Diluted EPS Growth
5 Year EPS CAGR: 19%*
1H 2012
2011
2012
11
$1.10
$0.87
$0.60
$0.70
$1.00
$1.98
$1.45
$0.74
$1.45
$2.00
$1.80
$1.60
$1.40
$1.20
$1.00
$0.80
$0.60
$0.40
$0.20
$0.00
$2.00
$1.50
$1.00
$0.50
$0.00
*1H 2007 –
1H 2012
^Excludes $.15 effect of preferred TARP dividend during 2009. Reported EPS was
$0.55. |
 12
Deposit and Loan Growth
Loans HFI
Interest
Bearing
Deposits
Demand
Deposits
2007
2008
2009
2010
2011
($ in millions)
Q2-2012
Demand Deposit CAGR: 35%
Total Deposit CAGR:
19%
Loans Held for Investment CAGR: 14%
$7,000
$6,000
$5,000
$4,000
$3,000
$2,000
$1,000
$0
3,462
4,028
4,457
4,711
5,572
6,235
3,066
3,333
4,121
5,455
5,557
6,660 |
 13
Deposit and Loan Growth
Loans HFI
Interest
Bearing
Deposits
Demand
Deposits
2007
2008
2009
2010
2011
($ in millions)
Q2-2012
Demand Deposit CAGR: 35%
Total Deposit CAGR:
19%
Loans Held for Investment CAGR: 14%
$7,000
$6,000
$5,000
$4,000
$3,000
$2,000
$1,000
$0
3,462
4,028
4,457
4,711
5,572
6,235
3,066
3,333
4,121
5,455
5,557
6,660 |
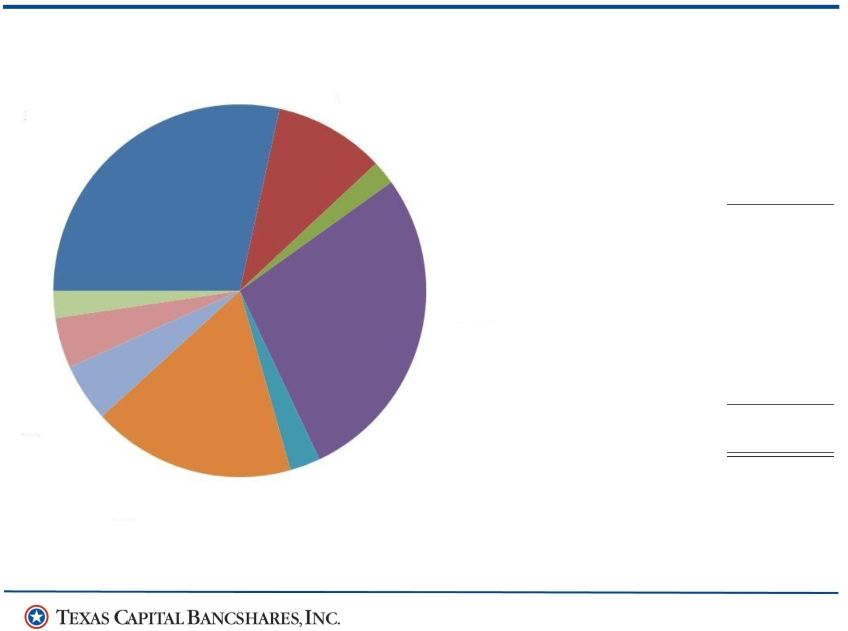 14
Loan Portfolio Statistics
Non-accrual loans
Commercial
Construction
Real estate
Consumer
Equipment leases
Total non-accrual loans
Non-accrual loans as % of
loans held for investment
Non-accrual loans as % of
total loans
OREO
Total Non-accruals +
OREO
Non-accrual loans + OREO
as % of loans held for
investment + OREO
Total Loans $8,642,724
All numbers in thousands.
Loan Collateral by Type 6/30/12
Business Assets
28%
Unsecured
2%
Owner Occupied
R/E
4%
Residential R/E
Mkt. Risk
5%
Comml. R/E Mkt.
Risk
18%
Other Assets
3%
Loans held for
sale
28%
Energy
10%
Highly Liquid
Assets
2%
19,959
16,705
269
252
56,433
.91%
.65%
27,882
84,315
1.35%
19,248
$
$
$ |
 15
Improved Credit Trends
–
Total credit cost of $4.1 million for Q2-2012, compared to $ 5.7 million in
Q1-2012 and $8.7 million in Q2-2011
•
Provision of $1.0 million for Q2-2012 compared to $ 3.0 million for
Q1-2012 and $8.0 million in Q2-2011, reflecting better
trends •
NCOs of $533,000, representing 4 bps compared to 6 bps for Q1-2012 and 86
bps in Q2-2011
•
OREO valuation charge of $3.1 million compared to $ 2.7 million in Q1-2012
and $725,000 in Q2-2011; ORE gain on sale of $433,000 in other income
for net of $2.7 million
–
NPAs continue to decline as percentage of loans; up slightly in absolute
dollars •
Reduction of $20.9 million (20%) from Q2-2011
•
NPA ratio of 1.35% compared to 1.42 % in Q1-2012 and 2.03% in
Q2-2011 •
NPLs at $56.4 million, up $6.3 million from Q1-2012 and down $21.5 million
from Q2-2011
•
NPL ratio at 0.65% of total loans and 0.91% of LHI
–
Achieved reduction in credit costs consistent with improvement in credit
metrics Credit Quality |
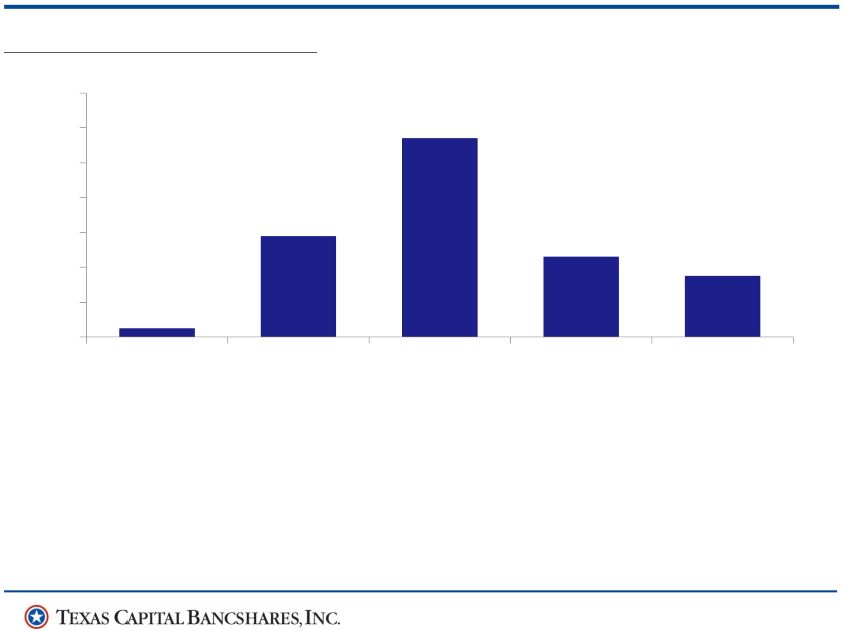 16
Credit Quality
Combined reserve
/ Loans
*
1.21%
1.31%
1.56%
1.59%
1.16%
Non-accrual loans
+ OREO to
loans
*
+ OREO
1.35%
1.58%
3.25%
2.74%
1.81%
Combined reserve
to non-accruals
1.3x
1.3x
.6x
.7x
1.0x
Net Charge-offs / Average Loans
* Excludes loans held for sale.
0.05%
0.58%
1.14%
0.46%
0.35%
2012
2011
2010
2009
2008
1.40%
1.20%
1.00%
0.40%
1.20%
0.00%
0.80%
0.60% |
 17
Closing Comments
•
Strong core earnings and growth continuing in 2012
•
Credit cost improvements have been exceptional
•
Strong LHI pipeline presents opportunity for growth potential
•
LHS balances could grow modestly with increased market share and
benefits of participation program
•
Business model has produced and should continue to produce
industry-leading results |
 Q&A |