Attached files
| file | filename |
|---|---|
| 8-K - 8-K - O-I Glass, Inc. /DE/ | a12-16993_18k.htm |
| EX-99.1 - EX-99.1 - O-I Glass, Inc. /DE/ | a12-16993_1ex99d1.htm |
Exhibit 99.2
|
|
O-I earnings presentation Second Quarter 2012 |
|
|
1 Introduction Agenda Financial review Business discussion and outlook Concluding remarks and Q&A Presenters Regulation G The information presented above regarding adjusted net earnings relates to net earnings attributable to the Company exclusive of items management considers not representative of ongoing operations and does not conform to U.S. generally accepted accounting principles (GAAP). It should not be construed as an alternative to the reported results determined in accordance with GAAP. Management has included this non-GAAP information to assist in understanding the comparability of results of ongoing operations. Management uses this non-GAAP information principally for internal reporting, forecasting, budgeting and calculating bonus payments. Further, the information presented above regarding free cash flow does not conform to GAAP. Management defines free cash flow as cash provided by continuing operating activities less capital spending (both as determined in accordance with GAAP) and has included this non-GAAP information to assist in understanding the comparability of cash flows. Management uses this non-GAAP information principally for internal reporting, forecasting and budgeting. Management believes that the non-GAAP presentation allows the board of directors, management, investors and analysts to better understand the Company’s financial performance in relationship to core operating results and the business outlook. Forward Looking Statements This news release contains "forward looking" statements within the meaning of Section 21E of the Securities Exchange Act of 1934 and Section 27A of the Securities Act of 1933. Forward looking statements reflect the Company's current expectations and projections about future events at the time, and thus involve uncertainty and risk. The words “believe,” “expect,” “anticipate,” “will,” “could,” “would,” “should,” “may,” “plan,” “estimate,” “intend,” “predict,” “potential,” “continue,” and the negatives of these words and other similar expressions generally identify forward looking statements. It is possible the Company's future financial performance may differ from expectations due to a variety of factors including, but not limited to the following: (1) foreign currency fluctuations relative to the U.S. dollar, specifically the Euro, Brazilian real and Australian dollar, (2) changes in capital availability or cost, including interest rate fluctuations, (3) the general political, economic and competitive conditions in markets and countries where the Company has operations, including uncertainties related to the economic conditions in Europe and Australia, the expropriation of the Company’s operations in Venezuela, disruptions in capital markets, disruptions in the supply chain, competitive pricing pressures, inflation or deflation, and changes in tax rates and laws, (4) consumer preferences for alternative forms of packaging, (5) fluctuations in raw material and labor costs, (6) availability of raw materials, (7) costs and availability of energy, including natural gas prices, (8) transportation costs, (9) the ability of the Company to raise selling prices commensurate with energy and other cost increases, (10) consolidation among competitors and customers, (11) the ability of the Company to acquire businesses and expand plants, integrate operations of acquired businesses and achieve expected synergies, (12) unanticipated expenditures with respect to environmental, safety and health laws, (13) the performance by customers of their obligations under purchase agreements, (14) the Company’s ability to further develop its sales, marketing and product development capabilities, (15) the Company’s success in implementing necessary restructuring plans and the impact of such restructuring plans on the carrying value of recorded goodwill, (16) the Company’s ability to successfully navigate the structural changes in Australia, and (17) the timing and occurrence of events which are beyond the control of the Company, including any expropriation of the Company’s operations, floods and other natural disasters, and events related to asbestos-related claims. It is not possible to foresee or identify all such factors. Any forward looking statements in this document are based on certain assumptions and analyses made by the Company in light of its experience and perception of historical trends, current conditions, expected future developments, and other factors it believes are appropriate in the circumstances. Forward looking statements are not a guarantee of future performance and actual results or developments may differ materially from expectations. While the Company continually reviews trends and uncertainties affecting the Company's results of operations and financial condition, the Company does not assume any obligation to update or supplement any particular forward looking statements contained in this news release. Presentation Note Unless otherwise noted, the information presented in this presentation reflects continuing operations only. Al Stroucken Chairman and CEO Steve Bramlage SVP and CFO |
|
|
2 Strong Operating Performance Boosts Profit Financial review 1 Reportable segment sales in 2Q12 exclude $7 million of revenue, principally for the Company’s global equipment sales business. 2 Contractual cost-pass through provision primarily relates to North American energy costs. 3 Primarily relates to improved manufacturing and supply chain efficiencies in North America, as well as cost savings. . 2Q12 Recap Adjusted EPS was $0.81/sh, $0.59/sh in 2Q11 Strong operating performance, esp. in N.A. Shipments down ~6% YoY driven by Europe Price/mix up >4% YoY Significant Fx headwinds Cost pass-through provision Reportable Segments Operating Adjusted Sales (1) Profit Net Income ($ Millions) ($ Millions) (Non-GAAP EPS) 2Q11 $1,941 $224 $0.59 Price Price and product mix 82 82 0.37 Cost pass-through provision (2) (10) - - Cost Inflation (52) (0.24) Spread 30 0.13 Sales volume (95) (26) (0.12) Manufacturing and delivery (3) 49 0.22 Operating and other costs 12 0.05 Currency translation (159) (23) (0.10) Operational (182) 42 0.18 Retained corporate costs (0.06) Net interest expense 0.06 Noncontrolling interests 0.02 Effective tax rate 0.02 Non-operational - - 0.04 Total reconciling items (182) 42 0.22 2Q12 $1,759 $266 $0.81 (2) |
|
|
3 Balance Sheet, Cash Flow and Capital Structure Financial review Highlights of select balance sheet and cash flow items ($M) 1 Total debt less cash divided by bank credit agreement EBITDA. See appendix for EBITDA reconciliations. Current bank covenants allow for a maximum ratio of 4.0x. 2 Free cash flow is defined as cash provided by continuing operating activities less capital spending. Leverage Ratio Mgmt target leverage range ($48) Highlights of select balance sheet and cash flow items ($M) 2Q12 2Q11 YoY Cash $336 $260 $76 Debt $4,019 $4,340 ($321) Net debt $3,683 $4,080 ($397) Net debt to EBITDA (1) 2.8x 3.2x (0.4x) Free Cash Flow (2) $49 $97 ($48) Capital expenditures ($51) ($80) $29 Working capital source/(use) ($105) $30 ($135) Asbestos payments ($28) ($35) $7 |
|
|
4 North American Region Drives Profit Improvement Business discussion ($ Millions) Second Quarter Segment Operating Profit 2Q12 $266M (as reported) 2Q12 $289M (at prior year currency exchange rate) 2Q11 $224M |
|
|
3Q12 Business Outlook Favorable / Unfavorable Impact on Earnings 3Q12 vs 3Q11 Comments Operational Europe Sales volumes down mid to high single-digits; production levels down double-digits Price increases recovering inflation Fx headwind continues North America Sales volumes flat Operations running at steady state and in line with prior year Asia Pacific Sales volumes remain pressured in Australia and New Zealand Capacity aligning with demand and reducing fixed costs South America Sales volumes up mid single-digits, led by Brazil Fx headwind continues Non-Operational Corporate and Other Costs Corporate costs expected to approximate 1H12 levels Annual ETR expected to range between 24-25% Net Income Adjusted Earnings 3Q12 adjusted earnings expected to be below 3Q11 level, driven by EU production downtime and Fx headwinds 5 |
|
|
6 Concluding Remarks and Q&A Good first half performance Excellent YoY recovery in North America Varying demand trends expected for 2H12 Positive shipment trends expected in South America Europe volumes expected to be a challenge Free cash flow now expected to be at least $250M for FY12 Debt paydown remains as primary capital allocation priority Third quarter 2012 earnings dates Press release to be issued after market close Wednesday, October 24, 2012 Earnings conference call Thursday, October 25, 2012 @ 8:30 am ET |
|
|
Appendix |

|
|
8 Reconciliation of GAAP to non-GAAP Items Three months ended June 30 Six months ended June 30 $ Millions, except per-share amts 2012 2011 2012 2011 Earnings EPS Earnings EPS Earnings EPS Earnings EPS Earnings from continuing operations $134 $0.81 $71 $0.42 $256 $1.54 $154 $0.92 attributable to the Company Items that management considers not representative of ongoing operations consistent with Segment Operating Profit • Charges for note repurchase premiums and write-off of finance fees 24 0.15 24 0.15 • Charges for restructuring 3 0.02 8 0.05 Adjusted net earnings $134 $0.81 $98 $0.59 $256 $1.54 $186 $1.12 Diluted shares outstanding (millions) 165.9 166.3 166.1 166.2 |
|
|
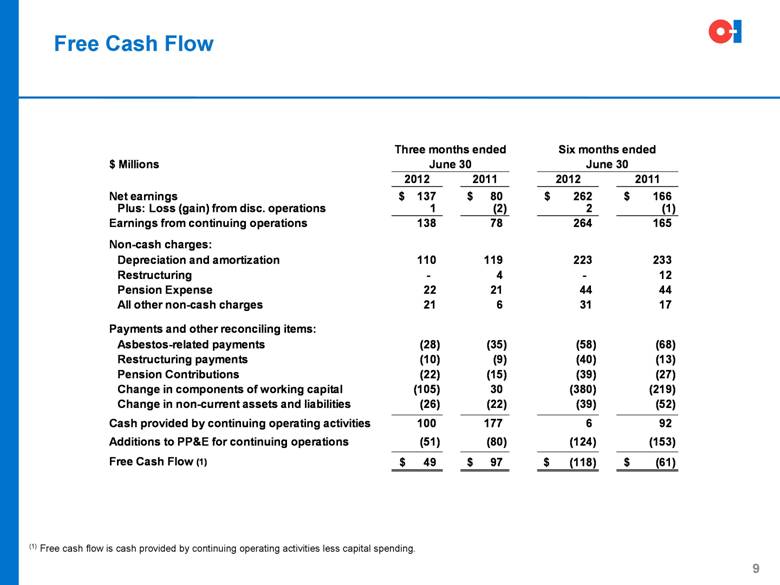
9 Free Cash Flow (1) Free cash flow is cash provided by continuing operating activities less capital spending. Three months ended Six months ended $Millions June 30 June 30 2012 2011 2012 2011 Net earnings $137 $80 $262 $166 Plus: Loss (gain) from disc. operations 1 (2) 2 (1) Earnings from continuing operations 138 78 264 165 Non-cash charges: Depreciation and amortization 110 119 223 233 Restructuring - 4 - 12 Pension Expense 22 21 44 44 All other non-cash charges 21 6 31 17 Payments and other reconciling items: Asbestos-related payments (28) (35) (58) (68) Restructuring payments (10) (9) (40) (13) Pension Contributions (22) (15) (39) (27) Change in components of working capital (105) 30 (380) (219) Change in non-current assets and liabilities (26) (22) (39) (52) Cash provided by continuing operating activities 100 177 6 92 Additions to PP&E for continuing operations (51) (80) (124) (153) Free Cash Flow (1) $49 $97 $(118) $(61) |
|
|
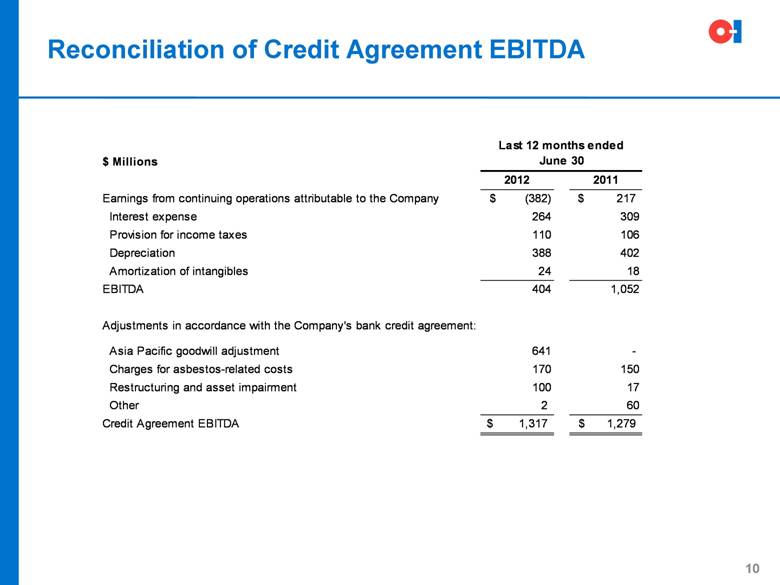
Reconciliation of Credit Agreement EBITDA 10 $ Millions 2012 2011 Earnings from continuing operations attributable to the Company (382) $ 217 $ Interest expense 264 309 Provision for income taxes 110 106 Depreciation 388 402 Amortization of intangibles 24 18 EBITDA 404 1,052 Adjustments in accordance with the Company's bank credit agreement: Asia Pacific goodwill adjustment 641 - Charges for asbestos-related costs 170 150 Restructuring and asset impairment 100 17 Other 2 60 Credit Agreement EBITDA 1,317 $ 1,279 $ Last 12 months ended June 30 |